
Key Insights
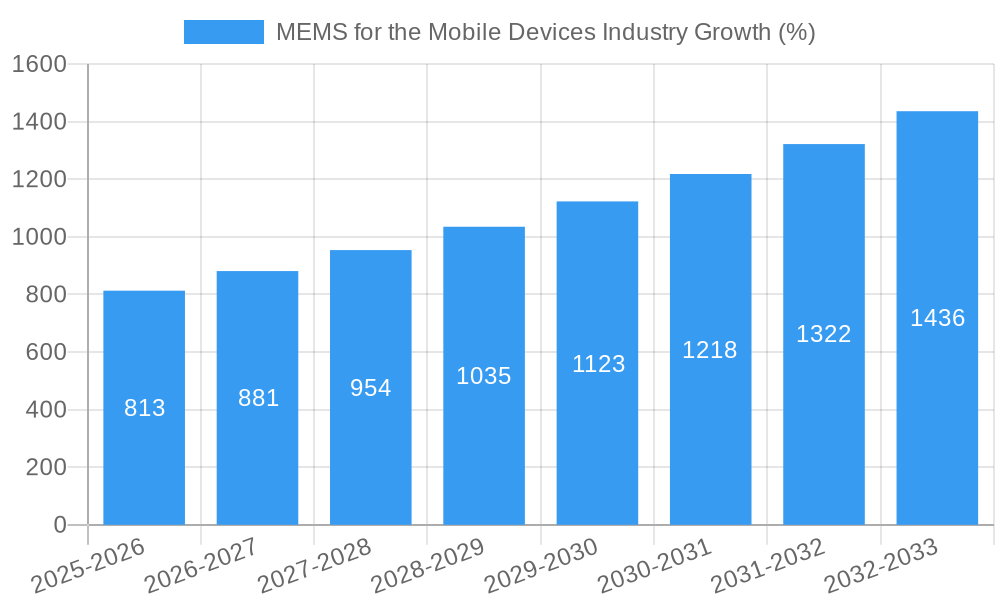
The MEMS (Microelectromechanical Systems) market for mobile devices is experiencing robust growth, projected to reach a substantial size with a Compound Annual Growth Rate (CAGR) of 8.80% from 2025 to 2033. This expansion is driven by several key factors. The increasing demand for advanced smartphone features, such as improved camera stabilization (requiring gyroscopes and accelerometers), enhanced fingerprint recognition (fingerprint sensors), and improved audio quality (microphones), fuels the high adoption rate of MEMS technology. Furthermore, the burgeoning wearable technology and IoT (Internet of Things) sectors are significant contributors to this growth, as these devices increasingly rely on MEMS sensors for functions like activity tracking, environmental monitoring, and proximity detection. The diverse range of MEMS sensors used in mobile applications, including accelerometers, gyroscopes, pressure sensors, and BAW (Bulk Acoustic Wave) sensors, further fuels market expansion. Competition among leading manufacturers like Knowles Corporation, AAC Technologies, and Bosch Sensortec GmbH drives innovation and cost reduction, making MEMS technology more accessible and attractive for device manufacturers.
Geographic distribution shows a strong presence across all regions, with North America and Asia Pacific expected to remain dominant markets due to high smartphone penetration and robust electronics manufacturing capabilities. However, emerging economies in Asia Pacific and South America are showing significant growth potential as mobile device adoption rates accelerate. While challenges like technological advancements requiring adaptation and increasing competition may pose some restraints, the overall outlook for the MEMS market in the mobile device industry remains overwhelmingly positive, with continuous innovation and increasing integration of MEMS into diverse applications ensuring sustained growth throughout the forecast period. This growth trajectory reflects a consistent and expanding demand for smaller, more powerful, and energy-efficient devices, a trend directly supported by the capabilities offered by MEMS technology.

MEMS for the Mobile Devices Industry: A Comprehensive Market Report (2019-2033)
This comprehensive report provides an in-depth analysis of the MEMS (Microelectromechanical Systems) market for mobile devices, encompassing market dynamics, growth trends, regional dominance, product landscape, and key players. The study period covers 2019-2033, with a base year of 2025 and a forecast period of 2025-2033. The report leverages extensive data analysis to offer actionable insights for industry professionals and stakeholders. The market is segmented by sensor type (Fingerprint Sensor, Accelerometer Sensor, Gyroscope, Pressure Sensor, BAW Sensor, Microphones, Other Types of Sensors) and application (Smartphones, Tablets, Wearable Devices, IoT Devices). The total market size in 2025 is estimated at xx Million units.
MEMS for the Mobile Devices Industry Market Dynamics & Structure
The mobile device MEMS market is a dynamic landscape shaped by intense competition, rapid technological advancements, evolving regulatory landscapes, and consistent market trends. While a few key players dominate the market, the competitive structure is far from static. New entrants and disruptive innovations frequently reshape the competitive dynamics. Technological advancements, particularly in miniaturization, power efficiency, and enhanced sensitivity, are crucial growth drivers. Stringent regulatory frameworks governing data privacy and security significantly influence sensor design, deployment strategies, and overall market adoption. The market also exhibits considerable merger and acquisition (M&A) activity, with established companies strategically acquiring smaller players to expand their product portfolios and enhance market share. This activity reflects the high value placed on innovative sensor technologies and the desire to control key aspects of the supply chain.
- Market Concentration: Moderately concentrated, with the top 5 players holding an estimated [Insert Updated Percentage]% market share in 2025. This concentration is expected to [Increase/Decrease/Remain Stable] in the coming years due to [Explain reason].
- Technological Innovation: Continuous improvements in miniaturization, sensitivity, power consumption, and signal processing are key drivers, fueled by advancements in materials science and manufacturing processes. The integration of multiple sensor functionalities onto single chips is a prominent trend.
- Regulatory Frameworks: Data privacy regulations, such as GDPR and CCPA, are significantly impacting sensor design and deployment. Compliance requirements are driving the development of more secure and privacy-preserving MEMS solutions.
- Competitive Substitutes: While limited direct substitutes exist, alternative technologies, including software-based sensor emulations, are constantly emerging, posing a potential challenge to MEMS dominance in specific applications.
- End-User Demographics: Market growth is strongly correlated with the increasing penetration of smartphones and wearable devices, particularly in developing economies with expanding middle classes and rising disposable incomes.
- M&A Trends: Significant M&A activity is expected to continue, with an estimated [Insert Updated Average] deals annually over the next 5 years, driven by [Specific drivers like technology acquisition, market expansion, or supply chain control].
MEMS for the Mobile Devices Industry Growth Trends & Insights
The MEMS for mobile devices market has witnessed substantial growth over the historical period (2019-2024), driven by the rapid expansion of the smartphone and wearable device market. The market is projected to continue its expansion, with a CAGR of xx% during the forecast period (2025-2033). This growth is fueled by several factors, including the increasing demand for advanced sensor functionalities in mobile devices, the rise of IoT applications, and advancements in MEMS technology. Market penetration of MEMS sensors in smartphones is currently estimated at xx%, with projected growth to xx% by 2033. The adoption of new technologies, such as 5G and AI, will further fuel market expansion. Shifting consumer preferences towards devices with enhanced functionalities will contribute to this growth.
Dominant Regions, Countries, or Segments in MEMS for the Mobile Devices Industry
Asia-Pacific is projected to be the dominant region in the global MEMS market for mobile devices throughout the forecast period. This region's dominance is fueled by several factors:
- High Smartphone and Wearable Device Penetration: The region boasts a large and rapidly growing consumer base for mobile devices.
- Strong Manufacturing Base: Asia-Pacific houses a significant number of electronics manufacturers, lowering production costs.
- Government Support: Several governments in the region promote technological innovation and support the semiconductor industry.
Within sensor types, accelerometer sensors and gyroscope sensors are projected to dominate the market due to their prevalence in mobile devices for motion sensing applications. The smartphone segment will remain the largest application area.
MEMS for the Mobile Devices Industry Product Landscape
The MEMS technology landscape is characterized by constant evolution, driving the development of smaller, more energy-efficient, and higher-performance sensors. Recent innovations include the integration of multiple sensor functionalities onto a single chip (e.g., IMU, barometer, proximity), advanced signal processing capabilities embedded directly within the sensor, and the emergence of novel sensor types catering to new functionalities in mobile devices (e.g., advanced biometric sensors, environmental sensors). These advancements are pivotal in meeting the growing demand for sophisticated, power-efficient, and reliable sensor performance in increasingly feature-rich mobile devices. Key unique selling propositions continue to be miniaturization, low power consumption, high accuracy, and seamless integration capabilities.
Key Drivers, Barriers & Challenges in MEMS for the Mobile Devices Industry
Key Drivers:
- Growing Smartphone and Wearable Market: This is the primary driver, demanding more advanced sensor functionalities.
- IoT Expansion: The expansion of the IoT sector necessitates more sensors for various applications.
- Technological Advancements: Continued innovation in miniaturization and improved sensor performance.
Challenges:
- Supply Chain Disruptions: Geopolitical events and component shortages can impact production. The estimated impact on market growth in 2023 due to this factor is xx%.
- Regulatory Hurdles: Stringent regulations regarding data privacy and security pose challenges.
- Intense Competition: A significant number of players exist in the market, creating intense competition.
Emerging Opportunities in MEMS for the Mobile Devices Industry
- Expansion into New Applications: MEMS sensors are rapidly expanding beyond mobile devices into adjacent markets, including automotive (ADAS, driver monitoring), healthcare (wearable health monitoring), industrial automation (precision motion control), and smart home applications (environmental monitoring).
- Integration with AI: The integration of MEMS sensors with AI algorithms at the edge is revolutionizing data processing capabilities, enabling real-time insights and advanced functionalities like predictive maintenance and context-aware applications.
- Development of Novel Sensor Technologies: The development of advanced sensor types with enhanced functionalities—such as improved sensitivity, wider operating ranges, and miniaturization beyond current limits—will continue to open up exciting market opportunities and drive future growth.
- Growth in Advanced Packaging Technologies: New packaging methods that offer enhanced protection, smaller footprints, and improved performance characteristics are critical to meeting the demands of next-generation devices.
Growth Accelerators in the MEMS for the Mobile Devices Industry Industry
Technological breakthroughs, such as the development of advanced materials and fabrication processes, are key growth accelerators. Strategic partnerships between MEMS manufacturers and mobile device companies are streamlining product development and accelerating market penetration. The expansion into new and emerging markets will provide significant growth opportunities.
Key Players Shaping the MEMS for the Mobile Devices Industry Market
- Knowles Corporation
- AAC Technologies
- InvenSense Inc (TDK)
- MEMSIC Inc
- Goertek Inc
- Bosch Sensortec GmbH
- Murata Manufacturing
- STMicroelectronics NV
- Analog Devices Inc
- BSE Co Ltd
Notable Milestones in MEMS for the Mobile Devices Industry Sector
- December 2022: Knowles introduced new balanced armatures and MEMS microphones for over-the-counter hearing aids, expanding its product portfolio into the hearing health market.
- November 2022: Bosch partnered with Hahn-Schickard to develop MEMS micro speakers, strengthening its position in audio applications.
In-Depth MEMS for the Mobile Devices Industry Market Outlook
The MEMS market for mobile devices is projected to experience robust growth, driven by consistent technological innovation, the increasing demand for enhanced sensor functionalities in increasingly sophisticated devices, and the expansion into diverse application areas. Strategic partnerships, focused R&D investments, and the successful development and integration of cutting-edge sensor technologies will be key factors driving market expansion. The ongoing emphasis on miniaturization, ultra-low power consumption, improved accuracy, and enhanced data security will continue to shape the market's future trajectory, presenting significant opportunities for innovation and substantial growth.
MEMS for the Mobile Devices Industry Segmentation
-
1. Type of Sensor
- 1.1. Fingerprint Sensor
- 1.2. Accelerometer Sensor
- 1.3. Gyroscope
- 1.4. Pressure Sensor
- 1.5. BAW Sensor
- 1.6. Microphones
- 1.7. Other Types of Sensors
MEMS for the Mobile Devices Industry Segmentation By Geography
- 1. North America
- 2. Europe
- 3. Asia Pacific
- 4. Latin America
- 5. Middle East and Africa

MEMS for the Mobile Devices Industry REPORT HIGHLIGHTS
| Aspects | Details |
|---|---|
| Study Period | 2019-2033 |
| Base Year | 2024 |
| Estimated Year | 2025 |
| Forecast Period | 2025-2033 |
| Historical Period | 2019-2024 |
| Growth Rate | CAGR of 8.80% from 2019-2033 |
| Segmentation |
|
Table of Contents
- 1. Introduction
- 1.1. Research Scope
- 1.2. Market Segmentation
- 1.3. Research Methodology
- 1.4. Definitions and Assumptions
- 2. Executive Summary
- 2.1. Introduction
- 3. Market Dynamics
- 3.1. Introduction
- 3.2. Market Drivers
- 3.2.1. Increasing Acceptance of Miniaturization Trend; Increasing Demand for High-Performance Devices
- 3.3. Market Restrains
- 3.3.1. Highly Complex Manufacturing Process and Demanding Cycle Time; Lack of Standardized Fabrication Process
- 3.4. Market Trends
- 3.4.1. Increasing Acceptance of Miniaturization Trend to Drive the Market
- 4. Market Factor Analysis
- 4.1. Porters Five Forces
- 4.2. Supply/Value Chain
- 4.3. PESTEL analysis
- 4.4. Market Entropy
- 4.5. Patent/Trademark Analysis
- 5. Global MEMS for the Mobile Devices Industry Analysis, Insights and Forecast, 2019-2031
- 5.1. Market Analysis, Insights and Forecast - by Type of Sensor
- 5.1.1. Fingerprint Sensor
- 5.1.2. Accelerometer Sensor
- 5.1.3. Gyroscope
- 5.1.4. Pressure Sensor
- 5.1.5. BAW Sensor
- 5.1.6. Microphones
- 5.1.7. Other Types of Sensors
- 5.2. Market Analysis, Insights and Forecast - by Region
- 5.2.1. North America
- 5.2.2. Europe
- 5.2.3. Asia Pacific
- 5.2.4. Latin America
- 5.2.5. Middle East and Africa
- 5.1. Market Analysis, Insights and Forecast - by Type of Sensor
- 6. North America MEMS for the Mobile Devices Industry Analysis, Insights and Forecast, 2019-2031
- 6.1. Market Analysis, Insights and Forecast - by Type of Sensor
- 6.1.1. Fingerprint Sensor
- 6.1.2. Accelerometer Sensor
- 6.1.3. Gyroscope
- 6.1.4. Pressure Sensor
- 6.1.5. BAW Sensor
- 6.1.6. Microphones
- 6.1.7. Other Types of Sensors
- 6.1. Market Analysis, Insights and Forecast - by Type of Sensor
- 7. Europe MEMS for the Mobile Devices Industry Analysis, Insights and Forecast, 2019-2031
- 7.1. Market Analysis, Insights and Forecast - by Type of Sensor
- 7.1.1. Fingerprint Sensor
- 7.1.2. Accelerometer Sensor
- 7.1.3. Gyroscope
- 7.1.4. Pressure Sensor
- 7.1.5. BAW Sensor
- 7.1.6. Microphones
- 7.1.7. Other Types of Sensors
- 7.1. Market Analysis, Insights and Forecast - by Type of Sensor
- 8. Asia Pacific MEMS for the Mobile Devices Industry Analysis, Insights and Forecast, 2019-2031
- 8.1. Market Analysis, Insights and Forecast - by Type of Sensor
- 8.1.1. Fingerprint Sensor
- 8.1.2. Accelerometer Sensor
- 8.1.3. Gyroscope
- 8.1.4. Pressure Sensor
- 8.1.5. BAW Sensor
- 8.1.6. Microphones
- 8.1.7. Other Types of Sensors
- 8.1. Market Analysis, Insights and Forecast - by Type of Sensor
- 9. Latin America MEMS for the Mobile Devices Industry Analysis, Insights and Forecast, 2019-2031
- 9.1. Market Analysis, Insights and Forecast - by Type of Sensor
- 9.1.1. Fingerprint Sensor
- 9.1.2. Accelerometer Sensor
- 9.1.3. Gyroscope
- 9.1.4. Pressure Sensor
- 9.1.5. BAW Sensor
- 9.1.6. Microphones
- 9.1.7. Other Types of Sensors
- 9.1. Market Analysis, Insights and Forecast - by Type of Sensor
- 10. Middle East and Africa MEMS for the Mobile Devices Industry Analysis, Insights and Forecast, 2019-2031
- 10.1. Market Analysis, Insights and Forecast - by Type of Sensor
- 10.1.1. Fingerprint Sensor
- 10.1.2. Accelerometer Sensor
- 10.1.3. Gyroscope
- 10.1.4. Pressure Sensor
- 10.1.5. BAW Sensor
- 10.1.6. Microphones
- 10.1.7. Other Types of Sensors
- 10.1. Market Analysis, Insights and Forecast - by Type of Sensor
- 11. North America MEMS for the Mobile Devices Industry Analysis, Insights and Forecast, 2019-2031
- 11.1. Market Analysis, Insights and Forecast - By Country/Sub-region
- 11.1.1 United States
- 11.1.2 Canada
- 11.1.3 Mexico
- 12. Europe MEMS for the Mobile Devices Industry Analysis, Insights and Forecast, 2019-2031
- 12.1. Market Analysis, Insights and Forecast - By Country/Sub-region
- 12.1.1 Germany
- 12.1.2 United Kingdom
- 12.1.3 France
- 12.1.4 Spain
- 12.1.5 Italy
- 12.1.6 Spain
- 12.1.7 Belgium
- 12.1.8 Netherland
- 12.1.9 Nordics
- 12.1.10 Rest of Europe
- 13. Asia Pacific MEMS for the Mobile Devices Industry Analysis, Insights and Forecast, 2019-2031
- 13.1. Market Analysis, Insights and Forecast - By Country/Sub-region
- 13.1.1 China
- 13.1.2 Japan
- 13.1.3 India
- 13.1.4 South Korea
- 13.1.5 Southeast Asia
- 13.1.6 Australia
- 13.1.7 Indonesia
- 13.1.8 Phillipes
- 13.1.9 Singapore
- 13.1.10 Thailandc
- 13.1.11 Rest of Asia Pacific
- 14. South America MEMS for the Mobile Devices Industry Analysis, Insights and Forecast, 2019-2031
- 14.1. Market Analysis, Insights and Forecast - By Country/Sub-region
- 14.1.1 Brazil
- 14.1.2 Argentina
- 14.1.3 Peru
- 14.1.4 Chile
- 14.1.5 Colombia
- 14.1.6 Ecuador
- 14.1.7 Venezuela
- 14.1.8 Rest of South America
- 15. MEA MEMS for the Mobile Devices Industry Analysis, Insights and Forecast, 2019-2031
- 15.1. Market Analysis, Insights and Forecast - By Country/Sub-region
- 15.1.1 United Arab Emirates
- 15.1.2 Saudi Arabia
- 15.1.3 South Africa
- 15.1.4 Rest of Middle East and Africa
- 16. Competitive Analysis
- 16.1. Global Market Share Analysis 2024
- 16.2. Company Profiles
- 16.2.1 Knowles Corporation
- 16.2.1.1. Overview
- 16.2.1.2. Products
- 16.2.1.3. SWOT Analysis
- 16.2.1.4. Recent Developments
- 16.2.1.5. Financials (Based on Availability)
- 16.2.2 AAC Technologies
- 16.2.2.1. Overview
- 16.2.2.2. Products
- 16.2.2.3. SWOT Analysis
- 16.2.2.4. Recent Developments
- 16.2.2.5. Financials (Based on Availability)
- 16.2.3 InvenSense Inc (TDK)
- 16.2.3.1. Overview
- 16.2.3.2. Products
- 16.2.3.3. SWOT Analysis
- 16.2.3.4. Recent Developments
- 16.2.3.5. Financials (Based on Availability)
- 16.2.4 MEMSIC Inc
- 16.2.4.1. Overview
- 16.2.4.2. Products
- 16.2.4.3. SWOT Analysis
- 16.2.4.4. Recent Developments
- 16.2.4.5. Financials (Based on Availability)
- 16.2.5 Goertek Inc
- 16.2.5.1. Overview
- 16.2.5.2. Products
- 16.2.5.3. SWOT Analysis
- 16.2.5.4. Recent Developments
- 16.2.5.5. Financials (Based on Availability)
- 16.2.6 Bosch Sensortec GmbH
- 16.2.6.1. Overview
- 16.2.6.2. Products
- 16.2.6.3. SWOT Analysis
- 16.2.6.4. Recent Developments
- 16.2.6.5. Financials (Based on Availability)
- 16.2.7 Murata Manufacturing
- 16.2.7.1. Overview
- 16.2.7.2. Products
- 16.2.7.3. SWOT Analysis
- 16.2.7.4. Recent Developments
- 16.2.7.5. Financials (Based on Availability)
- 16.2.8 STMicroelectronics NV
- 16.2.8.1. Overview
- 16.2.8.2. Products
- 16.2.8.3. SWOT Analysis
- 16.2.8.4. Recent Developments
- 16.2.8.5. Financials (Based on Availability)
- 16.2.9 Analog Devices Inc
- 16.2.9.1. Overview
- 16.2.9.2. Products
- 16.2.9.3. SWOT Analysis
- 16.2.9.4. Recent Developments
- 16.2.9.5. Financials (Based on Availability)
- 16.2.10 BSE Co Ltd
- 16.2.10.1. Overview
- 16.2.10.2. Products
- 16.2.10.3. SWOT Analysis
- 16.2.10.4. Recent Developments
- 16.2.10.5. Financials (Based on Availability)
- 16.2.1 Knowles Corporation
List of Figures
- Figure 1: Global MEMS for the Mobile Devices Industry Revenue Breakdown (Million, %) by Region 2024 & 2032
- Figure 2: Global MEMS for the Mobile Devices Industry Volume Breakdown (K Unit, %) by Region 2024 & 2032
- Figure 3: North America MEMS for the Mobile Devices Industry Revenue (Million), by Country 2024 & 2032
- Figure 4: North America MEMS for the Mobile Devices Industry Volume (K Unit), by Country 2024 & 2032
- Figure 5: North America MEMS for the Mobile Devices Industry Revenue Share (%), by Country 2024 & 2032
- Figure 6: North America MEMS for the Mobile Devices Industry Volume Share (%), by Country 2024 & 2032
- Figure 7: Europe MEMS for the Mobile Devices Industry Revenue (Million), by Country 2024 & 2032
- Figure 8: Europe MEMS for the Mobile Devices Industry Volume (K Unit), by Country 2024 & 2032
- Figure 9: Europe MEMS for the Mobile Devices Industry Revenue Share (%), by Country 2024 & 2032
- Figure 10: Europe MEMS for the Mobile Devices Industry Volume Share (%), by Country 2024 & 2032
- Figure 11: Asia Pacific MEMS for the Mobile Devices Industry Revenue (Million), by Country 2024 & 2032
- Figure 12: Asia Pacific MEMS for the Mobile Devices Industry Volume (K Unit), by Country 2024 & 2032
- Figure 13: Asia Pacific MEMS for the Mobile Devices Industry Revenue Share (%), by Country 2024 & 2032
- Figure 14: Asia Pacific MEMS for the Mobile Devices Industry Volume Share (%), by Country 2024 & 2032
- Figure 15: South America MEMS for the Mobile Devices Industry Revenue (Million), by Country 2024 & 2032
- Figure 16: South America MEMS for the Mobile Devices Industry Volume (K Unit), by Country 2024 & 2032
- Figure 17: South America MEMS for the Mobile Devices Industry Revenue Share (%), by Country 2024 & 2032
- Figure 18: South America MEMS for the Mobile Devices Industry Volume Share (%), by Country 2024 & 2032
- Figure 19: MEA MEMS for the Mobile Devices Industry Revenue (Million), by Country 2024 & 2032
- Figure 20: MEA MEMS for the Mobile Devices Industry Volume (K Unit), by Country 2024 & 2032
- Figure 21: MEA MEMS for the Mobile Devices Industry Revenue Share (%), by Country 2024 & 2032
- Figure 22: MEA MEMS for the Mobile Devices Industry Volume Share (%), by Country 2024 & 2032
- Figure 23: North America MEMS for the Mobile Devices Industry Revenue (Million), by Type of Sensor 2024 & 2032
- Figure 24: North America MEMS for the Mobile Devices Industry Volume (K Unit), by Type of Sensor 2024 & 2032
- Figure 25: North America MEMS for the Mobile Devices Industry Revenue Share (%), by Type of Sensor 2024 & 2032
- Figure 26: North America MEMS for the Mobile Devices Industry Volume Share (%), by Type of Sensor 2024 & 2032
- Figure 27: North America MEMS for the Mobile Devices Industry Revenue (Million), by Country 2024 & 2032
- Figure 28: North America MEMS for the Mobile Devices Industry Volume (K Unit), by Country 2024 & 2032
- Figure 29: North America MEMS for the Mobile Devices Industry Revenue Share (%), by Country 2024 & 2032
- Figure 30: North America MEMS for the Mobile Devices Industry Volume Share (%), by Country 2024 & 2032
- Figure 31: Europe MEMS for the Mobile Devices Industry Revenue (Million), by Type of Sensor 2024 & 2032
- Figure 32: Europe MEMS for the Mobile Devices Industry Volume (K Unit), by Type of Sensor 2024 & 2032
- Figure 33: Europe MEMS for the Mobile Devices Industry Revenue Share (%), by Type of Sensor 2024 & 2032
- Figure 34: Europe MEMS for the Mobile Devices Industry Volume Share (%), by Type of Sensor 2024 & 2032
- Figure 35: Europe MEMS for the Mobile Devices Industry Revenue (Million), by Country 2024 & 2032
- Figure 36: Europe MEMS for the Mobile Devices Industry Volume (K Unit), by Country 2024 & 2032
- Figure 37: Europe MEMS for the Mobile Devices Industry Revenue Share (%), by Country 2024 & 2032
- Figure 38: Europe MEMS for the Mobile Devices Industry Volume Share (%), by Country 2024 & 2032
- Figure 39: Asia Pacific MEMS for the Mobile Devices Industry Revenue (Million), by Type of Sensor 2024 & 2032
- Figure 40: Asia Pacific MEMS for the Mobile Devices Industry Volume (K Unit), by Type of Sensor 2024 & 2032
- Figure 41: Asia Pacific MEMS for the Mobile Devices Industry Revenue Share (%), by Type of Sensor 2024 & 2032
- Figure 42: Asia Pacific MEMS for the Mobile Devices Industry Volume Share (%), by Type of Sensor 2024 & 2032
- Figure 43: Asia Pacific MEMS for the Mobile Devices Industry Revenue (Million), by Country 2024 & 2032
- Figure 44: Asia Pacific MEMS for the Mobile Devices Industry Volume (K Unit), by Country 2024 & 2032
- Figure 45: Asia Pacific MEMS for the Mobile Devices Industry Revenue Share (%), by Country 2024 & 2032
- Figure 46: Asia Pacific MEMS for the Mobile Devices Industry Volume Share (%), by Country 2024 & 2032
- Figure 47: Latin America MEMS for the Mobile Devices Industry Revenue (Million), by Type of Sensor 2024 & 2032
- Figure 48: Latin America MEMS for the Mobile Devices Industry Volume (K Unit), by Type of Sensor 2024 & 2032
- Figure 49: Latin America MEMS for the Mobile Devices Industry Revenue Share (%), by Type of Sensor 2024 & 2032
- Figure 50: Latin America MEMS for the Mobile Devices Industry Volume Share (%), by Type of Sensor 2024 & 2032
- Figure 51: Latin America MEMS for the Mobile Devices Industry Revenue (Million), by Country 2024 & 2032
- Figure 52: Latin America MEMS for the Mobile Devices Industry Volume (K Unit), by Country 2024 & 2032
- Figure 53: Latin America MEMS for the Mobile Devices Industry Revenue Share (%), by Country 2024 & 2032
- Figure 54: Latin America MEMS for the Mobile Devices Industry Volume Share (%), by Country 2024 & 2032
- Figure 55: Middle East and Africa MEMS for the Mobile Devices Industry Revenue (Million), by Type of Sensor 2024 & 2032
- Figure 56: Middle East and Africa MEMS for the Mobile Devices Industry Volume (K Unit), by Type of Sensor 2024 & 2032
- Figure 57: Middle East and Africa MEMS for the Mobile Devices Industry Revenue Share (%), by Type of Sensor 2024 & 2032
- Figure 58: Middle East and Africa MEMS for the Mobile Devices Industry Volume Share (%), by Type of Sensor 2024 & 2032
- Figure 59: Middle East and Africa MEMS for the Mobile Devices Industry Revenue (Million), by Country 2024 & 2032
- Figure 60: Middle East and Africa MEMS for the Mobile Devices Industry Volume (K Unit), by Country 2024 & 2032
- Figure 61: Middle East and Africa MEMS for the Mobile Devices Industry Revenue Share (%), by Country 2024 & 2032
- Figure 62: Middle East and Africa MEMS for the Mobile Devices Industry Volume Share (%), by Country 2024 & 2032
List of Tables
- Table 1: Global MEMS for the Mobile Devices Industry Revenue Million Forecast, by Region 2019 & 2032
- Table 2: Global MEMS for the Mobile Devices Industry Volume K Unit Forecast, by Region 2019 & 2032
- Table 3: Global MEMS for the Mobile Devices Industry Revenue Million Forecast, by Type of Sensor 2019 & 2032
- Table 4: Global MEMS for the Mobile Devices Industry Volume K Unit Forecast, by Type of Sensor 2019 & 2032
- Table 5: Global MEMS for the Mobile Devices Industry Revenue Million Forecast, by Region 2019 & 2032
- Table 6: Global MEMS for the Mobile Devices Industry Volume K Unit Forecast, by Region 2019 & 2032
- Table 7: Global MEMS for the Mobile Devices Industry Revenue Million Forecast, by Country 2019 & 2032
- Table 8: Global MEMS for the Mobile Devices Industry Volume K Unit Forecast, by Country 2019 & 2032
- Table 9: United States MEMS for the Mobile Devices Industry Revenue (Million) Forecast, by Application 2019 & 2032
- Table 10: United States MEMS for the Mobile Devices Industry Volume (K Unit) Forecast, by Application 2019 & 2032
- Table 11: Canada MEMS for the Mobile Devices Industry Revenue (Million) Forecast, by Application 2019 & 2032
- Table 12: Canada MEMS for the Mobile Devices Industry Volume (K Unit) Forecast, by Application 2019 & 2032
- Table 13: Mexico MEMS for the Mobile Devices Industry Revenue (Million) Forecast, by Application 2019 & 2032
- Table 14: Mexico MEMS for the Mobile Devices Industry Volume (K Unit) Forecast, by Application 2019 & 2032
- Table 15: Global MEMS for the Mobile Devices Industry Revenue Million Forecast, by Country 2019 & 2032
- Table 16: Global MEMS for the Mobile Devices Industry Volume K Unit Forecast, by Country 2019 & 2032
- Table 17: Germany MEMS for the Mobile Devices Industry Revenue (Million) Forecast, by Application 2019 & 2032
- Table 18: Germany MEMS for the Mobile Devices Industry Volume (K Unit) Forecast, by Application 2019 & 2032
- Table 19: United Kingdom MEMS for the Mobile Devices Industry Revenue (Million) Forecast, by Application 2019 & 2032
- Table 20: United Kingdom MEMS for the Mobile Devices Industry Volume (K Unit) Forecast, by Application 2019 & 2032
- Table 21: France MEMS for the Mobile Devices Industry Revenue (Million) Forecast, by Application 2019 & 2032
- Table 22: France MEMS for the Mobile Devices Industry Volume (K Unit) Forecast, by Application 2019 & 2032
- Table 23: Spain MEMS for the Mobile Devices Industry Revenue (Million) Forecast, by Application 2019 & 2032
- Table 24: Spain MEMS for the Mobile Devices Industry Volume (K Unit) Forecast, by Application 2019 & 2032
- Table 25: Italy MEMS for the Mobile Devices Industry Revenue (Million) Forecast, by Application 2019 & 2032
- Table 26: Italy MEMS for the Mobile Devices Industry Volume (K Unit) Forecast, by Application 2019 & 2032
- Table 27: Spain MEMS for the Mobile Devices Industry Revenue (Million) Forecast, by Application 2019 & 2032
- Table 28: Spain MEMS for the Mobile Devices Industry Volume (K Unit) Forecast, by Application 2019 & 2032
- Table 29: Belgium MEMS for the Mobile Devices Industry Revenue (Million) Forecast, by Application 2019 & 2032
- Table 30: Belgium MEMS for the Mobile Devices Industry Volume (K Unit) Forecast, by Application 2019 & 2032
- Table 31: Netherland MEMS for the Mobile Devices Industry Revenue (Million) Forecast, by Application 2019 & 2032
- Table 32: Netherland MEMS for the Mobile Devices Industry Volume (K Unit) Forecast, by Application 2019 & 2032
- Table 33: Nordics MEMS for the Mobile Devices Industry Revenue (Million) Forecast, by Application 2019 & 2032
- Table 34: Nordics MEMS for the Mobile Devices Industry Volume (K Unit) Forecast, by Application 2019 & 2032
- Table 35: Rest of Europe MEMS for the Mobile Devices Industry Revenue (Million) Forecast, by Application 2019 & 2032
- Table 36: Rest of Europe MEMS for the Mobile Devices Industry Volume (K Unit) Forecast, by Application 2019 & 2032
- Table 37: Global MEMS for the Mobile Devices Industry Revenue Million Forecast, by Country 2019 & 2032
- Table 38: Global MEMS for the Mobile Devices Industry Volume K Unit Forecast, by Country 2019 & 2032
- Table 39: China MEMS for the Mobile Devices Industry Revenue (Million) Forecast, by Application 2019 & 2032
- Table 40: China MEMS for the Mobile Devices Industry Volume (K Unit) Forecast, by Application 2019 & 2032
- Table 41: Japan MEMS for the Mobile Devices Industry Revenue (Million) Forecast, by Application 2019 & 2032
- Table 42: Japan MEMS for the Mobile Devices Industry Volume (K Unit) Forecast, by Application 2019 & 2032
- Table 43: India MEMS for the Mobile Devices Industry Revenue (Million) Forecast, by Application 2019 & 2032
- Table 44: India MEMS for the Mobile Devices Industry Volume (K Unit) Forecast, by Application 2019 & 2032
- Table 45: South Korea MEMS for the Mobile Devices Industry Revenue (Million) Forecast, by Application 2019 & 2032
- Table 46: South Korea MEMS for the Mobile Devices Industry Volume (K Unit) Forecast, by Application 2019 & 2032
- Table 47: Southeast Asia MEMS for the Mobile Devices Industry Revenue (Million) Forecast, by Application 2019 & 2032
- Table 48: Southeast Asia MEMS for the Mobile Devices Industry Volume (K Unit) Forecast, by Application 2019 & 2032
- Table 49: Australia MEMS for the Mobile Devices Industry Revenue (Million) Forecast, by Application 2019 & 2032
- Table 50: Australia MEMS for the Mobile Devices Industry Volume (K Unit) Forecast, by Application 2019 & 2032
- Table 51: Indonesia MEMS for the Mobile Devices Industry Revenue (Million) Forecast, by Application 2019 & 2032
- Table 52: Indonesia MEMS for the Mobile Devices Industry Volume (K Unit) Forecast, by Application 2019 & 2032
- Table 53: Phillipes MEMS for the Mobile Devices Industry Revenue (Million) Forecast, by Application 2019 & 2032
- Table 54: Phillipes MEMS for the Mobile Devices Industry Volume (K Unit) Forecast, by Application 2019 & 2032
- Table 55: Singapore MEMS for the Mobile Devices Industry Revenue (Million) Forecast, by Application 2019 & 2032
- Table 56: Singapore MEMS for the Mobile Devices Industry Volume (K Unit) Forecast, by Application 2019 & 2032
- Table 57: Thailandc MEMS for the Mobile Devices Industry Revenue (Million) Forecast, by Application 2019 & 2032
- Table 58: Thailandc MEMS for the Mobile Devices Industry Volume (K Unit) Forecast, by Application 2019 & 2032
- Table 59: Rest of Asia Pacific MEMS for the Mobile Devices Industry Revenue (Million) Forecast, by Application 2019 & 2032
- Table 60: Rest of Asia Pacific MEMS for the Mobile Devices Industry Volume (K Unit) Forecast, by Application 2019 & 2032
- Table 61: Global MEMS for the Mobile Devices Industry Revenue Million Forecast, by Country 2019 & 2032
- Table 62: Global MEMS for the Mobile Devices Industry Volume K Unit Forecast, by Country 2019 & 2032
- Table 63: Brazil MEMS for the Mobile Devices Industry Revenue (Million) Forecast, by Application 2019 & 2032
- Table 64: Brazil MEMS for the Mobile Devices Industry Volume (K Unit) Forecast, by Application 2019 & 2032
- Table 65: Argentina MEMS for the Mobile Devices Industry Revenue (Million) Forecast, by Application 2019 & 2032
- Table 66: Argentina MEMS for the Mobile Devices Industry Volume (K Unit) Forecast, by Application 2019 & 2032
- Table 67: Peru MEMS for the Mobile Devices Industry Revenue (Million) Forecast, by Application 2019 & 2032
- Table 68: Peru MEMS for the Mobile Devices Industry Volume (K Unit) Forecast, by Application 2019 & 2032
- Table 69: Chile MEMS for the Mobile Devices Industry Revenue (Million) Forecast, by Application 2019 & 2032
- Table 70: Chile MEMS for the Mobile Devices Industry Volume (K Unit) Forecast, by Application 2019 & 2032
- Table 71: Colombia MEMS for the Mobile Devices Industry Revenue (Million) Forecast, by Application 2019 & 2032
- Table 72: Colombia MEMS for the Mobile Devices Industry Volume (K Unit) Forecast, by Application 2019 & 2032
- Table 73: Ecuador MEMS for the Mobile Devices Industry Revenue (Million) Forecast, by Application 2019 & 2032
- Table 74: Ecuador MEMS for the Mobile Devices Industry Volume (K Unit) Forecast, by Application 2019 & 2032
- Table 75: Venezuela MEMS for the Mobile Devices Industry Revenue (Million) Forecast, by Application 2019 & 2032
- Table 76: Venezuela MEMS for the Mobile Devices Industry Volume (K Unit) Forecast, by Application 2019 & 2032
- Table 77: Rest of South America MEMS for the Mobile Devices Industry Revenue (Million) Forecast, by Application 2019 & 2032
- Table 78: Rest of South America MEMS for the Mobile Devices Industry Volume (K Unit) Forecast, by Application 2019 & 2032
- Table 79: Global MEMS for the Mobile Devices Industry Revenue Million Forecast, by Country 2019 & 2032
- Table 80: Global MEMS for the Mobile Devices Industry Volume K Unit Forecast, by Country 2019 & 2032
- Table 81: United Arab Emirates MEMS for the Mobile Devices Industry Revenue (Million) Forecast, by Application 2019 & 2032
- Table 82: United Arab Emirates MEMS for the Mobile Devices Industry Volume (K Unit) Forecast, by Application 2019 & 2032
- Table 83: Saudi Arabia MEMS for the Mobile Devices Industry Revenue (Million) Forecast, by Application 2019 & 2032
- Table 84: Saudi Arabia MEMS for the Mobile Devices Industry Volume (K Unit) Forecast, by Application 2019 & 2032
- Table 85: South Africa MEMS for the Mobile Devices Industry Revenue (Million) Forecast, by Application 2019 & 2032
- Table 86: South Africa MEMS for the Mobile Devices Industry Volume (K Unit) Forecast, by Application 2019 & 2032
- Table 87: Rest of Middle East and Africa MEMS for the Mobile Devices Industry Revenue (Million) Forecast, by Application 2019 & 2032
- Table 88: Rest of Middle East and Africa MEMS for the Mobile Devices Industry Volume (K Unit) Forecast, by Application 2019 & 2032
- Table 89: Global MEMS for the Mobile Devices Industry Revenue Million Forecast, by Type of Sensor 2019 & 2032
- Table 90: Global MEMS for the Mobile Devices Industry Volume K Unit Forecast, by Type of Sensor 2019 & 2032
- Table 91: Global MEMS for the Mobile Devices Industry Revenue Million Forecast, by Country 2019 & 2032
- Table 92: Global MEMS for the Mobile Devices Industry Volume K Unit Forecast, by Country 2019 & 2032
- Table 93: Global MEMS for the Mobile Devices Industry Revenue Million Forecast, by Type of Sensor 2019 & 2032
- Table 94: Global MEMS for the Mobile Devices Industry Volume K Unit Forecast, by Type of Sensor 2019 & 2032
- Table 95: Global MEMS for the Mobile Devices Industry Revenue Million Forecast, by Country 2019 & 2032
- Table 96: Global MEMS for the Mobile Devices Industry Volume K Unit Forecast, by Country 2019 & 2032
- Table 97: Global MEMS for the Mobile Devices Industry Revenue Million Forecast, by Type of Sensor 2019 & 2032
- Table 98: Global MEMS for the Mobile Devices Industry Volume K Unit Forecast, by Type of Sensor 2019 & 2032
- Table 99: Global MEMS for the Mobile Devices Industry Revenue Million Forecast, by Country 2019 & 2032
- Table 100: Global MEMS for the Mobile Devices Industry Volume K Unit Forecast, by Country 2019 & 2032
- Table 101: Global MEMS for the Mobile Devices Industry Revenue Million Forecast, by Type of Sensor 2019 & 2032
- Table 102: Global MEMS for the Mobile Devices Industry Volume K Unit Forecast, by Type of Sensor 2019 & 2032
- Table 103: Global MEMS for the Mobile Devices Industry Revenue Million Forecast, by Country 2019 & 2032
- Table 104: Global MEMS for the Mobile Devices Industry Volume K Unit Forecast, by Country 2019 & 2032
- Table 105: Global MEMS for the Mobile Devices Industry Revenue Million Forecast, by Type of Sensor 2019 & 2032
- Table 106: Global MEMS for the Mobile Devices Industry Volume K Unit Forecast, by Type of Sensor 2019 & 2032
- Table 107: Global MEMS for the Mobile Devices Industry Revenue Million Forecast, by Country 2019 & 2032
- Table 108: Global MEMS for the Mobile Devices Industry Volume K Unit Forecast, by Country 2019 & 2032
Frequently Asked Questions
1. What is the projected Compound Annual Growth Rate (CAGR) of the MEMS for the Mobile Devices Industry?
The projected CAGR is approximately 8.80%.
2. Which companies are prominent players in the MEMS for the Mobile Devices Industry?
Key companies in the market include Knowles Corporation, AAC Technologies, InvenSense Inc (TDK), MEMSIC Inc, Goertek Inc, Bosch Sensortec GmbH, Murata Manufacturing, STMicroelectronics NV, Analog Devices Inc, BSE Co Ltd.
3. What are the main segments of the MEMS for the Mobile Devices Industry?
The market segments include Type of Sensor.
4. Can you provide details about the market size?
The market size is estimated to be USD 9.38 Million as of 2022.
5. What are some drivers contributing to market growth?
Increasing Acceptance of Miniaturization Trend; Increasing Demand for High-Performance Devices.
6. What are the notable trends driving market growth?
Increasing Acceptance of Miniaturization Trend to Drive the Market.
7. Are there any restraints impacting market growth?
Highly Complex Manufacturing Process and Demanding Cycle Time; Lack of Standardized Fabrication Process.
8. Can you provide examples of recent developments in the market?
December 2022: Knowles introduced new balanced armatures and MEMS microphones for over-the-counter hearing aids. The new product released provides performance and design flexibility to help speed up the production of hearing health products. Three full-range balanced armature receivers and two updated MEMS microphones will meet the stringent design and acoustic performance requirements of hearing aids.
9. What pricing options are available for accessing the report?
Pricing options include single-user, multi-user, and enterprise licenses priced at USD 4750, USD 5250, and USD 8750 respectively.
10. Is the market size provided in terms of value or volume?
The market size is provided in terms of value, measured in Million and volume, measured in K Unit.
11. Are there any specific market keywords associated with the report?
Yes, the market keyword associated with the report is "MEMS for the Mobile Devices Industry," which aids in identifying and referencing the specific market segment covered.
12. How do I determine which pricing option suits my needs best?
The pricing options vary based on user requirements and access needs. Individual users may opt for single-user licenses, while businesses requiring broader access may choose multi-user or enterprise licenses for cost-effective access to the report.
13. Are there any additional resources or data provided in the MEMS for the Mobile Devices Industry report?
While the report offers comprehensive insights, it's advisable to review the specific contents or supplementary materials provided to ascertain if additional resources or data are available.
14. How can I stay updated on further developments or reports in the MEMS for the Mobile Devices Industry?
To stay informed about further developments, trends, and reports in the MEMS for the Mobile Devices Industry, consider subscribing to industry newsletters, following relevant companies and organizations, or regularly checking reputable industry news sources and publications.
Methodology
Step 1 - Identification of Relevant Samples Size from Population Database


Step 2 - Approaches for Defining Global Market Size (Value, Volume* & Price*)

Note*: In applicable scenarios
Step 3 - Data Sources
Primary Research
- Web Analytics
- Survey Reports
- Research Institute
- Latest Research Reports
- Opinion Leaders
Secondary Research
- Annual Reports
- White Paper
- Latest Press Release
- Industry Association
- Paid Database
- Investor Presentations

Step 4 - Data Triangulation
Involves using different sources of information in order to increase the validity of a study
These sources are likely to be stakeholders in a program - participants, other researchers, program staff, other community members, and so on.
Then we put all data in single framework & apply various statistical tools to find out the dynamic on the market.
During the analysis stage, feedback from the stakeholder groups would be compared to determine areas of agreement as well as areas of divergence


