
Key Insights
The Middle East and Africa (MEA) image sensor market is experiencing robust growth, driven by the increasing adoption of advanced imaging technologies across various sectors. The market's Compound Annual Growth Rate (CAGR) of 6.40% from 2019 to 2024 indicates a significant upward trajectory, projected to continue through 2033. Key drivers include the expanding consumer electronics market, particularly smartphones and automotive applications incorporating advanced driver-assistance systems (ADAS). Furthermore, growth in the healthcare sector, fueled by the rising demand for medical imaging equipment and improved diagnostic capabilities, significantly contributes to market expansion. The increasing adoption of security and surveillance systems across both public and private sectors also fuels demand for high-resolution image sensors. While the market is fragmented across various types (wired and wireless), technologies (CMOS and CCD), and specifications, the CMOS technology segment dominates due to its cost-effectiveness and superior performance. Regional analysis reveals strong growth in Saudi Arabia and the UAE, driven by substantial investments in infrastructure and technological advancement. South Africa also contributes significantly to the market, although at a comparatively slower rate. Challenges include the high initial investment costs associated with advanced imaging technologies, potentially hindering adoption in some sectors. However, ongoing technological advancements, coupled with decreasing production costs, are mitigating these restraints, paving the way for sustained market expansion in the coming years.
The MEA image sensor market is segmented by country (Saudi Arabia, UAE, South Africa, and others), type (wired and wireless), technology (CMOS, CCD, and others), specification type (processing type, spectrum type, X-ray light array type), and application (consumer electronics, healthcare, industrial, security and surveillance, automotive & transportation, aerospace & defense, and others). Major players like Sony, Samsung, and Canon are driving innovation and market competition. The forecast period (2025-2033) anticipates continued growth, propelled by technological advancements like higher resolution sensors, improved image processing capabilities, and the integration of artificial intelligence (AI) in imaging applications. The market's size in 2025 is estimated to be substantial and is expected to show considerable growth, exceeding the initial estimates based on the observed CAGR and market trends. Growth in emerging economies within the MEA region presents a significant opportunity for market expansion.
MEA Image Sensors Market: A Comprehensive Market Report (2019-2033)
This in-depth report provides a comprehensive analysis of the Middle East and Africa (MEA) image sensors market, encompassing market dynamics, growth trends, regional segmentation, product landscape, key players, and future outlook. The study period covers 2019-2033, with 2025 as the base and estimated year. This report is crucial for industry professionals, investors, and strategists seeking to understand and capitalize on opportunities within this rapidly evolving sector. The MEA image sensor market, a child market within the broader global image sensor market, is experiencing significant growth driven by technological advancements and increasing demand across diverse applications. This report projects a market value of xx Million units by 2033.
MEA Image Sensors Market Dynamics & Structure
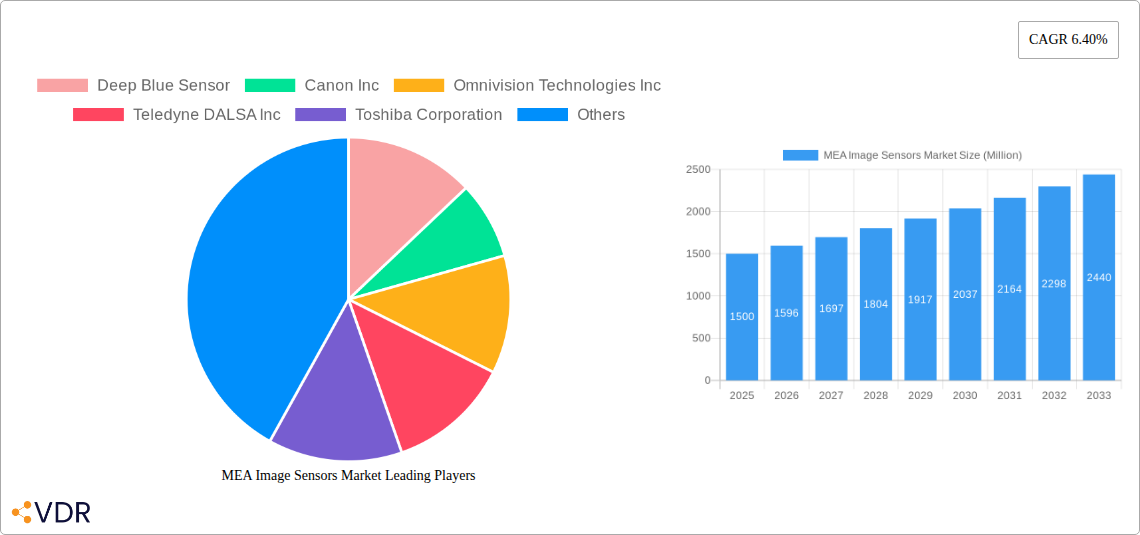
The MEA image sensors market is characterized by a moderately concentrated landscape, with key players such as Deep Blue Sensor, Canon Inc, Omnivision Technologies Inc, Teledyne DALSA Inc, Toshiba Corporation, SK Hynix Inc, Samsung Electronics Co Ltd, STMicroelectronics N V, ON Semiconductor Corporation, and Sony Corporation vying for market share. Technological innovation, particularly in CMOS technology, is a significant driver, while regulatory frameworks related to data privacy and security influence market dynamics. The market witnesses considerable competitive pressure from product substitutes, with emerging technologies constantly challenging established players.
- Market Concentration: Moderately concentrated, with the top 5 players holding approximately xx% market share in 2025.
- Technological Innovation: CMOS technology dominates, driving miniaturization and improved performance. CCD technology still holds a niche segment.
- Regulatory Landscape: Data privacy regulations and cybersecurity standards are shaping market practices.
- Competitive Substitutes: Advancements in alternative sensing technologies pose competitive pressure.
- M&A Activity: The number of M&A deals in the MEA image sensor market averaged xx deals annually during 2019-2024.
- End-User Demographics: The market is driven by a diversified base including consumers, industries, and government sectors.
MEA Image Sensors Market Growth Trends & Insights
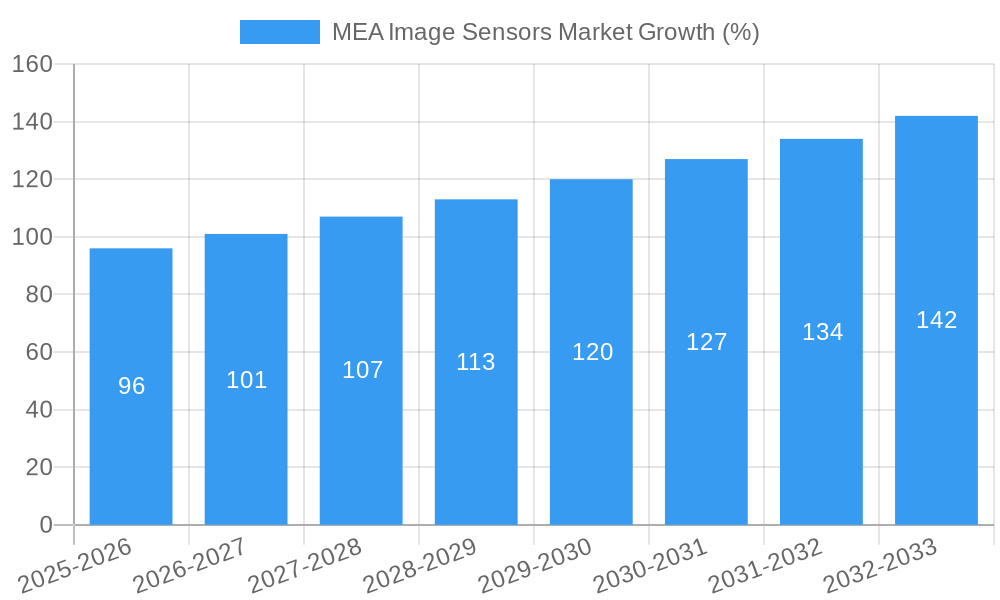
The MEA image sensors market exhibits robust growth, propelled by factors such as increasing smartphone penetration, rising adoption of smart home devices, expansion of industrial automation, and growth of the automotive sector. Technological advancements like higher resolution, improved sensitivity, and reduced power consumption are further fueling market expansion. Consumer behavior shifts toward advanced imaging capabilities in electronic devices have contributed significantly.
The market witnessed a CAGR of xx% during the historical period (2019-2024) and is projected to maintain a CAGR of xx% during the forecast period (2025-2033). Market penetration of image sensors in various applications is increasing steadily, particularly in consumer electronics and automotive sectors. Technological disruptions, such as the emergence of 3D imaging sensors and advancements in AI-powered image processing, are reshaping market dynamics. Market size is expected to reach xx Million units by 2033.
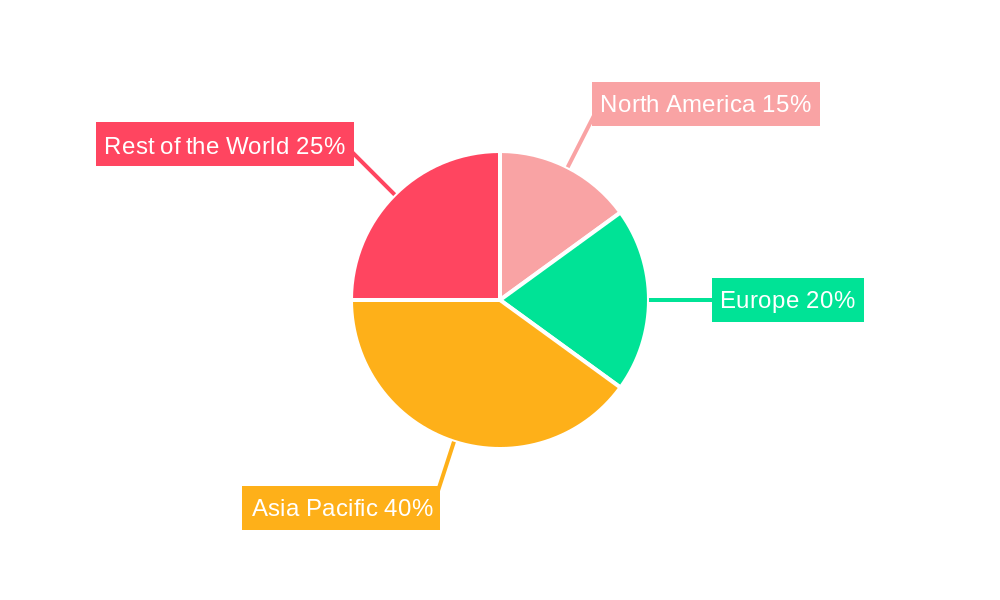
Dominant Regions, Countries, or Segments in MEA Image Sensors Market
The United Arab Emirates (UAE) and Saudi Arabia represent the largest segments within the MEA region, driven by robust economic growth, expanding digital infrastructure, and government initiatives promoting technological advancements. The consumer electronics sector, particularly smartphones and surveillance systems, is the dominant application segment. South Africa shows promising growth potential, although at a comparatively slower rate. The CMOS technology segment holds the largest market share.
- By Country: UAE and Saudi Arabia are dominant due to high technological adoption and infrastructure investment.
- By Type: Wired image sensors currently hold a larger market share, but wireless sensors are exhibiting faster growth.
- By Technology: CMOS technology dominates due to its cost-effectiveness and performance.
- By Specification Type: High-resolution sensors and advanced processing types are gaining traction.
- By Application: Consumer electronics holds the largest share, followed by Security and Surveillance, and Automotive & Transportation.
- Key Drivers: Economic growth, government investments in infrastructure, and increasing digitalization are major growth drivers in the UAE and Saudi Arabia.
MEA Image Sensors Market Product Landscape
The MEA image sensor market showcases a wide range of products, from low-resolution sensors for basic applications to high-resolution sensors with advanced features like global shutter and high dynamic range (HDR). CMOS image sensors dominate the market due to their cost-effectiveness, energy efficiency, and superior performance in low-light conditions. Recent innovations include the integration of AI capabilities for advanced image processing, leading to improvements in image quality, and object recognition.
Key Drivers, Barriers & Challenges in MEA Image Sensors Market
Key Drivers:
- Increasing demand for advanced imaging capabilities in consumer electronics.
- Growth of the automotive sector driving demand for advanced driver-assistance systems (ADAS).
- Government initiatives promoting digitalization and technological advancements.
- Expanding security and surveillance infrastructure.
Key Challenges:
- High initial investment costs associated with adopting advanced image sensor technology can hinder adoption in some sectors.
- Supply chain disruptions impacting availability and cost of raw materials.
- Fluctuations in currency exchange rates affecting import costs. This impact is estimated at a xx% fluctuation in overall market value in 2024.
- Intense competition from established and emerging players.
Emerging Opportunities in MEA Image Sensors Market
Emerging opportunities lie in expanding the use of image sensors in healthcare (medical imaging), industrial automation (machine vision), and smart agriculture. The adoption of advanced imaging technologies in autonomous vehicles and drones presents substantial growth potential. Moreover, the increasing demand for high-resolution and low-light imaging capabilities offers scope for specialized sensor development.
Growth Accelerators in the MEA Image Sensors Market Industry
Technological advancements, strategic partnerships between sensor manufacturers and system integrators, and expanding market penetration in untapped segments (such as smart agriculture and healthcare) will significantly accelerate growth. Government initiatives supporting innovation and investment in technology will also be crucial drivers.
Key Players Shaping the MEA Image Sensors Market Market
- Deep Blue Sensor
- Canon Inc
- Omnivision Technologies Inc
- Teledyne DALSA Inc
- Toshiba Corporation
- SK Hynix Inc
- Samsung Electronics Co Ltd
- STMicroelectronics N V
- ON Semiconductor Corporation
- Sony Corporation
Notable Milestones in MEA Image Sensors Market Sector
- June 2020: Canon Inc. developed the world's first 1-megapixel single-photon avalanche diode (SPAD) image sensor.
- September 2021: Sony Semiconductor Solutions Corporation commercialized the IMX487, an 8.13-megapixel CMOS image sensor for industrial equipment with UV compatibility.
In-Depth MEA Image Sensors Market Market Outlook
The MEA image sensors market is poised for sustained growth, driven by technological innovations and increasing demand across diverse applications. The focus on higher resolution, improved sensitivity, and AI integration will continue to shape the market. Strategic partnerships and expansion into untapped sectors present significant opportunities for players to capture market share and drive long-term growth. The market's future potential is substantial, particularly in the rapidly developing technological landscape of the MEA region.
MEA Image Sensors Market Segmentation
-
1. Type
- 1.1. Wired
- 1.2. Wireless
-
2. Technology
- 2.1. CMOS
- 2.2. CCD
- 2.3. Others
-
3. Specification Type
- 3.1. Processing Type
-
3.2. Spectrum Type
- 3.2.1. Infrared Invisible Spectrum
- 3.2.2. X-Ray Light
- 3.3. Array Type
-
4. Application
- 4.1. Consumer Electronics
- 4.2. Healthcare
- 4.3. Industrial
- 4.4. Security and Surveillance
- 4.5. Automotive & Transportation
- 4.6. Aerospace & Defense
- 4.7. Others
MEA Image Sensors Market Segmentation By Geography
-
1. North America
- 1.1. United States
- 1.2. Canada
- 1.3. Mexico
-
2. South America
- 2.1. Brazil
- 2.2. Argentina
- 2.3. Rest of South America
-
3. Europe
- 3.1. United Kingdom
- 3.2. Germany
- 3.3. France
- 3.4. Italy
- 3.5. Spain
- 3.6. Russia
- 3.7. Benelux
- 3.8. Nordics
- 3.9. Rest of Europe
-
4. Middle East & Africa
- 4.1. Turkey
- 4.2. Israel
- 4.3. GCC
- 4.4. North Africa
- 4.5. South Africa
- 4.6. Rest of Middle East & Africa
-
5. Asia Pacific
- 5.1. China
- 5.2. India
- 5.3. Japan
- 5.4. South Korea
- 5.5. ASEAN
- 5.6. Oceania
- 5.7. Rest of Asia Pacific
MEA Image Sensors Market REPORT HIGHLIGHTS
| Aspects | Details |
|---|---|
| Study Period | 2019-2033 |
| Base Year | 2024 |
| Estimated Year | 2025 |
| Forecast Period | 2025-2033 |
| Historical Period | 2019-2024 |
| Growth Rate | CAGR of 6.40% from 2019-2033 |
| Segmentation |
|
Table of Contents
- 1. Introduction
- 1.1. Research Scope
- 1.2. Market Segmentation
- 1.3. Research Methodology
- 1.4. Definitions and Assumptions
- 2. Executive Summary
- 2.1. Introduction
- 3. Market Dynamics
- 3.1. Introduction
- 3.2. Market Drivers
- 3.2.1. Increased Demand in Automotive Applications; Demand for Gesture Recognition/Control in Vertical Applications; Low-Cost Availability of CMOS Image Sensors Deployed in Electronic Devices
- 3.3. Market Restrains
- 3.3.1. High Manufacturing Costs and Increased Market Competition; Storage Space and Battery Consumption issues
- 3.4. Market Trends
- 3.4.1. Consumer Electronics Segment to Hold Significant Market Share
- 4. Market Factor Analysis
- 4.1. Porters Five Forces
- 4.2. Supply/Value Chain
- 4.3. PESTEL analysis
- 4.4. Market Entropy
- 4.5. Patent/Trademark Analysis
- 5. Global MEA Image Sensors Market Analysis, Insights and Forecast, 2019-2031
- 5.1. Market Analysis, Insights and Forecast - by Type
- 5.1.1. Wired
- 5.1.2. Wireless
- 5.2. Market Analysis, Insights and Forecast - by Technology
- 5.2.1. CMOS
- 5.2.2. CCD
- 5.2.3. Others
- 5.3. Market Analysis, Insights and Forecast - by Specification Type
- 5.3.1. Processing Type
- 5.3.2. Spectrum Type
- 5.3.2.1. Infrared Invisible Spectrum
- 5.3.2.2. X-Ray Light
- 5.3.3. Array Type
- 5.4. Market Analysis, Insights and Forecast - by Application
- 5.4.1. Consumer Electronics
- 5.4.2. Healthcare
- 5.4.3. Industrial
- 5.4.4. Security and Surveillance
- 5.4.5. Automotive & Transportation
- 5.4.6. Aerospace & Defense
- 5.4.7. Others
- 5.5. Market Analysis, Insights and Forecast - by Region
- 5.5.1. North America
- 5.5.2. South America
- 5.5.3. Europe
- 5.5.4. Middle East & Africa
- 5.5.5. Asia Pacific
- 5.1. Market Analysis, Insights and Forecast - by Type
- 6. North America MEA Image Sensors Market Analysis, Insights and Forecast, 2019-2031
- 6.1. Market Analysis, Insights and Forecast - by Type
- 6.1.1. Wired
- 6.1.2. Wireless
- 6.2. Market Analysis, Insights and Forecast - by Technology
- 6.2.1. CMOS
- 6.2.2. CCD
- 6.2.3. Others
- 6.3. Market Analysis, Insights and Forecast - by Specification Type
- 6.3.1. Processing Type
- 6.3.2. Spectrum Type
- 6.3.2.1. Infrared Invisible Spectrum
- 6.3.2.2. X-Ray Light
- 6.3.3. Array Type
- 6.4. Market Analysis, Insights and Forecast - by Application
- 6.4.1. Consumer Electronics
- 6.4.2. Healthcare
- 6.4.3. Industrial
- 6.4.4. Security and Surveillance
- 6.4.5. Automotive & Transportation
- 6.4.6. Aerospace & Defense
- 6.4.7. Others
- 6.1. Market Analysis, Insights and Forecast - by Type
- 7. South America MEA Image Sensors Market Analysis, Insights and Forecast, 2019-2031
- 7.1. Market Analysis, Insights and Forecast - by Type
- 7.1.1. Wired
- 7.1.2. Wireless
- 7.2. Market Analysis, Insights and Forecast - by Technology
- 7.2.1. CMOS
- 7.2.2. CCD
- 7.2.3. Others
- 7.3. Market Analysis, Insights and Forecast - by Specification Type
- 7.3.1. Processing Type
- 7.3.2. Spectrum Type
- 7.3.2.1. Infrared Invisible Spectrum
- 7.3.2.2. X-Ray Light
- 7.3.3. Array Type
- 7.4. Market Analysis, Insights and Forecast - by Application
- 7.4.1. Consumer Electronics
- 7.4.2. Healthcare
- 7.4.3. Industrial
- 7.4.4. Security and Surveillance
- 7.4.5. Automotive & Transportation
- 7.4.6. Aerospace & Defense
- 7.4.7. Others
- 7.1. Market Analysis, Insights and Forecast - by Type
- 8. Europe MEA Image Sensors Market Analysis, Insights and Forecast, 2019-2031
- 8.1. Market Analysis, Insights and Forecast - by Type
- 8.1.1. Wired
- 8.1.2. Wireless
- 8.2. Market Analysis, Insights and Forecast - by Technology
- 8.2.1. CMOS
- 8.2.2. CCD
- 8.2.3. Others
- 8.3. Market Analysis, Insights and Forecast - by Specification Type
- 8.3.1. Processing Type
- 8.3.2. Spectrum Type
- 8.3.2.1. Infrared Invisible Spectrum
- 8.3.2.2. X-Ray Light
- 8.3.3. Array Type
- 8.4. Market Analysis, Insights and Forecast - by Application
- 8.4.1. Consumer Electronics
- 8.4.2. Healthcare
- 8.4.3. Industrial
- 8.4.4. Security and Surveillance
- 8.4.5. Automotive & Transportation
- 8.4.6. Aerospace & Defense
- 8.4.7. Others
- 8.1. Market Analysis, Insights and Forecast - by Type
- 9. Middle East & Africa MEA Image Sensors Market Analysis, Insights and Forecast, 2019-2031
- 9.1. Market Analysis, Insights and Forecast - by Type
- 9.1.1. Wired
- 9.1.2. Wireless
- 9.2. Market Analysis, Insights and Forecast - by Technology
- 9.2.1. CMOS
- 9.2.2. CCD
- 9.2.3. Others
- 9.3. Market Analysis, Insights and Forecast - by Specification Type
- 9.3.1. Processing Type
- 9.3.2. Spectrum Type
- 9.3.2.1. Infrared Invisible Spectrum
- 9.3.2.2. X-Ray Light
- 9.3.3. Array Type
- 9.4. Market Analysis, Insights and Forecast - by Application
- 9.4.1. Consumer Electronics
- 9.4.2. Healthcare
- 9.4.3. Industrial
- 9.4.4. Security and Surveillance
- 9.4.5. Automotive & Transportation
- 9.4.6. Aerospace & Defense
- 9.4.7. Others
- 9.1. Market Analysis, Insights and Forecast - by Type
- 10. Asia Pacific MEA Image Sensors Market Analysis, Insights and Forecast, 2019-2031
- 10.1. Market Analysis, Insights and Forecast - by Type
- 10.1.1. Wired
- 10.1.2. Wireless
- 10.2. Market Analysis, Insights and Forecast - by Technology
- 10.2.1. CMOS
- 10.2.2. CCD
- 10.2.3. Others
- 10.3. Market Analysis, Insights and Forecast - by Specification Type
- 10.3.1. Processing Type
- 10.3.2. Spectrum Type
- 10.3.2.1. Infrared Invisible Spectrum
- 10.3.2.2. X-Ray Light
- 10.3.3. Array Type
- 10.4. Market Analysis, Insights and Forecast - by Application
- 10.4.1. Consumer Electronics
- 10.4.2. Healthcare
- 10.4.3. Industrial
- 10.4.4. Security and Surveillance
- 10.4.5. Automotive & Transportation
- 10.4.6. Aerospace & Defense
- 10.4.7. Others
- 10.1. Market Analysis, Insights and Forecast - by Type
- 11. North America MEA Image Sensors Market Analysis, Insights and Forecast, 2019-2031
- 11.1. Market Analysis, Insights and Forecast - By Country/Sub-region
- 11.1.1.
- 12. Europe MEA Image Sensors Market Analysis, Insights and Forecast, 2019-2031
- 12.1. Market Analysis, Insights and Forecast - By Country/Sub-region
- 12.1.1.
- 13. Asia Pacific MEA Image Sensors Market Analysis, Insights and Forecast, 2019-2031
- 13.1. Market Analysis, Insights and Forecast - By Country/Sub-region
- 13.1.1.
- 14. Rest of the World MEA Image Sensors Market Analysis, Insights and Forecast, 2019-2031
- 14.1. Market Analysis, Insights and Forecast - By Country/Sub-region
- 14.1.1.
- 15. Competitive Analysis
- 15.1. Global Market Share Analysis 2024
- 15.2. Company Profiles
- 15.2.1 Deep Blue Sensor
- 15.2.1.1. Overview
- 15.2.1.2. Products
- 15.2.1.3. SWOT Analysis
- 15.2.1.4. Recent Developments
- 15.2.1.5. Financials (Based on Availability)
- 15.2.2 Canon Inc
- 15.2.2.1. Overview
- 15.2.2.2. Products
- 15.2.2.3. SWOT Analysis
- 15.2.2.4. Recent Developments
- 15.2.2.5. Financials (Based on Availability)
- 15.2.3 Omnivision Technologies Inc
- 15.2.3.1. Overview
- 15.2.3.2. Products
- 15.2.3.3. SWOT Analysis
- 15.2.3.4. Recent Developments
- 15.2.3.5. Financials (Based on Availability)
- 15.2.4 Teledyne DALSA Inc
- 15.2.4.1. Overview
- 15.2.4.2. Products
- 15.2.4.3. SWOT Analysis
- 15.2.4.4. Recent Developments
- 15.2.4.5. Financials (Based on Availability)
- 15.2.5 Toshiba Corporation
- 15.2.5.1. Overview
- 15.2.5.2. Products
- 15.2.5.3. SWOT Analysis
- 15.2.5.4. Recent Developments
- 15.2.5.5. Financials (Based on Availability)
- 15.2.6 SK Hynix Inc *List Not Exhaustive
- 15.2.6.1. Overview
- 15.2.6.2. Products
- 15.2.6.3. SWOT Analysis
- 15.2.6.4. Recent Developments
- 15.2.6.5. Financials (Based on Availability)
- 15.2.7 Samsung Electronics Co Ltd
- 15.2.7.1. Overview
- 15.2.7.2. Products
- 15.2.7.3. SWOT Analysis
- 15.2.7.4. Recent Developments
- 15.2.7.5. Financials (Based on Availability)
- 15.2.8 STMicroelectronics N V
- 15.2.8.1. Overview
- 15.2.8.2. Products
- 15.2.8.3. SWOT Analysis
- 15.2.8.4. Recent Developments
- 15.2.8.5. Financials (Based on Availability)
- 15.2.9 ON Semiconductor Corporation
- 15.2.9.1. Overview
- 15.2.9.2. Products
- 15.2.9.3. SWOT Analysis
- 15.2.9.4. Recent Developments
- 15.2.9.5. Financials (Based on Availability)
- 15.2.10 Sony Corporation
- 15.2.10.1. Overview
- 15.2.10.2. Products
- 15.2.10.3. SWOT Analysis
- 15.2.10.4. Recent Developments
- 15.2.10.5. Financials (Based on Availability)
- 15.2.1 Deep Blue Sensor
List of Figures
- Figure 1: Global MEA Image Sensors Market Revenue Breakdown (Million, %) by Region 2024 & 2032
- Figure 2: North America MEA Image Sensors Market Revenue (Million), by Country 2024 & 2032
- Figure 3: North America MEA Image Sensors Market Revenue Share (%), by Country 2024 & 2032
- Figure 4: Europe MEA Image Sensors Market Revenue (Million), by Country 2024 & 2032
- Figure 5: Europe MEA Image Sensors Market Revenue Share (%), by Country 2024 & 2032
- Figure 6: Asia Pacific MEA Image Sensors Market Revenue (Million), by Country 2024 & 2032
- Figure 7: Asia Pacific MEA Image Sensors Market Revenue Share (%), by Country 2024 & 2032
- Figure 8: Rest of the World MEA Image Sensors Market Revenue (Million), by Country 2024 & 2032
- Figure 9: Rest of the World MEA Image Sensors Market Revenue Share (%), by Country 2024 & 2032
- Figure 10: North America MEA Image Sensors Market Revenue (Million), by Type 2024 & 2032
- Figure 11: North America MEA Image Sensors Market Revenue Share (%), by Type 2024 & 2032
- Figure 12: North America MEA Image Sensors Market Revenue (Million), by Technology 2024 & 2032
- Figure 13: North America MEA Image Sensors Market Revenue Share (%), by Technology 2024 & 2032
- Figure 14: North America MEA Image Sensors Market Revenue (Million), by Specification Type 2024 & 2032
- Figure 15: North America MEA Image Sensors Market Revenue Share (%), by Specification Type 2024 & 2032
- Figure 16: North America MEA Image Sensors Market Revenue (Million), by Application 2024 & 2032
- Figure 17: North America MEA Image Sensors Market Revenue Share (%), by Application 2024 & 2032
- Figure 18: North America MEA Image Sensors Market Revenue (Million), by Country 2024 & 2032
- Figure 19: North America MEA Image Sensors Market Revenue Share (%), by Country 2024 & 2032
- Figure 20: South America MEA Image Sensors Market Revenue (Million), by Type 2024 & 2032
- Figure 21: South America MEA Image Sensors Market Revenue Share (%), by Type 2024 & 2032
- Figure 22: South America MEA Image Sensors Market Revenue (Million), by Technology 2024 & 2032
- Figure 23: South America MEA Image Sensors Market Revenue Share (%), by Technology 2024 & 2032
- Figure 24: South America MEA Image Sensors Market Revenue (Million), by Specification Type 2024 & 2032
- Figure 25: South America MEA Image Sensors Market Revenue Share (%), by Specification Type 2024 & 2032
- Figure 26: South America MEA Image Sensors Market Revenue (Million), by Application 2024 & 2032
- Figure 27: South America MEA Image Sensors Market Revenue Share (%), by Application 2024 & 2032
- Figure 28: South America MEA Image Sensors Market Revenue (Million), by Country 2024 & 2032
- Figure 29: South America MEA Image Sensors Market Revenue Share (%), by Country 2024 & 2032
- Figure 30: Europe MEA Image Sensors Market Revenue (Million), by Type 2024 & 2032
- Figure 31: Europe MEA Image Sensors Market Revenue Share (%), by Type 2024 & 2032
- Figure 32: Europe MEA Image Sensors Market Revenue (Million), by Technology 2024 & 2032
- Figure 33: Europe MEA Image Sensors Market Revenue Share (%), by Technology 2024 & 2032
- Figure 34: Europe MEA Image Sensors Market Revenue (Million), by Specification Type 2024 & 2032
- Figure 35: Europe MEA Image Sensors Market Revenue Share (%), by Specification Type 2024 & 2032
- Figure 36: Europe MEA Image Sensors Market Revenue (Million), by Application 2024 & 2032
- Figure 37: Europe MEA Image Sensors Market Revenue Share (%), by Application 2024 & 2032
- Figure 38: Europe MEA Image Sensors Market Revenue (Million), by Country 2024 & 2032
- Figure 39: Europe MEA Image Sensors Market Revenue Share (%), by Country 2024 & 2032
- Figure 40: Middle East & Africa MEA Image Sensors Market Revenue (Million), by Type 2024 & 2032
- Figure 41: Middle East & Africa MEA Image Sensors Market Revenue Share (%), by Type 2024 & 2032
- Figure 42: Middle East & Africa MEA Image Sensors Market Revenue (Million), by Technology 2024 & 2032
- Figure 43: Middle East & Africa MEA Image Sensors Market Revenue Share (%), by Technology 2024 & 2032
- Figure 44: Middle East & Africa MEA Image Sensors Market Revenue (Million), by Specification Type 2024 & 2032
- Figure 45: Middle East & Africa MEA Image Sensors Market Revenue Share (%), by Specification Type 2024 & 2032
- Figure 46: Middle East & Africa MEA Image Sensors Market Revenue (Million), by Application 2024 & 2032
- Figure 47: Middle East & Africa MEA Image Sensors Market Revenue Share (%), by Application 2024 & 2032
- Figure 48: Middle East & Africa MEA Image Sensors Market Revenue (Million), by Country 2024 & 2032
- Figure 49: Middle East & Africa MEA Image Sensors Market Revenue Share (%), by Country 2024 & 2032
- Figure 50: Asia Pacific MEA Image Sensors Market Revenue (Million), by Type 2024 & 2032
- Figure 51: Asia Pacific MEA Image Sensors Market Revenue Share (%), by Type 2024 & 2032
- Figure 52: Asia Pacific MEA Image Sensors Market Revenue (Million), by Technology 2024 & 2032
- Figure 53: Asia Pacific MEA Image Sensors Market Revenue Share (%), by Technology 2024 & 2032
- Figure 54: Asia Pacific MEA Image Sensors Market Revenue (Million), by Specification Type 2024 & 2032
- Figure 55: Asia Pacific MEA Image Sensors Market Revenue Share (%), by Specification Type 2024 & 2032
- Figure 56: Asia Pacific MEA Image Sensors Market Revenue (Million), by Application 2024 & 2032
- Figure 57: Asia Pacific MEA Image Sensors Market Revenue Share (%), by Application 2024 & 2032
- Figure 58: Asia Pacific MEA Image Sensors Market Revenue (Million), by Country 2024 & 2032
- Figure 59: Asia Pacific MEA Image Sensors Market Revenue Share (%), by Country 2024 & 2032
List of Tables
- Table 1: Global MEA Image Sensors Market Revenue Million Forecast, by Region 2019 & 2032
- Table 2: Global MEA Image Sensors Market Revenue Million Forecast, by Type 2019 & 2032
- Table 3: Global MEA Image Sensors Market Revenue Million Forecast, by Technology 2019 & 2032
- Table 4: Global MEA Image Sensors Market Revenue Million Forecast, by Specification Type 2019 & 2032
- Table 5: Global MEA Image Sensors Market Revenue Million Forecast, by Application 2019 & 2032
- Table 6: Global MEA Image Sensors Market Revenue Million Forecast, by Region 2019 & 2032
- Table 7: Global MEA Image Sensors Market Revenue Million Forecast, by Country 2019 & 2032
- Table 8: MEA Image Sensors Market Revenue (Million) Forecast, by Application 2019 & 2032
- Table 9: Global MEA Image Sensors Market Revenue Million Forecast, by Country 2019 & 2032
- Table 10: MEA Image Sensors Market Revenue (Million) Forecast, by Application 2019 & 2032
- Table 11: Global MEA Image Sensors Market Revenue Million Forecast, by Country 2019 & 2032
- Table 12: MEA Image Sensors Market Revenue (Million) Forecast, by Application 2019 & 2032
- Table 13: Global MEA Image Sensors Market Revenue Million Forecast, by Country 2019 & 2032
- Table 14: MEA Image Sensors Market Revenue (Million) Forecast, by Application 2019 & 2032
- Table 15: Global MEA Image Sensors Market Revenue Million Forecast, by Type 2019 & 2032
- Table 16: Global MEA Image Sensors Market Revenue Million Forecast, by Technology 2019 & 2032
- Table 17: Global MEA Image Sensors Market Revenue Million Forecast, by Specification Type 2019 & 2032
- Table 18: Global MEA Image Sensors Market Revenue Million Forecast, by Application 2019 & 2032
- Table 19: Global MEA Image Sensors Market Revenue Million Forecast, by Country 2019 & 2032
- Table 20: United States MEA Image Sensors Market Revenue (Million) Forecast, by Application 2019 & 2032
- Table 21: Canada MEA Image Sensors Market Revenue (Million) Forecast, by Application 2019 & 2032
- Table 22: Mexico MEA Image Sensors Market Revenue (Million) Forecast, by Application 2019 & 2032
- Table 23: Global MEA Image Sensors Market Revenue Million Forecast, by Type 2019 & 2032
- Table 24: Global MEA Image Sensors Market Revenue Million Forecast, by Technology 2019 & 2032
- Table 25: Global MEA Image Sensors Market Revenue Million Forecast, by Specification Type 2019 & 2032
- Table 26: Global MEA Image Sensors Market Revenue Million Forecast, by Application 2019 & 2032
- Table 27: Global MEA Image Sensors Market Revenue Million Forecast, by Country 2019 & 2032
- Table 28: Brazil MEA Image Sensors Market Revenue (Million) Forecast, by Application 2019 & 2032
- Table 29: Argentina MEA Image Sensors Market Revenue (Million) Forecast, by Application 2019 & 2032
- Table 30: Rest of South America MEA Image Sensors Market Revenue (Million) Forecast, by Application 2019 & 2032
- Table 31: Global MEA Image Sensors Market Revenue Million Forecast, by Type 2019 & 2032
- Table 32: Global MEA Image Sensors Market Revenue Million Forecast, by Technology 2019 & 2032
- Table 33: Global MEA Image Sensors Market Revenue Million Forecast, by Specification Type 2019 & 2032
- Table 34: Global MEA Image Sensors Market Revenue Million Forecast, by Application 2019 & 2032
- Table 35: Global MEA Image Sensors Market Revenue Million Forecast, by Country 2019 & 2032
- Table 36: United Kingdom MEA Image Sensors Market Revenue (Million) Forecast, by Application 2019 & 2032
- Table 37: Germany MEA Image Sensors Market Revenue (Million) Forecast, by Application 2019 & 2032
- Table 38: France MEA Image Sensors Market Revenue (Million) Forecast, by Application 2019 & 2032
- Table 39: Italy MEA Image Sensors Market Revenue (Million) Forecast, by Application 2019 & 2032
- Table 40: Spain MEA Image Sensors Market Revenue (Million) Forecast, by Application 2019 & 2032
- Table 41: Russia MEA Image Sensors Market Revenue (Million) Forecast, by Application 2019 & 2032
- Table 42: Benelux MEA Image Sensors Market Revenue (Million) Forecast, by Application 2019 & 2032
- Table 43: Nordics MEA Image Sensors Market Revenue (Million) Forecast, by Application 2019 & 2032
- Table 44: Rest of Europe MEA Image Sensors Market Revenue (Million) Forecast, by Application 2019 & 2032
- Table 45: Global MEA Image Sensors Market Revenue Million Forecast, by Type 2019 & 2032
- Table 46: Global MEA Image Sensors Market Revenue Million Forecast, by Technology 2019 & 2032
- Table 47: Global MEA Image Sensors Market Revenue Million Forecast, by Specification Type 2019 & 2032
- Table 48: Global MEA Image Sensors Market Revenue Million Forecast, by Application 2019 & 2032
- Table 49: Global MEA Image Sensors Market Revenue Million Forecast, by Country 2019 & 2032
- Table 50: Turkey MEA Image Sensors Market Revenue (Million) Forecast, by Application 2019 & 2032
- Table 51: Israel MEA Image Sensors Market Revenue (Million) Forecast, by Application 2019 & 2032
- Table 52: GCC MEA Image Sensors Market Revenue (Million) Forecast, by Application 2019 & 2032
- Table 53: North Africa MEA Image Sensors Market Revenue (Million) Forecast, by Application 2019 & 2032
- Table 54: South Africa MEA Image Sensors Market Revenue (Million) Forecast, by Application 2019 & 2032
- Table 55: Rest of Middle East & Africa MEA Image Sensors Market Revenue (Million) Forecast, by Application 2019 & 2032
- Table 56: Global MEA Image Sensors Market Revenue Million Forecast, by Type 2019 & 2032
- Table 57: Global MEA Image Sensors Market Revenue Million Forecast, by Technology 2019 & 2032
- Table 58: Global MEA Image Sensors Market Revenue Million Forecast, by Specification Type 2019 & 2032
- Table 59: Global MEA Image Sensors Market Revenue Million Forecast, by Application 2019 & 2032
- Table 60: Global MEA Image Sensors Market Revenue Million Forecast, by Country 2019 & 2032
- Table 61: China MEA Image Sensors Market Revenue (Million) Forecast, by Application 2019 & 2032
- Table 62: India MEA Image Sensors Market Revenue (Million) Forecast, by Application 2019 & 2032
- Table 63: Japan MEA Image Sensors Market Revenue (Million) Forecast, by Application 2019 & 2032
- Table 64: South Korea MEA Image Sensors Market Revenue (Million) Forecast, by Application 2019 & 2032
- Table 65: ASEAN MEA Image Sensors Market Revenue (Million) Forecast, by Application 2019 & 2032
- Table 66: Oceania MEA Image Sensors Market Revenue (Million) Forecast, by Application 2019 & 2032
- Table 67: Rest of Asia Pacific MEA Image Sensors Market Revenue (Million) Forecast, by Application 2019 & 2032
Frequently Asked Questions
1. What is the projected Compound Annual Growth Rate (CAGR) of the MEA Image Sensors Market?
The projected CAGR is approximately 6.40%.
2. Which companies are prominent players in the MEA Image Sensors Market?
Key companies in the market include Deep Blue Sensor, Canon Inc, Omnivision Technologies Inc, Teledyne DALSA Inc, Toshiba Corporation, SK Hynix Inc *List Not Exhaustive, Samsung Electronics Co Ltd, STMicroelectronics N V, ON Semiconductor Corporation, Sony Corporation.
3. What are the main segments of the MEA Image Sensors Market?
The market segments include Type, Technology, Specification Type, Application.
4. Can you provide details about the market size?
The market size is estimated to be USD XX Million as of 2022.
5. What are some drivers contributing to market growth?
Increased Demand in Automotive Applications; Demand for Gesture Recognition/Control in Vertical Applications; Low-Cost Availability of CMOS Image Sensors Deployed in Electronic Devices.
6. What are the notable trends driving market growth?
Consumer Electronics Segment to Hold Significant Market Share.
7. Are there any restraints impacting market growth?
High Manufacturing Costs and Increased Market Competition; Storage Space and Battery Consumption issues.
8. Can you provide examples of recent developments in the market?
September 2021 - Sony Semiconductor Solutions Corporation (Sony) announced the commercialization of the IMX487, a 2/3-type CMOS image sensor for industrial equipment, which is compatible with the UV (ultraviolet light) wavelength and comes with global shutter functionality and the industry's highest effective pixel count of approximately 8.13 megapixels.
9. What pricing options are available for accessing the report?
Pricing options include single-user, multi-user, and enterprise licenses priced at USD 4750, USD 4950, and USD 6800 respectively.
10. Is the market size provided in terms of value or volume?
The market size is provided in terms of value, measured in Million.
11. Are there any specific market keywords associated with the report?
Yes, the market keyword associated with the report is "MEA Image Sensors Market," which aids in identifying and referencing the specific market segment covered.
12. How do I determine which pricing option suits my needs best?
The pricing options vary based on user requirements and access needs. Individual users may opt for single-user licenses, while businesses requiring broader access may choose multi-user or enterprise licenses for cost-effective access to the report.
13. Are there any additional resources or data provided in the MEA Image Sensors Market report?
While the report offers comprehensive insights, it's advisable to review the specific contents or supplementary materials provided to ascertain if additional resources or data are available.
14. How can I stay updated on further developments or reports in the MEA Image Sensors Market?
To stay informed about further developments, trends, and reports in the MEA Image Sensors Market, consider subscribing to industry newsletters, following relevant companies and organizations, or regularly checking reputable industry news sources and publications.
Methodology
Step 1 - Identification of Relevant Samples Size from Population Database


Step 2 - Approaches for Defining Global Market Size (Value, Volume* & Price*)

Note*: In applicable scenarios
Step 3 - Data Sources
Primary Research
- Web Analytics
- Survey Reports
- Research Institute
- Latest Research Reports
- Opinion Leaders
Secondary Research
- Annual Reports
- White Paper
- Latest Press Release
- Industry Association
- Paid Database
- Investor Presentations

Step 4 - Data Triangulation
Involves using different sources of information in order to increase the validity of a study
These sources are likely to be stakeholders in a program - participants, other researchers, program staff, other community members, and so on.
Then we put all data in single framework & apply various statistical tools to find out the dynamic on the market.
During the analysis stage, feedback from the stakeholder groups would be compared to determine areas of agreement as well as areas of divergence


