
Key Insights
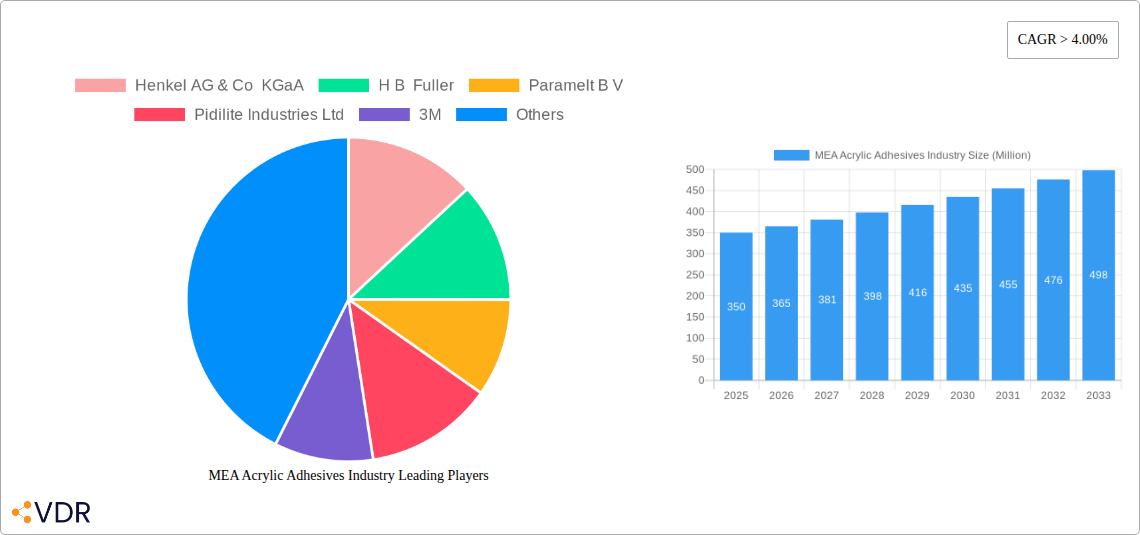
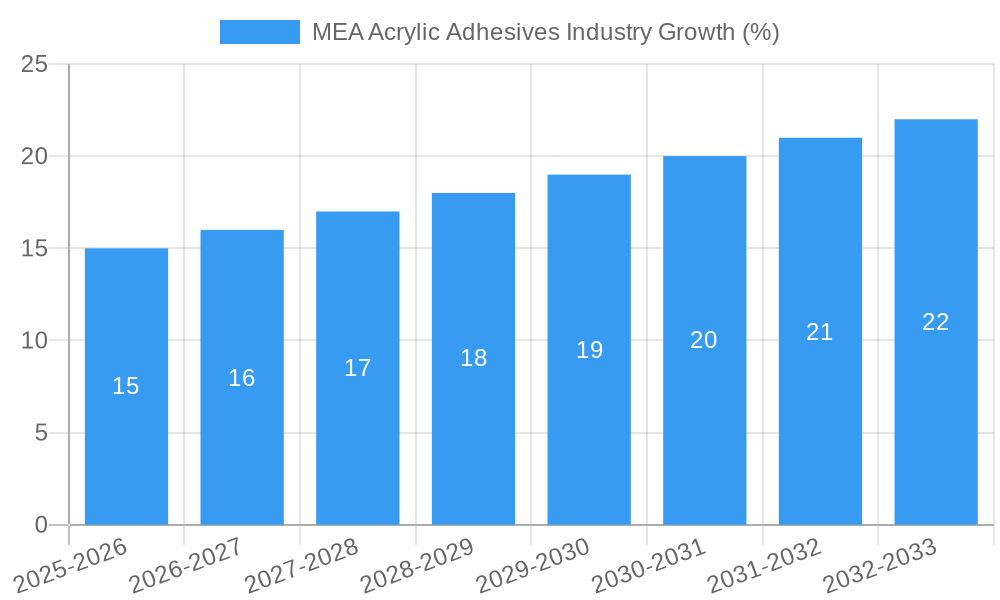
The Middle East and Africa (MEA) acrylic adhesives market is experiencing robust growth, driven by the burgeoning construction, packaging, and automotive sectors within the region. The market's expansion is fueled by increasing infrastructure development projects, a rising demand for durable and high-performance adhesives in diverse applications, and a shift towards advanced adhesive technologies offering improved bonding strength, faster curing times, and enhanced environmental friendliness. The construction industry, in particular, is a significant driver, with significant investments in residential and commercial building projects across the MEA region. Furthermore, the growth of the packaging industry, particularly in food and beverage, necessitates high-quality, reliable acrylic adhesives to ensure product integrity and shelf life. While the market faces challenges such as price volatility of raw materials and fluctuating oil prices (which impact production costs), the overall positive outlook for infrastructure development and industrial growth in the MEA region promises sustained expansion for the acrylic adhesives market. We estimate the MEA acrylic adhesives market size in 2025 to be approximately $350 million, projecting a compound annual growth rate (CAGR) exceeding 4% through 2033. This growth is anticipated to be largely driven by continued infrastructure development, increased industrialization and favorable government policies supporting economic development within the region. Key players are likely focusing on product innovation, strategic partnerships, and regional expansion to capitalize on this market potential.
Specific segments such as water-based acrylic adhesives are expected to witness higher growth rates compared to solvent-based options, owing to growing environmental concerns and stricter regulations regarding volatile organic compounds (VOCs). The increasing adoption of sustainable practices across industries will further propel demand for eco-friendly adhesives. Competition among major players in the MEA market is intense, with both global and regional companies striving to establish a strong market presence. The market's future growth trajectory will hinge upon continued economic expansion, successful infrastructure projects, and the adoption of sustainable adhesive solutions.
MEA Acrylic Adhesives Industry Market Report: 2019-2033
This comprehensive report provides an in-depth analysis of the Middle East and Africa (MEA) acrylic adhesives industry, offering valuable insights for industry professionals, investors, and strategic decision-makers. The report covers the period 2019-2033, with a base year of 2025 and a forecast period of 2025-2033. The market is segmented by technology (water-based, solvent-based, reactive, other) and end-user industry (building and construction, electrical and electronics, packaging, sporting goods, transportation, woodworking, others). The total market size in 2025 is estimated at XX Million units and is projected to reach XX Million units by 2033. Key players analyzed include Henkel AG & Co KGaA, HB Fuller, Paramelt B.V., Pidilite Industries Ltd, 3M, Mapei Inc, and many more.
MEA Acrylic Adhesives Industry Market Dynamics & Structure
This section analyzes the MEA acrylic adhesives market's competitive landscape, technological advancements, regulatory environment, and market trends. The market is moderately concentrated, with several major players and a significant number of smaller regional players.
Market Concentration: The top 5 players hold approximately xx% of the market share in 2025.
Technological Innovation: The industry is witnessing significant innovation in water-based and reactive adhesive technologies driven by the increasing demand for eco-friendly and high-performance solutions.
Regulatory Frameworks: Regional regulations concerning volatile organic compound (VOC) emissions and material safety are significantly influencing product development and market dynamics.
Competitive Product Substitutes: Competition arises from other adhesive types like epoxy and hot melt adhesives, impacting market share for acrylics.
End-User Demographics: Growth is fueled by the expanding construction, packaging, and automotive sectors in the MEA region.
M&A Trends: The past five years have seen xx M&A deals in the MEA acrylic adhesives industry, primarily focused on expanding geographical reach and product portfolios.
- Market share consolidation expected to increase in the next decade.
- Increased focus on sustainable and eco-friendly adhesive solutions.
- Stringent environmental regulations driving innovation in low-VOC formulations.
- Significant opportunities in emerging economies within the MEA region.
MEA Acrylic Adhesives Industry Growth Trends & Insights
The MEA acrylic adhesives market is experiencing robust growth driven by various factors. The market size expanded from XX million units in 2019 to XX million units in 2024, exhibiting a CAGR of xx%. This growth is primarily attributed to the rising construction activity, expanding industrial sector, and increasing demand for high-performance adhesives in various applications across different end-user industries. The adoption rate of advanced acrylic adhesives, particularly water-based and reactive types, is rising due to their superior performance characteristics and environmental friendliness. Consumer behavior shifts towards sustainable products further fuel this growth trend. Technological disruptions, particularly the development of innovative formulations with improved adhesion, durability, and processing ease, are propelling the market’s expansion.
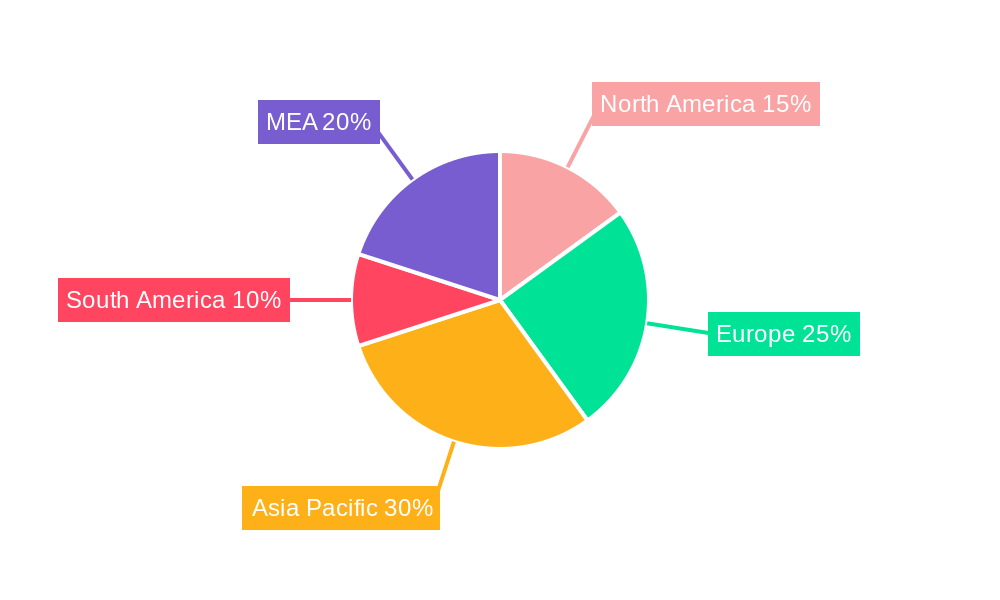
Dominant Regions, Countries, or Segments in MEA Acrylic Adhesives Industry
The building and construction sector is the dominant end-user industry for acrylic adhesives in MEA, accounting for approximately xx% of total consumption in 2025. Within the technology segment, water-based acrylic adhesives are leading with a market share of around xx%, driven by growing environmental awareness and stringent regulations.
Dominant Regions: The United Arab Emirates (UAE), Saudi Arabia, and South Africa are the leading markets for acrylic adhesives in MEA, primarily driven by robust construction activities and economic growth.
Key Drivers:
- Rapid urbanization and infrastructure development.
- Growing industrialization and manufacturing activities.
- Government initiatives promoting sustainable construction practices.
- Favorable economic conditions in certain MEA countries.
Dominant Segments:
- Building and Construction: High growth due to infrastructure development.
- Water-based Acrylic Adhesives: Strong preference due to environmental concerns.
MEA Acrylic Adhesives Industry Product Landscape
The MEA acrylic adhesives market offers a wide range of products catering to diverse applications. Innovations focus on developing specialized formulations with improved adhesion, heat resistance, flexibility, and water resistance. These advancements enhance performance and broaden the range of applications across various industries. Key features include improved viscosity control for easy application, faster curing times for enhanced productivity, and enhanced UV resistance for outdoor applications. Unique selling propositions (USPs) include eco-friendly formulations, customized solutions tailored to specific applications, and improved durability.
Key Drivers, Barriers & Challenges in MEA Acrylic Adhesives Industry
Key Drivers: Rising construction activities, increasing demand from the packaging and automotive industries, and the adoption of advanced technologies are key drivers. Government investments in infrastructure projects further stimulate demand. The need for high-performance adhesives with superior properties such as enhanced bonding strength, faster curing times, and improved water resistance are also key drivers.
Key Challenges: Fluctuations in raw material prices, stringent environmental regulations impacting manufacturing processes, and intense competition from other adhesive types pose significant challenges. Supply chain disruptions due to geopolitical factors also impact market stability. The average price fluctuation in raw materials during the historical period was approximately xx%.
Emerging Opportunities in MEA Acrylic Adhesives Industry
Emerging opportunities include the growing demand for eco-friendly adhesives in various sectors, including sustainable packaging and green building materials. The development of specialized adhesives for niche applications, like advanced electronics and renewable energy technologies, presents significant growth potential. Untapped markets in less developed regions within MEA also offer significant expansion opportunities.
Growth Accelerators in the MEA Acrylic Adhesives Industry
Technological advancements, strategic collaborations between adhesive manufacturers and end-user industries, and market expansion into new geographical regions will accelerate long-term growth. Focus on developing specialized adhesives for high-growth sectors like renewable energy and electric vehicles will drive significant expansion.
Key Players Shaping the MEA Acrylic Adhesives Industry Market
- Henkel AG & Co KGaA
- H B Fuller
- Paramelt B V
- Pidilite Industries Ltd
- 3M
- Mapei Inc
- Dymax Corporation
- Jowat AG
- Ashland
- Arkema Group
- Huntsman International LLC
- Tesa SE (A Beiersdorf Company)
- ITW Performance Polymers (Illinois Tool Works Inc)
- MUNZING Corporation
- Beardow Adams
- DuPont
- Dow
- Avery Dennison Corporation
- Hexion
- Franklin International
- Adhesives Research Inc
- Sika AG
- Collano AG
- Permabond LLC
- Wacker Chemie AG
- *List Not Exhaustive
Notable Milestones in MEA Acrylic Adhesives Industry Sector
- 2021: Henkel launched a new range of sustainable water-based acrylic adhesives.
- 2022: HB Fuller acquired a regional adhesive manufacturer, expanding its market reach.
- 2023: Significant investments in R&D for advanced acrylic adhesive technologies were observed across various players.
- (Further milestones will be detailed in the full report.)
In-Depth MEA Acrylic Adhesives Industry Market Outlook
The MEA acrylic adhesives market is poised for significant growth in the coming years, driven by strong demand from key end-user sectors and ongoing technological advancements. Strategic partnerships, investments in R&D, and product diversification will be crucial for players to capitalize on this market potential. Expanding into new applications and focusing on sustainable and high-performance solutions will be critical for success in the long term. The market is expected to remain dynamic, with ongoing consolidation and innovation shaping the competitive landscape.
MEA Acrylic Adhesives Industry Segmentation
-
1. Technology
- 1.1. Water-based
- 1.2. Solvent-based
- 1.3. Reactive
- 1.4. Other Technologies
-
2. End-user Industry
- 2.1. Building and Construction
- 2.2. Electrical and Electronics
- 2.3. Packaging
- 2.4. Sporting Goods
- 2.5. Transportation
- 2.6. Woodworking
- 2.7. Other End-user Industries
-
3. Geography
- 3.1. Saudi Arabia
- 3.2. South Africa
- 3.3. United Arab Emirates
- 3.4. Qatar
- 3.5. Rest of Middle-East and Africa
MEA Acrylic Adhesives Industry Segmentation By Geography
- 1. Saudi Arabia
- 2. South Africa
- 3. United Arab Emirates
- 4. Qatar
- 5. Rest of Middle East and Africa
MEA Acrylic Adhesives Industry REPORT HIGHLIGHTS
| Aspects | Details |
|---|---|
| Study Period | 2019-2033 |
| Base Year | 2024 |
| Estimated Year | 2025 |
| Forecast Period | 2025-2033 |
| Historical Period | 2019-2024 |
| Growth Rate | CAGR of > 4.00% from 2019-2033 |
| Segmentation |
|
Table of Contents
- 1. Introduction
- 1.1. Research Scope
- 1.2. Market Segmentation
- 1.3. Research Methodology
- 1.4. Definitions and Assumptions
- 2. Executive Summary
- 2.1. Introduction
- 3. Market Dynamics
- 3.1. Introduction
- 3.2. Market Drivers
- 3.2.1. ; High Packaging Demand from Food & Beverage Industry; Robust Growth of Construction Industry
- 3.3. Market Restrains
- 3.3.1. ; Availability of Alternative Feedstocks for Adhesives; Stringent Environmental Regulations Regarding VOC Emissions
- 3.4. Market Trends
- 3.4.1. Packaging Industry to Drive the Market Demand
- 4. Market Factor Analysis
- 4.1. Porters Five Forces
- 4.2. Supply/Value Chain
- 4.3. PESTEL analysis
- 4.4. Market Entropy
- 4.5. Patent/Trademark Analysis
- 5. Global MEA Acrylic Adhesives Industry Analysis, Insights and Forecast, 2019-2031
- 5.1. Market Analysis, Insights and Forecast - by Technology
- 5.1.1. Water-based
- 5.1.2. Solvent-based
- 5.1.3. Reactive
- 5.1.4. Other Technologies
- 5.2. Market Analysis, Insights and Forecast - by End-user Industry
- 5.2.1. Building and Construction
- 5.2.2. Electrical and Electronics
- 5.2.3. Packaging
- 5.2.4. Sporting Goods
- 5.2.5. Transportation
- 5.2.6. Woodworking
- 5.2.7. Other End-user Industries
- 5.3. Market Analysis, Insights and Forecast - by Geography
- 5.3.1. Saudi Arabia
- 5.3.2. South Africa
- 5.3.3. United Arab Emirates
- 5.3.4. Qatar
- 5.3.5. Rest of Middle-East and Africa
- 5.4. Market Analysis, Insights and Forecast - by Region
- 5.4.1. Saudi Arabia
- 5.4.2. South Africa
- 5.4.3. United Arab Emirates
- 5.4.4. Qatar
- 5.4.5. Rest of Middle East and Africa
- 5.1. Market Analysis, Insights and Forecast - by Technology
- 6. Saudi Arabia MEA Acrylic Adhesives Industry Analysis, Insights and Forecast, 2019-2031
- 6.1. Market Analysis, Insights and Forecast - by Technology
- 6.1.1. Water-based
- 6.1.2. Solvent-based
- 6.1.3. Reactive
- 6.1.4. Other Technologies
- 6.2. Market Analysis, Insights and Forecast - by End-user Industry
- 6.2.1. Building and Construction
- 6.2.2. Electrical and Electronics
- 6.2.3. Packaging
- 6.2.4. Sporting Goods
- 6.2.5. Transportation
- 6.2.6. Woodworking
- 6.2.7. Other End-user Industries
- 6.3. Market Analysis, Insights and Forecast - by Geography
- 6.3.1. Saudi Arabia
- 6.3.2. South Africa
- 6.3.3. United Arab Emirates
- 6.3.4. Qatar
- 6.3.5. Rest of Middle-East and Africa
- 6.1. Market Analysis, Insights and Forecast - by Technology
- 7. South Africa MEA Acrylic Adhesives Industry Analysis, Insights and Forecast, 2019-2031
- 7.1. Market Analysis, Insights and Forecast - by Technology
- 7.1.1. Water-based
- 7.1.2. Solvent-based
- 7.1.3. Reactive
- 7.1.4. Other Technologies
- 7.2. Market Analysis, Insights and Forecast - by End-user Industry
- 7.2.1. Building and Construction
- 7.2.2. Electrical and Electronics
- 7.2.3. Packaging
- 7.2.4. Sporting Goods
- 7.2.5. Transportation
- 7.2.6. Woodworking
- 7.2.7. Other End-user Industries
- 7.3. Market Analysis, Insights and Forecast - by Geography
- 7.3.1. Saudi Arabia
- 7.3.2. South Africa
- 7.3.3. United Arab Emirates
- 7.3.4. Qatar
- 7.3.5. Rest of Middle-East and Africa
- 7.1. Market Analysis, Insights and Forecast - by Technology
- 8. United Arab Emirates MEA Acrylic Adhesives Industry Analysis, Insights and Forecast, 2019-2031
- 8.1. Market Analysis, Insights and Forecast - by Technology
- 8.1.1. Water-based
- 8.1.2. Solvent-based
- 8.1.3. Reactive
- 8.1.4. Other Technologies
- 8.2. Market Analysis, Insights and Forecast - by End-user Industry
- 8.2.1. Building and Construction
- 8.2.2. Electrical and Electronics
- 8.2.3. Packaging
- 8.2.4. Sporting Goods
- 8.2.5. Transportation
- 8.2.6. Woodworking
- 8.2.7. Other End-user Industries
- 8.3. Market Analysis, Insights and Forecast - by Geography
- 8.3.1. Saudi Arabia
- 8.3.2. South Africa
- 8.3.3. United Arab Emirates
- 8.3.4. Qatar
- 8.3.5. Rest of Middle-East and Africa
- 8.1. Market Analysis, Insights and Forecast - by Technology
- 9. Qatar MEA Acrylic Adhesives Industry Analysis, Insights and Forecast, 2019-2031
- 9.1. Market Analysis, Insights and Forecast - by Technology
- 9.1.1. Water-based
- 9.1.2. Solvent-based
- 9.1.3. Reactive
- 9.1.4. Other Technologies
- 9.2. Market Analysis, Insights and Forecast - by End-user Industry
- 9.2.1. Building and Construction
- 9.2.2. Electrical and Electronics
- 9.2.3. Packaging
- 9.2.4. Sporting Goods
- 9.2.5. Transportation
- 9.2.6. Woodworking
- 9.2.7. Other End-user Industries
- 9.3. Market Analysis, Insights and Forecast - by Geography
- 9.3.1. Saudi Arabia
- 9.3.2. South Africa
- 9.3.3. United Arab Emirates
- 9.3.4. Qatar
- 9.3.5. Rest of Middle-East and Africa
- 9.1. Market Analysis, Insights and Forecast - by Technology
- 10. Rest of Middle East and Africa MEA Acrylic Adhesives Industry Analysis, Insights and Forecast, 2019-2031
- 10.1. Market Analysis, Insights and Forecast - by Technology
- 10.1.1. Water-based
- 10.1.2. Solvent-based
- 10.1.3. Reactive
- 10.1.4. Other Technologies
- 10.2. Market Analysis, Insights and Forecast - by End-user Industry
- 10.2.1. Building and Construction
- 10.2.2. Electrical and Electronics
- 10.2.3. Packaging
- 10.2.4. Sporting Goods
- 10.2.5. Transportation
- 10.2.6. Woodworking
- 10.2.7. Other End-user Industries
- 10.3. Market Analysis, Insights and Forecast - by Geography
- 10.3.1. Saudi Arabia
- 10.3.2. South Africa
- 10.3.3. United Arab Emirates
- 10.3.4. Qatar
- 10.3.5. Rest of Middle-East and Africa
- 10.1. Market Analysis, Insights and Forecast - by Technology
- 11. North America MEA Acrylic Adhesives Industry Analysis, Insights and Forecast, 2019-2031
- 11.1. Market Analysis, Insights and Forecast - By Country/Sub-region
- 11.1.1 United States
- 11.1.2 Canada
- 11.1.3 Mexico
- 12. Europe MEA Acrylic Adhesives Industry Analysis, Insights and Forecast, 2019-2031
- 12.1. Market Analysis, Insights and Forecast - By Country/Sub-region
- 12.1.1 Germany
- 12.1.2 United Kingdom
- 12.1.3 France
- 12.1.4 Spain
- 12.1.5 Italy
- 12.1.6 Spain
- 12.1.7 Belgium
- 12.1.8 Netherland
- 12.1.9 Nordics
- 12.1.10 Rest of Europe
- 13. Asia Pacific MEA Acrylic Adhesives Industry Analysis, Insights and Forecast, 2019-2031
- 13.1. Market Analysis, Insights and Forecast - By Country/Sub-region
- 13.1.1 China
- 13.1.2 Japan
- 13.1.3 India
- 13.1.4 South Korea
- 13.1.5 Southeast Asia
- 13.1.6 Australia
- 13.1.7 Indonesia
- 13.1.8 Phillipes
- 13.1.9 Singapore
- 13.1.10 Thailandc
- 13.1.11 Rest of Asia Pacific
- 14. South America MEA Acrylic Adhesives Industry Analysis, Insights and Forecast, 2019-2031
- 14.1. Market Analysis, Insights and Forecast - By Country/Sub-region
- 14.1.1 Brazil
- 14.1.2 Argentina
- 14.1.3 Peru
- 14.1.4 Chile
- 14.1.5 Colombia
- 14.1.6 Ecuador
- 14.1.7 Venezuela
- 14.1.8 Rest of South America
- 15. MEA MEA Acrylic Adhesives Industry Analysis, Insights and Forecast, 2019-2031
- 15.1. Market Analysis, Insights and Forecast - By Country/Sub-region
- 15.1.1 United Arab Emirates
- 15.1.2 Saudi Arabia
- 15.1.3 South Africa
- 15.1.4 Rest of Middle East and Africa
- 16. Competitive Analysis
- 16.1. Global Market Share Analysis 2024
- 16.2. Company Profiles
- 16.2.1 Henkel AG & Co KGaA
- 16.2.1.1. Overview
- 16.2.1.2. Products
- 16.2.1.3. SWOT Analysis
- 16.2.1.4. Recent Developments
- 16.2.1.5. Financials (Based on Availability)
- 16.2.2 H B Fuller
- 16.2.2.1. Overview
- 16.2.2.2. Products
- 16.2.2.3. SWOT Analysis
- 16.2.2.4. Recent Developments
- 16.2.2.5. Financials (Based on Availability)
- 16.2.3 Paramelt B V
- 16.2.3.1. Overview
- 16.2.3.2. Products
- 16.2.3.3. SWOT Analysis
- 16.2.3.4. Recent Developments
- 16.2.3.5. Financials (Based on Availability)
- 16.2.4 Pidilite Industries Ltd
- 16.2.4.1. Overview
- 16.2.4.2. Products
- 16.2.4.3. SWOT Analysis
- 16.2.4.4. Recent Developments
- 16.2.4.5. Financials (Based on Availability)
- 16.2.5 3M
- 16.2.5.1. Overview
- 16.2.5.2. Products
- 16.2.5.3. SWOT Analysis
- 16.2.5.4. Recent Developments
- 16.2.5.5. Financials (Based on Availability)
- 16.2.6 Mapei Inc
- 16.2.6.1. Overview
- 16.2.6.2. Products
- 16.2.6.3. SWOT Analysis
- 16.2.6.4. Recent Developments
- 16.2.6.5. Financials (Based on Availability)
- 16.2.7 Dymax Corporation
- 16.2.7.1. Overview
- 16.2.7.2. Products
- 16.2.7.3. SWOT Analysis
- 16.2.7.4. Recent Developments
- 16.2.7.5. Financials (Based on Availability)
- 16.2.8 Jowat AG
- 16.2.8.1. Overview
- 16.2.8.2. Products
- 16.2.8.3. SWOT Analysis
- 16.2.8.4. Recent Developments
- 16.2.8.5. Financials (Based on Availability)
- 16.2.9 Ashland
- 16.2.9.1. Overview
- 16.2.9.2. Products
- 16.2.9.3. SWOT Analysis
- 16.2.9.4. Recent Developments
- 16.2.9.5. Financials (Based on Availability)
- 16.2.10 Arkema Group
- 16.2.10.1. Overview
- 16.2.10.2. Products
- 16.2.10.3. SWOT Analysis
- 16.2.10.4. Recent Developments
- 16.2.10.5. Financials (Based on Availability)
- 16.2.11 Huntsman International LLC
- 16.2.11.1. Overview
- 16.2.11.2. Products
- 16.2.11.3. SWOT Analysis
- 16.2.11.4. Recent Developments
- 16.2.11.5. Financials (Based on Availability)
- 16.2.12 Tesa SE (A Beiersdorf Company)
- 16.2.12.1. Overview
- 16.2.12.2. Products
- 16.2.12.3. SWOT Analysis
- 16.2.12.4. Recent Developments
- 16.2.12.5. Financials (Based on Availability)
- 16.2.13 ITW Performance Polymers (Illinois Tool Works Inc )
- 16.2.13.1. Overview
- 16.2.13.2. Products
- 16.2.13.3. SWOT Analysis
- 16.2.13.4. Recent Developments
- 16.2.13.5. Financials (Based on Availability)
- 16.2.14 MUNZING Corporation
- 16.2.14.1. Overview
- 16.2.14.2. Products
- 16.2.14.3. SWOT Analysis
- 16.2.14.4. Recent Developments
- 16.2.14.5. Financials (Based on Availability)
- 16.2.15 Beardow Adams
- 16.2.15.1. Overview
- 16.2.15.2. Products
- 16.2.15.3. SWOT Analysis
- 16.2.15.4. Recent Developments
- 16.2.15.5. Financials (Based on Availability)
- 16.2.16 DuPont
- 16.2.16.1. Overview
- 16.2.16.2. Products
- 16.2.16.3. SWOT Analysis
- 16.2.16.4. Recent Developments
- 16.2.16.5. Financials (Based on Availability)
- 16.2.17 Dow
- 16.2.17.1. Overview
- 16.2.17.2. Products
- 16.2.17.3. SWOT Analysis
- 16.2.17.4. Recent Developments
- 16.2.17.5. Financials (Based on Availability)
- 16.2.18 Avery Dennison Corporation
- 16.2.18.1. Overview
- 16.2.18.2. Products
- 16.2.18.3. SWOT Analysis
- 16.2.18.4. Recent Developments
- 16.2.18.5. Financials (Based on Availability)
- 16.2.19 Hexion
- 16.2.19.1. Overview
- 16.2.19.2. Products
- 16.2.19.3. SWOT Analysis
- 16.2.19.4. Recent Developments
- 16.2.19.5. Financials (Based on Availability)
- 16.2.20 Franklin International
- 16.2.20.1. Overview
- 16.2.20.2. Products
- 16.2.20.3. SWOT Analysis
- 16.2.20.4. Recent Developments
- 16.2.20.5. Financials (Based on Availability)
- 16.2.21 Adhesives Research Inc
- 16.2.21.1. Overview
- 16.2.21.2. Products
- 16.2.21.3. SWOT Analysis
- 16.2.21.4. Recent Developments
- 16.2.21.5. Financials (Based on Availability)
- 16.2.22 Sika AG
- 16.2.22.1. Overview
- 16.2.22.2. Products
- 16.2.22.3. SWOT Analysis
- 16.2.22.4. Recent Developments
- 16.2.22.5. Financials (Based on Availability)
- 16.2.23 Collano AG
- 16.2.23.1. Overview
- 16.2.23.2. Products
- 16.2.23.3. SWOT Analysis
- 16.2.23.4. Recent Developments
- 16.2.23.5. Financials (Based on Availability)
- 16.2.24 Permabond LLC
- 16.2.24.1. Overview
- 16.2.24.2. Products
- 16.2.24.3. SWOT Analysis
- 16.2.24.4. Recent Developments
- 16.2.24.5. Financials (Based on Availability)
- 16.2.25 Wacker Chemie AG*List Not Exhaustive
- 16.2.25.1. Overview
- 16.2.25.2. Products
- 16.2.25.3. SWOT Analysis
- 16.2.25.4. Recent Developments
- 16.2.25.5. Financials (Based on Availability)
- 16.2.1 Henkel AG & Co KGaA
List of Figures
- Figure 1: Global MEA Acrylic Adhesives Industry Revenue Breakdown (Million, %) by Region 2024 & 2032
- Figure 2: North America MEA Acrylic Adhesives Industry Revenue (Million), by Country 2024 & 2032
- Figure 3: North America MEA Acrylic Adhesives Industry Revenue Share (%), by Country 2024 & 2032
- Figure 4: Europe MEA Acrylic Adhesives Industry Revenue (Million), by Country 2024 & 2032
- Figure 5: Europe MEA Acrylic Adhesives Industry Revenue Share (%), by Country 2024 & 2032
- Figure 6: Asia Pacific MEA Acrylic Adhesives Industry Revenue (Million), by Country 2024 & 2032
- Figure 7: Asia Pacific MEA Acrylic Adhesives Industry Revenue Share (%), by Country 2024 & 2032
- Figure 8: South America MEA Acrylic Adhesives Industry Revenue (Million), by Country 2024 & 2032
- Figure 9: South America MEA Acrylic Adhesives Industry Revenue Share (%), by Country 2024 & 2032
- Figure 10: MEA MEA Acrylic Adhesives Industry Revenue (Million), by Country 2024 & 2032
- Figure 11: MEA MEA Acrylic Adhesives Industry Revenue Share (%), by Country 2024 & 2032
- Figure 12: Saudi Arabia MEA Acrylic Adhesives Industry Revenue (Million), by Technology 2024 & 2032
- Figure 13: Saudi Arabia MEA Acrylic Adhesives Industry Revenue Share (%), by Technology 2024 & 2032
- Figure 14: Saudi Arabia MEA Acrylic Adhesives Industry Revenue (Million), by End-user Industry 2024 & 2032
- Figure 15: Saudi Arabia MEA Acrylic Adhesives Industry Revenue Share (%), by End-user Industry 2024 & 2032
- Figure 16: Saudi Arabia MEA Acrylic Adhesives Industry Revenue (Million), by Geography 2024 & 2032
- Figure 17: Saudi Arabia MEA Acrylic Adhesives Industry Revenue Share (%), by Geography 2024 & 2032
- Figure 18: Saudi Arabia MEA Acrylic Adhesives Industry Revenue (Million), by Country 2024 & 2032
- Figure 19: Saudi Arabia MEA Acrylic Adhesives Industry Revenue Share (%), by Country 2024 & 2032
- Figure 20: South Africa MEA Acrylic Adhesives Industry Revenue (Million), by Technology 2024 & 2032
- Figure 21: South Africa MEA Acrylic Adhesives Industry Revenue Share (%), by Technology 2024 & 2032
- Figure 22: South Africa MEA Acrylic Adhesives Industry Revenue (Million), by End-user Industry 2024 & 2032
- Figure 23: South Africa MEA Acrylic Adhesives Industry Revenue Share (%), by End-user Industry 2024 & 2032
- Figure 24: South Africa MEA Acrylic Adhesives Industry Revenue (Million), by Geography 2024 & 2032
- Figure 25: South Africa MEA Acrylic Adhesives Industry Revenue Share (%), by Geography 2024 & 2032
- Figure 26: South Africa MEA Acrylic Adhesives Industry Revenue (Million), by Country 2024 & 2032
- Figure 27: South Africa MEA Acrylic Adhesives Industry Revenue Share (%), by Country 2024 & 2032
- Figure 28: United Arab Emirates MEA Acrylic Adhesives Industry Revenue (Million), by Technology 2024 & 2032
- Figure 29: United Arab Emirates MEA Acrylic Adhesives Industry Revenue Share (%), by Technology 2024 & 2032
- Figure 30: United Arab Emirates MEA Acrylic Adhesives Industry Revenue (Million), by End-user Industry 2024 & 2032
- Figure 31: United Arab Emirates MEA Acrylic Adhesives Industry Revenue Share (%), by End-user Industry 2024 & 2032
- Figure 32: United Arab Emirates MEA Acrylic Adhesives Industry Revenue (Million), by Geography 2024 & 2032
- Figure 33: United Arab Emirates MEA Acrylic Adhesives Industry Revenue Share (%), by Geography 2024 & 2032
- Figure 34: United Arab Emirates MEA Acrylic Adhesives Industry Revenue (Million), by Country 2024 & 2032
- Figure 35: United Arab Emirates MEA Acrylic Adhesives Industry Revenue Share (%), by Country 2024 & 2032
- Figure 36: Qatar MEA Acrylic Adhesives Industry Revenue (Million), by Technology 2024 & 2032
- Figure 37: Qatar MEA Acrylic Adhesives Industry Revenue Share (%), by Technology 2024 & 2032
- Figure 38: Qatar MEA Acrylic Adhesives Industry Revenue (Million), by End-user Industry 2024 & 2032
- Figure 39: Qatar MEA Acrylic Adhesives Industry Revenue Share (%), by End-user Industry 2024 & 2032
- Figure 40: Qatar MEA Acrylic Adhesives Industry Revenue (Million), by Geography 2024 & 2032
- Figure 41: Qatar MEA Acrylic Adhesives Industry Revenue Share (%), by Geography 2024 & 2032
- Figure 42: Qatar MEA Acrylic Adhesives Industry Revenue (Million), by Country 2024 & 2032
- Figure 43: Qatar MEA Acrylic Adhesives Industry Revenue Share (%), by Country 2024 & 2032
- Figure 44: Rest of Middle East and Africa MEA Acrylic Adhesives Industry Revenue (Million), by Technology 2024 & 2032
- Figure 45: Rest of Middle East and Africa MEA Acrylic Adhesives Industry Revenue Share (%), by Technology 2024 & 2032
- Figure 46: Rest of Middle East and Africa MEA Acrylic Adhesives Industry Revenue (Million), by End-user Industry 2024 & 2032
- Figure 47: Rest of Middle East and Africa MEA Acrylic Adhesives Industry Revenue Share (%), by End-user Industry 2024 & 2032
- Figure 48: Rest of Middle East and Africa MEA Acrylic Adhesives Industry Revenue (Million), by Geography 2024 & 2032
- Figure 49: Rest of Middle East and Africa MEA Acrylic Adhesives Industry Revenue Share (%), by Geography 2024 & 2032
- Figure 50: Rest of Middle East and Africa MEA Acrylic Adhesives Industry Revenue (Million), by Country 2024 & 2032
- Figure 51: Rest of Middle East and Africa MEA Acrylic Adhesives Industry Revenue Share (%), by Country 2024 & 2032
List of Tables
- Table 1: Global MEA Acrylic Adhesives Industry Revenue Million Forecast, by Region 2019 & 2032
- Table 2: Global MEA Acrylic Adhesives Industry Revenue Million Forecast, by Technology 2019 & 2032
- Table 3: Global MEA Acrylic Adhesives Industry Revenue Million Forecast, by End-user Industry 2019 & 2032
- Table 4: Global MEA Acrylic Adhesives Industry Revenue Million Forecast, by Geography 2019 & 2032
- Table 5: Global MEA Acrylic Adhesives Industry Revenue Million Forecast, by Region 2019 & 2032
- Table 6: Global MEA Acrylic Adhesives Industry Revenue Million Forecast, by Country 2019 & 2032
- Table 7: United States MEA Acrylic Adhesives Industry Revenue (Million) Forecast, by Application 2019 & 2032
- Table 8: Canada MEA Acrylic Adhesives Industry Revenue (Million) Forecast, by Application 2019 & 2032
- Table 9: Mexico MEA Acrylic Adhesives Industry Revenue (Million) Forecast, by Application 2019 & 2032
- Table 10: Global MEA Acrylic Adhesives Industry Revenue Million Forecast, by Country 2019 & 2032
- Table 11: Germany MEA Acrylic Adhesives Industry Revenue (Million) Forecast, by Application 2019 & 2032
- Table 12: United Kingdom MEA Acrylic Adhesives Industry Revenue (Million) Forecast, by Application 2019 & 2032
- Table 13: France MEA Acrylic Adhesives Industry Revenue (Million) Forecast, by Application 2019 & 2032
- Table 14: Spain MEA Acrylic Adhesives Industry Revenue (Million) Forecast, by Application 2019 & 2032
- Table 15: Italy MEA Acrylic Adhesives Industry Revenue (Million) Forecast, by Application 2019 & 2032
- Table 16: Spain MEA Acrylic Adhesives Industry Revenue (Million) Forecast, by Application 2019 & 2032
- Table 17: Belgium MEA Acrylic Adhesives Industry Revenue (Million) Forecast, by Application 2019 & 2032
- Table 18: Netherland MEA Acrylic Adhesives Industry Revenue (Million) Forecast, by Application 2019 & 2032
- Table 19: Nordics MEA Acrylic Adhesives Industry Revenue (Million) Forecast, by Application 2019 & 2032
- Table 20: Rest of Europe MEA Acrylic Adhesives Industry Revenue (Million) Forecast, by Application 2019 & 2032
- Table 21: Global MEA Acrylic Adhesives Industry Revenue Million Forecast, by Country 2019 & 2032
- Table 22: China MEA Acrylic Adhesives Industry Revenue (Million) Forecast, by Application 2019 & 2032
- Table 23: Japan MEA Acrylic Adhesives Industry Revenue (Million) Forecast, by Application 2019 & 2032
- Table 24: India MEA Acrylic Adhesives Industry Revenue (Million) Forecast, by Application 2019 & 2032
- Table 25: South Korea MEA Acrylic Adhesives Industry Revenue (Million) Forecast, by Application 2019 & 2032
- Table 26: Southeast Asia MEA Acrylic Adhesives Industry Revenue (Million) Forecast, by Application 2019 & 2032
- Table 27: Australia MEA Acrylic Adhesives Industry Revenue (Million) Forecast, by Application 2019 & 2032
- Table 28: Indonesia MEA Acrylic Adhesives Industry Revenue (Million) Forecast, by Application 2019 & 2032
- Table 29: Phillipes MEA Acrylic Adhesives Industry Revenue (Million) Forecast, by Application 2019 & 2032
- Table 30: Singapore MEA Acrylic Adhesives Industry Revenue (Million) Forecast, by Application 2019 & 2032
- Table 31: Thailandc MEA Acrylic Adhesives Industry Revenue (Million) Forecast, by Application 2019 & 2032
- Table 32: Rest of Asia Pacific MEA Acrylic Adhesives Industry Revenue (Million) Forecast, by Application 2019 & 2032
- Table 33: Global MEA Acrylic Adhesives Industry Revenue Million Forecast, by Country 2019 & 2032
- Table 34: Brazil MEA Acrylic Adhesives Industry Revenue (Million) Forecast, by Application 2019 & 2032
- Table 35: Argentina MEA Acrylic Adhesives Industry Revenue (Million) Forecast, by Application 2019 & 2032
- Table 36: Peru MEA Acrylic Adhesives Industry Revenue (Million) Forecast, by Application 2019 & 2032
- Table 37: Chile MEA Acrylic Adhesives Industry Revenue (Million) Forecast, by Application 2019 & 2032
- Table 38: Colombia MEA Acrylic Adhesives Industry Revenue (Million) Forecast, by Application 2019 & 2032
- Table 39: Ecuador MEA Acrylic Adhesives Industry Revenue (Million) Forecast, by Application 2019 & 2032
- Table 40: Venezuela MEA Acrylic Adhesives Industry Revenue (Million) Forecast, by Application 2019 & 2032
- Table 41: Rest of South America MEA Acrylic Adhesives Industry Revenue (Million) Forecast, by Application 2019 & 2032
- Table 42: Global MEA Acrylic Adhesives Industry Revenue Million Forecast, by Country 2019 & 2032
- Table 43: United Arab Emirates MEA Acrylic Adhesives Industry Revenue (Million) Forecast, by Application 2019 & 2032
- Table 44: Saudi Arabia MEA Acrylic Adhesives Industry Revenue (Million) Forecast, by Application 2019 & 2032
- Table 45: South Africa MEA Acrylic Adhesives Industry Revenue (Million) Forecast, by Application 2019 & 2032
- Table 46: Rest of Middle East and Africa MEA Acrylic Adhesives Industry Revenue (Million) Forecast, by Application 2019 & 2032
- Table 47: Global MEA Acrylic Adhesives Industry Revenue Million Forecast, by Technology 2019 & 2032
- Table 48: Global MEA Acrylic Adhesives Industry Revenue Million Forecast, by End-user Industry 2019 & 2032
- Table 49: Global MEA Acrylic Adhesives Industry Revenue Million Forecast, by Geography 2019 & 2032
- Table 50: Global MEA Acrylic Adhesives Industry Revenue Million Forecast, by Country 2019 & 2032
- Table 51: Global MEA Acrylic Adhesives Industry Revenue Million Forecast, by Technology 2019 & 2032
- Table 52: Global MEA Acrylic Adhesives Industry Revenue Million Forecast, by End-user Industry 2019 & 2032
- Table 53: Global MEA Acrylic Adhesives Industry Revenue Million Forecast, by Geography 2019 & 2032
- Table 54: Global MEA Acrylic Adhesives Industry Revenue Million Forecast, by Country 2019 & 2032
- Table 55: Global MEA Acrylic Adhesives Industry Revenue Million Forecast, by Technology 2019 & 2032
- Table 56: Global MEA Acrylic Adhesives Industry Revenue Million Forecast, by End-user Industry 2019 & 2032
- Table 57: Global MEA Acrylic Adhesives Industry Revenue Million Forecast, by Geography 2019 & 2032
- Table 58: Global MEA Acrylic Adhesives Industry Revenue Million Forecast, by Country 2019 & 2032
- Table 59: Global MEA Acrylic Adhesives Industry Revenue Million Forecast, by Technology 2019 & 2032
- Table 60: Global MEA Acrylic Adhesives Industry Revenue Million Forecast, by End-user Industry 2019 & 2032
- Table 61: Global MEA Acrylic Adhesives Industry Revenue Million Forecast, by Geography 2019 & 2032
- Table 62: Global MEA Acrylic Adhesives Industry Revenue Million Forecast, by Country 2019 & 2032
- Table 63: Global MEA Acrylic Adhesives Industry Revenue Million Forecast, by Technology 2019 & 2032
- Table 64: Global MEA Acrylic Adhesives Industry Revenue Million Forecast, by End-user Industry 2019 & 2032
- Table 65: Global MEA Acrylic Adhesives Industry Revenue Million Forecast, by Geography 2019 & 2032
- Table 66: Global MEA Acrylic Adhesives Industry Revenue Million Forecast, by Country 2019 & 2032
Frequently Asked Questions
1. What is the projected Compound Annual Growth Rate (CAGR) of the MEA Acrylic Adhesives Industry?
The projected CAGR is approximately > 4.00%.
2. Which companies are prominent players in the MEA Acrylic Adhesives Industry?
Key companies in the market include Henkel AG & Co KGaA, H B Fuller, Paramelt B V, Pidilite Industries Ltd, 3M, Mapei Inc, Dymax Corporation, Jowat AG, Ashland, Arkema Group, Huntsman International LLC, Tesa SE (A Beiersdorf Company), ITW Performance Polymers (Illinois Tool Works Inc ), MUNZING Corporation, Beardow Adams, DuPont, Dow, Avery Dennison Corporation, Hexion, Franklin International, Adhesives Research Inc, Sika AG, Collano AG, Permabond LLC, Wacker Chemie AG*List Not Exhaustive.
3. What are the main segments of the MEA Acrylic Adhesives Industry?
The market segments include Technology, End-user Industry, Geography.
4. Can you provide details about the market size?
The market size is estimated to be USD XX Million as of 2022.
5. What are some drivers contributing to market growth?
; High Packaging Demand from Food & Beverage Industry; Robust Growth of Construction Industry.
6. What are the notable trends driving market growth?
Packaging Industry to Drive the Market Demand.
7. Are there any restraints impacting market growth?
; Availability of Alternative Feedstocks for Adhesives; Stringent Environmental Regulations Regarding VOC Emissions.
8. Can you provide examples of recent developments in the market?
N/A
9. What pricing options are available for accessing the report?
Pricing options include single-user, multi-user, and enterprise licenses priced at USD 4750, USD 5250, and USD 8750 respectively.
10. Is the market size provided in terms of value or volume?
The market size is provided in terms of value, measured in Million.
11. Are there any specific market keywords associated with the report?
Yes, the market keyword associated with the report is "MEA Acrylic Adhesives Industry," which aids in identifying and referencing the specific market segment covered.
12. How do I determine which pricing option suits my needs best?
The pricing options vary based on user requirements and access needs. Individual users may opt for single-user licenses, while businesses requiring broader access may choose multi-user or enterprise licenses for cost-effective access to the report.
13. Are there any additional resources or data provided in the MEA Acrylic Adhesives Industry report?
While the report offers comprehensive insights, it's advisable to review the specific contents or supplementary materials provided to ascertain if additional resources or data are available.
14. How can I stay updated on further developments or reports in the MEA Acrylic Adhesives Industry?
To stay informed about further developments, trends, and reports in the MEA Acrylic Adhesives Industry, consider subscribing to industry newsletters, following relevant companies and organizations, or regularly checking reputable industry news sources and publications.
Methodology
Step 1 - Identification of Relevant Samples Size from Population Database


Step 2 - Approaches for Defining Global Market Size (Value, Volume* & Price*)

Note*: In applicable scenarios
Step 3 - Data Sources
Primary Research
- Web Analytics
- Survey Reports
- Research Institute
- Latest Research Reports
- Opinion Leaders
Secondary Research
- Annual Reports
- White Paper
- Latest Press Release
- Industry Association
- Paid Database
- Investor Presentations

Step 4 - Data Triangulation
Involves using different sources of information in order to increase the validity of a study
These sources are likely to be stakeholders in a program - participants, other researchers, program staff, other community members, and so on.
Then we put all data in single framework & apply various statistical tools to find out the dynamic on the market.
During the analysis stage, feedback from the stakeholder groups would be compared to determine areas of agreement as well as areas of divergence


