
Key Insights
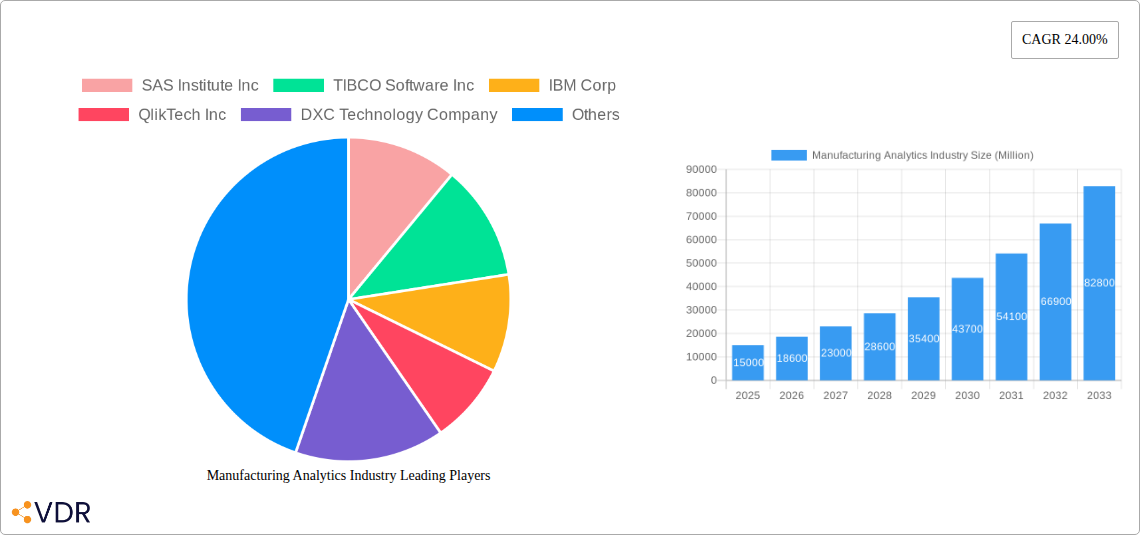
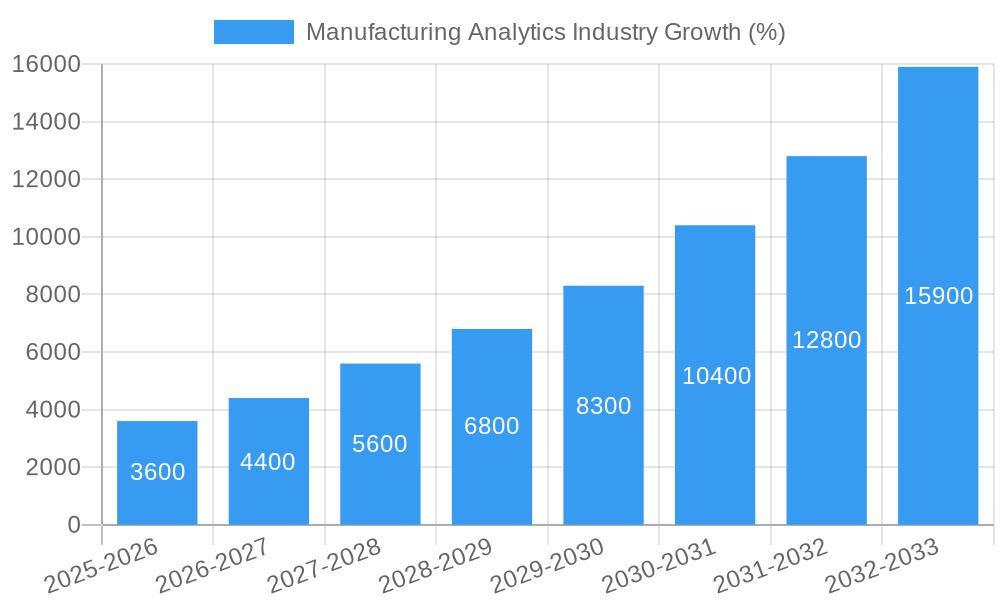
The Manufacturing Analytics market is experiencing robust growth, projected to reach a substantial size with a Compound Annual Growth Rate (CAGR) of 24% from 2025 to 2033. This expansion is fueled by several key drivers. The increasing need for enhanced operational efficiency, predictive maintenance to minimize downtime, and the imperative to optimize supply chains are major factors pushing market adoption. Furthermore, the proliferation of Industry 4.0 technologies, including the Internet of Things (IoT) and advanced data analytics platforms, is providing manufacturers with unprecedented access to real-time data, enabling data-driven decision-making and process improvements. Specific applications like inventory management and predictive maintenance are seeing particularly strong growth, driven by the potential for significant cost savings and improved product quality. Cloud-based deployment models are gaining traction due to their scalability and cost-effectiveness, while on-premise solutions remain relevant for businesses with stringent data security requirements. Geographically, North America and Europe currently hold significant market share, but the Asia-Pacific region is expected to witness rapid growth in the coming years, driven by increasing industrialization and technological advancements in countries like China and India. However, factors like high initial investment costs for implementation and the need for skilled personnel to manage and interpret data could potentially act as restraints on market expansion.
The competitive landscape is characterized by a mix of established enterprise software vendors and specialized analytics providers. Companies like SAS, TIBCO, IBM, and others are leveraging their existing strengths in data analytics to capture a significant share of the market. Meanwhile, niche players are focusing on specific industry verticals or applications, offering tailored solutions to meet the unique needs of various manufacturing sectors. The future success in this market will likely depend on factors such as the ability to integrate seamlessly with existing manufacturing systems, provide user-friendly interfaces, offer robust data security measures, and demonstrate a clear return on investment for manufacturers. The market's continuous evolution necessitates ongoing innovation and adaptation to emerging technologies, ensuring manufacturers maintain a competitive edge in a rapidly changing global landscape.
Manufacturing Analytics Industry Market Report: 2019-2033
This comprehensive report provides a detailed analysis of the Manufacturing Analytics market, encompassing market dynamics, growth trends, regional dominance, product landscape, key players, and future outlook. The study period covers 2019-2033, with 2025 as the base and estimated year. The forecast period spans 2025-2033, and the historical period is 2019-2024. The report segments the market by deployment (cloud-based, on-premise), application (inventory management, supply chain optimization, predictive maintenance, other applications), and end-user industry (electronics, oil & gas, automotive, pharmaceutical, food & beverage, other industries). This report is invaluable for industry professionals, investors, and strategic decision-makers seeking a deep understanding of this rapidly evolving market. The total market size in 2025 is estimated at $XX Million.
Manufacturing Analytics Industry Market Dynamics & Structure
The Manufacturing Analytics market is characterized by a moderately concentrated structure, with key players such as SAS Institute Inc, IBM Corp, and SAP SE holding significant market share. The market is driven by technological innovations, particularly in areas like AI, machine learning, and IoT, enabling advanced analytics capabilities. Regulatory frameworks, such as data privacy regulations, influence market dynamics. Competitive substitutes include traditional business intelligence tools, but the advanced analytical capabilities of manufacturing analytics solutions provide a significant competitive advantage. The end-user demographics are shifting towards increased adoption across diverse industries, driven by the need for improved efficiency and productivity. The market has witnessed several M&A activities in recent years, with larger players acquiring smaller specialized firms to expand their capabilities and market reach. The estimated number of M&A deals between 2019 and 2024 is XX.
- Market Concentration: Moderately concentrated, with top 5 players holding approximately XX% market share in 2025.
- Technological Innovation Drivers: AI, Machine Learning, IoT, Big Data analytics.
- Regulatory Frameworks: GDPR, CCPA, and industry-specific regulations impact data handling and security.
- Competitive Product Substitutes: Traditional Business Intelligence (BI) tools.
- End-User Demographics: Growing adoption across various industries, including automotive, electronics, and pharmaceuticals.
- M&A Trends: XX M&A deals between 2019-2024, with a focus on acquiring specialized firms. Projected XX deals between 2025-2033.
Manufacturing Analytics Industry Growth Trends & Insights
The Manufacturing Analytics market experienced significant growth during the historical period (2019-2024), driven by increasing adoption of Industry 4.0 technologies and the need for enhanced operational efficiency. The market size witnessed a CAGR of XX% during this period. The adoption rate of manufacturing analytics solutions is accelerating, particularly in cloud-based deployments. Technological disruptions, such as the rise of edge computing and advancements in AI, are reshaping the landscape. Consumer behavior shifts, driven by a focus on data-driven decision-making and improved productivity, are fueling market growth. The market is expected to continue its growth trajectory, with a projected CAGR of XX% from 2025 to 2033, reaching an estimated size of $XX Million by 2033. Market penetration is expected to increase from XX% in 2025 to XX% in 2033.
Dominant Regions, Countries, or Segments in Manufacturing Analytics Industry
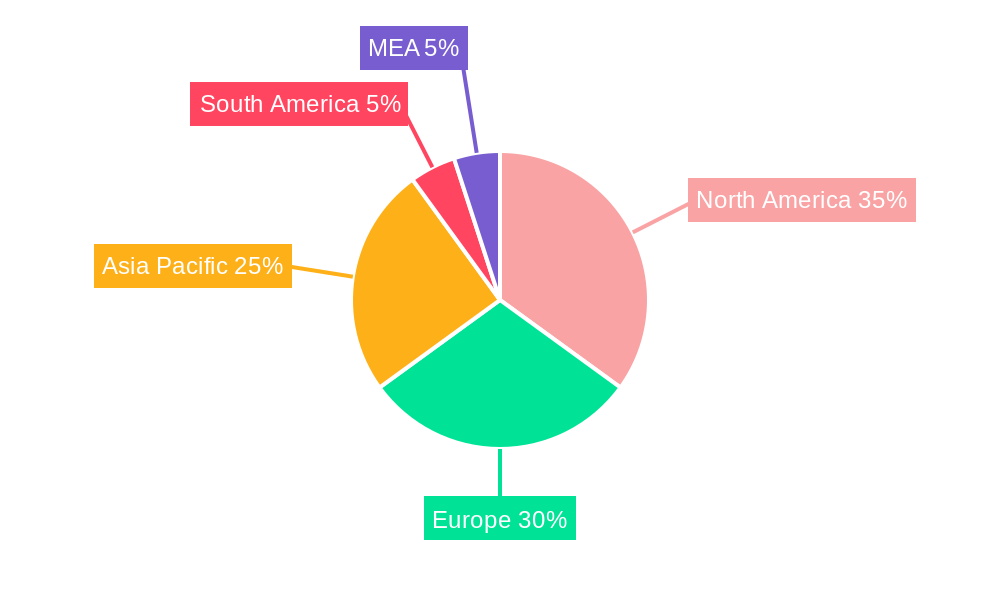
North America currently holds the largest market share in the Manufacturing Analytics industry, driven by early adoption of advanced technologies and a strong presence of major technology vendors. Within North America, the United States dominates due to its well-established manufacturing sector and high technological maturity. However, the Asia-Pacific region is projected to experience the fastest growth rate due to increasing industrialization and government initiatives promoting digital transformation.
By Deployment: Cloud-based deployments are dominating the market, fueled by scalability, cost-effectiveness, and accessibility.
By Application: Supply chain optimization is currently the largest application segment, followed by predictive maintenance. However, inventory management is projected to experience strong growth in the coming years.
By End-user Industry: The automotive and electronics industries are the leading adopters of manufacturing analytics solutions, driven by the need for enhanced quality control and optimized production processes.
- Key Drivers (North America): Strong manufacturing base, high technological maturity, early adoption of Industry 4.0 technologies.
- Key Drivers (Asia-Pacific): Increasing industrialization, government support for digital transformation, cost-effective labor.
- Market Share: North America holds approximately XX% of the market in 2025, while Asia-Pacific is projected to reach XX% by 2033.
Manufacturing Analytics Industry Product Landscape
The Manufacturing Analytics product landscape is characterized by diverse offerings, ranging from cloud-based platforms to on-premise solutions. Products incorporate advanced analytics capabilities, including AI, machine learning, and predictive modeling. Key features include real-time data visualization, advanced reporting, and predictive maintenance capabilities. Unique selling propositions focus on ease of use, scalability, and integration with existing manufacturing systems. Technological advancements continue to enhance product capabilities, enabling more accurate predictions and better decision-making.
Key Drivers, Barriers & Challenges in Manufacturing Analytics Industry
Key Drivers: The increasing adoption of Industry 4.0 technologies, coupled with the need for improved operational efficiency and reduced costs, are key drivers. Government initiatives promoting digital transformation in manufacturing further fuel market growth. The demand for data-driven decision-making and real-time insights is also significantly propelling market expansion.
Key Challenges & Restraints: High implementation costs and the need for skilled workforce are major barriers. Data security concerns and the complexity of integrating different systems also pose significant challenges. The competitive landscape, with numerous vendors offering similar solutions, presents a challenge for market penetration. Supply chain disruptions can impact the delivery and implementation of manufacturing analytics solutions. This can result in project delays and increased costs, impacting market growth.
Emerging Opportunities in Manufacturing Analytics Industry
Emerging opportunities lie in the expansion into untapped markets, particularly in developing economies where manufacturing sectors are rapidly growing. Innovative applications, such as AI-powered quality control and predictive maintenance, offer significant potential. The increasing adoption of edge computing and the development of specialized solutions for specific industry segments are creating new opportunities. Evolving consumer preferences towards sustainable manufacturing processes and responsible data management will drive demand for analytics solutions focused on these areas.
Growth Accelerators in the Manufacturing Analytics Industry
Technological breakthroughs in AI, machine learning, and edge computing are significantly accelerating market growth. Strategic partnerships between technology vendors and manufacturing companies enable seamless integration of analytics solutions. Expansion into new geographical markets and the development of industry-specific solutions further fuel growth. The focus on data-driven decision-making and the increasing demand for operational efficiency will continue to propel the market forward.
Key Players Shaping the Manufacturing Analytics Industry Market
- SAS Institute Inc
- TIBCO Software Inc
- IBM Corp
- QlikTech Inc
- DXC Technology Company
- Wipro Limited
- Northwest Analytics Inc
- Alteryx Inc
- Salesforce com Inc (Tableau Software Inc)
- Oracle Corp
- Sisense Inc
- General Electric Company
- SAP SE
Notable Milestones in Manufacturing Analytics Industry Sector
- 2020: Increased adoption of cloud-based manufacturing analytics solutions due to the pandemic.
- 2021: Several key players launched advanced AI-powered analytics platforms.
- 2022: Significant investments in edge computing technologies for real-time data analysis.
- 2023: Several mergers and acquisitions within the market, consolidating the industry landscape.
- 2024: Growing focus on sustainability and responsible data management in manufacturing analytics.
In-Depth Manufacturing Analytics Industry Market Outlook
The Manufacturing Analytics market is poised for continued robust growth, driven by technological advancements, increasing adoption across industries, and the expanding need for data-driven decision-making. Strategic partnerships and investments in innovation will further accelerate market expansion. The focus on improving operational efficiency, reducing costs, and enhancing product quality will create significant opportunities for market players. The long-term outlook is positive, with substantial potential for market growth and expansion into new applications and geographical regions.
Manufacturing Analytics Industry Segmentation
-
1. Deployment
- 1.1. Cloud-based
- 1.2. On-premise
-
2. Appllication
- 2.1. Inventory Management
- 2.2. Supply Chain Optimization
- 2.3. Predictive Maintenance
- 2.4. Other Applications
-
3. End-user Industry
- 3.1. Electronics
- 3.2. Oil & Gas
- 3.3. Automotive
- 3.4. Pharmaceutical
- 3.5. Food & Beverage
- 3.6. Other End-user Industries
Manufacturing Analytics Industry Segmentation By Geography
- 1. North America
- 2. Europe
- 3. Asia Pacific
- 4. Latin America
- 5. Middle East
Manufacturing Analytics Industry REPORT HIGHLIGHTS
| Aspects | Details |
|---|---|
| Study Period | 2019-2033 |
| Base Year | 2024 |
| Estimated Year | 2025 |
| Forecast Period | 2025-2033 |
| Historical Period | 2019-2024 |
| Growth Rate | CAGR of 24.00% from 2019-2033 |
| Segmentation |
|
Table of Contents
- 1. Introduction
- 1.1. Research Scope
- 1.2. Market Segmentation
- 1.3. Research Methodology
- 1.4. Definitions and Assumptions
- 2. Executive Summary
- 2.1. Introduction
- 3. Market Dynamics
- 3.1. Introduction
- 3.2. Market Drivers
- 3.2.1. ; Adoption of BI and Advanced Data Management Strategies in Manufacturing Applications; Increasing Application of Industry 4.0 Across Various Segments of Manufacturing Industries
- 3.3. Market Restrains
- 3.3.1. ; High Initial Investment in the Transation of IIoT Across Industrial Region
- 3.4. Market Trends
- 3.4.1. Automotive Sector is Expected to Grow at a Significant Rate
- 4. Market Factor Analysis
- 4.1. Porters Five Forces
- 4.2. Supply/Value Chain
- 4.3. PESTEL analysis
- 4.4. Market Entropy
- 4.5. Patent/Trademark Analysis
- 5. Global Manufacturing Analytics Industry Analysis, Insights and Forecast, 2019-2031
- 5.1. Market Analysis, Insights and Forecast - by Deployment
- 5.1.1. Cloud-based
- 5.1.2. On-premise
- 5.2. Market Analysis, Insights and Forecast - by Appllication
- 5.2.1. Inventory Management
- 5.2.2. Supply Chain Optimization
- 5.2.3. Predictive Maintenance
- 5.2.4. Other Applications
- 5.3. Market Analysis, Insights and Forecast - by End-user Industry
- 5.3.1. Electronics
- 5.3.2. Oil & Gas
- 5.3.3. Automotive
- 5.3.4. Pharmaceutical
- 5.3.5. Food & Beverage
- 5.3.6. Other End-user Industries
- 5.4. Market Analysis, Insights and Forecast - by Region
- 5.4.1. North America
- 5.4.2. Europe
- 5.4.3. Asia Pacific
- 5.4.4. Latin America
- 5.4.5. Middle East
- 5.1. Market Analysis, Insights and Forecast - by Deployment
- 6. North America Manufacturing Analytics Industry Analysis, Insights and Forecast, 2019-2031
- 6.1. Market Analysis, Insights and Forecast - by Deployment
- 6.1.1. Cloud-based
- 6.1.2. On-premise
- 6.2. Market Analysis, Insights and Forecast - by Appllication
- 6.2.1. Inventory Management
- 6.2.2. Supply Chain Optimization
- 6.2.3. Predictive Maintenance
- 6.2.4. Other Applications
- 6.3. Market Analysis, Insights and Forecast - by End-user Industry
- 6.3.1. Electronics
- 6.3.2. Oil & Gas
- 6.3.3. Automotive
- 6.3.4. Pharmaceutical
- 6.3.5. Food & Beverage
- 6.3.6. Other End-user Industries
- 6.1. Market Analysis, Insights and Forecast - by Deployment
- 7. Europe Manufacturing Analytics Industry Analysis, Insights and Forecast, 2019-2031
- 7.1. Market Analysis, Insights and Forecast - by Deployment
- 7.1.1. Cloud-based
- 7.1.2. On-premise
- 7.2. Market Analysis, Insights and Forecast - by Appllication
- 7.2.1. Inventory Management
- 7.2.2. Supply Chain Optimization
- 7.2.3. Predictive Maintenance
- 7.2.4. Other Applications
- 7.3. Market Analysis, Insights and Forecast - by End-user Industry
- 7.3.1. Electronics
- 7.3.2. Oil & Gas
- 7.3.3. Automotive
- 7.3.4. Pharmaceutical
- 7.3.5. Food & Beverage
- 7.3.6. Other End-user Industries
- 7.1. Market Analysis, Insights and Forecast - by Deployment
- 8. Asia Pacific Manufacturing Analytics Industry Analysis, Insights and Forecast, 2019-2031
- 8.1. Market Analysis, Insights and Forecast - by Deployment
- 8.1.1. Cloud-based
- 8.1.2. On-premise
- 8.2. Market Analysis, Insights and Forecast - by Appllication
- 8.2.1. Inventory Management
- 8.2.2. Supply Chain Optimization
- 8.2.3. Predictive Maintenance
- 8.2.4. Other Applications
- 8.3. Market Analysis, Insights and Forecast - by End-user Industry
- 8.3.1. Electronics
- 8.3.2. Oil & Gas
- 8.3.3. Automotive
- 8.3.4. Pharmaceutical
- 8.3.5. Food & Beverage
- 8.3.6. Other End-user Industries
- 8.1. Market Analysis, Insights and Forecast - by Deployment
- 9. Latin America Manufacturing Analytics Industry Analysis, Insights and Forecast, 2019-2031
- 9.1. Market Analysis, Insights and Forecast - by Deployment
- 9.1.1. Cloud-based
- 9.1.2. On-premise
- 9.2. Market Analysis, Insights and Forecast - by Appllication
- 9.2.1. Inventory Management
- 9.2.2. Supply Chain Optimization
- 9.2.3. Predictive Maintenance
- 9.2.4. Other Applications
- 9.3. Market Analysis, Insights and Forecast - by End-user Industry
- 9.3.1. Electronics
- 9.3.2. Oil & Gas
- 9.3.3. Automotive
- 9.3.4. Pharmaceutical
- 9.3.5. Food & Beverage
- 9.3.6. Other End-user Industries
- 9.1. Market Analysis, Insights and Forecast - by Deployment
- 10. Middle East Manufacturing Analytics Industry Analysis, Insights and Forecast, 2019-2031
- 10.1. Market Analysis, Insights and Forecast - by Deployment
- 10.1.1. Cloud-based
- 10.1.2. On-premise
- 10.2. Market Analysis, Insights and Forecast - by Appllication
- 10.2.1. Inventory Management
- 10.2.2. Supply Chain Optimization
- 10.2.3. Predictive Maintenance
- 10.2.4. Other Applications
- 10.3. Market Analysis, Insights and Forecast - by End-user Industry
- 10.3.1. Electronics
- 10.3.2. Oil & Gas
- 10.3.3. Automotive
- 10.3.4. Pharmaceutical
- 10.3.5. Food & Beverage
- 10.3.6. Other End-user Industries
- 10.1. Market Analysis, Insights and Forecast - by Deployment
- 11. North America Manufacturing Analytics Industry Analysis, Insights and Forecast, 2019-2031
- 11.1. Market Analysis, Insights and Forecast - By Country/Sub-region
- 11.1.1 United States
- 11.1.2 Canada
- 11.1.3 Mexico
- 12. Europe Manufacturing Analytics Industry Analysis, Insights and Forecast, 2019-2031
- 12.1. Market Analysis, Insights and Forecast - By Country/Sub-region
- 12.1.1 Germany
- 12.1.2 United Kingdom
- 12.1.3 France
- 12.1.4 Spain
- 12.1.5 Italy
- 12.1.6 Spain
- 12.1.7 Belgium
- 12.1.8 Netherland
- 12.1.9 Nordics
- 12.1.10 Rest of Europe
- 13. Asia Pacific Manufacturing Analytics Industry Analysis, Insights and Forecast, 2019-2031
- 13.1. Market Analysis, Insights and Forecast - By Country/Sub-region
- 13.1.1 China
- 13.1.2 Japan
- 13.1.3 India
- 13.1.4 South Korea
- 13.1.5 Southeast Asia
- 13.1.6 Australia
- 13.1.7 Indonesia
- 13.1.8 Phillipes
- 13.1.9 Singapore
- 13.1.10 Thailandc
- 13.1.11 Rest of Asia Pacific
- 14. South America Manufacturing Analytics Industry Analysis, Insights and Forecast, 2019-2031
- 14.1. Market Analysis, Insights and Forecast - By Country/Sub-region
- 14.1.1 Brazil
- 14.1.2 Argentina
- 14.1.3 Peru
- 14.1.4 Chile
- 14.1.5 Colombia
- 14.1.6 Ecuador
- 14.1.7 Venezuela
- 14.1.8 Rest of South America
- 15. North America Manufacturing Analytics Industry Analysis, Insights and Forecast, 2019-2031
- 15.1. Market Analysis, Insights and Forecast - By Country/Sub-region
- 15.1.1 United States
- 15.1.2 Canada
- 15.1.3 Mexico
- 16. MEA Manufacturing Analytics Industry Analysis, Insights and Forecast, 2019-2031
- 16.1. Market Analysis, Insights and Forecast - By Country/Sub-region
- 16.1.1 United Arab Emirates
- 16.1.2 Saudi Arabia
- 16.1.3 South Africa
- 16.1.4 Rest of Middle East and Africa
- 17. Competitive Analysis
- 17.1. Global Market Share Analysis 2024
- 17.2. Company Profiles
- 17.2.1 SAS Institute Inc
- 17.2.1.1. Overview
- 17.2.1.2. Products
- 17.2.1.3. SWOT Analysis
- 17.2.1.4. Recent Developments
- 17.2.1.5. Financials (Based on Availability)
- 17.2.2 TIBCO Software Inc
- 17.2.2.1. Overview
- 17.2.2.2. Products
- 17.2.2.3. SWOT Analysis
- 17.2.2.4. Recent Developments
- 17.2.2.5. Financials (Based on Availability)
- 17.2.3 IBM Corp
- 17.2.3.1. Overview
- 17.2.3.2. Products
- 17.2.3.3. SWOT Analysis
- 17.2.3.4. Recent Developments
- 17.2.3.5. Financials (Based on Availability)
- 17.2.4 QlikTech Inc
- 17.2.4.1. Overview
- 17.2.4.2. Products
- 17.2.4.3. SWOT Analysis
- 17.2.4.4. Recent Developments
- 17.2.4.5. Financials (Based on Availability)
- 17.2.5 DXC Technology Company
- 17.2.5.1. Overview
- 17.2.5.2. Products
- 17.2.5.3. SWOT Analysis
- 17.2.5.4. Recent Developments
- 17.2.5.5. Financials (Based on Availability)
- 17.2.6 Wipro Limited
- 17.2.6.1. Overview
- 17.2.6.2. Products
- 17.2.6.3. SWOT Analysis
- 17.2.6.4. Recent Developments
- 17.2.6.5. Financials (Based on Availability)
- 17.2.7 Northwest Analytics Inc
- 17.2.7.1. Overview
- 17.2.7.2. Products
- 17.2.7.3. SWOT Analysis
- 17.2.7.4. Recent Developments
- 17.2.7.5. Financials (Based on Availability)
- 17.2.8 Alteryx Inc
- 17.2.8.1. Overview
- 17.2.8.2. Products
- 17.2.8.3. SWOT Analysis
- 17.2.8.4. Recent Developments
- 17.2.8.5. Financials (Based on Availability)
- 17.2.9 Salesforce com Inc (Tableau Software Inc )
- 17.2.9.1. Overview
- 17.2.9.2. Products
- 17.2.9.3. SWOT Analysis
- 17.2.9.4. Recent Developments
- 17.2.9.5. Financials (Based on Availability)
- 17.2.10 Oracle Corp
- 17.2.10.1. Overview
- 17.2.10.2. Products
- 17.2.10.3. SWOT Analysis
- 17.2.10.4. Recent Developments
- 17.2.10.5. Financials (Based on Availability)
- 17.2.11 Sisense Inc
- 17.2.11.1. Overview
- 17.2.11.2. Products
- 17.2.11.3. SWOT Analysis
- 17.2.11.4. Recent Developments
- 17.2.11.5. Financials (Based on Availability)
- 17.2.12 General Electric Company
- 17.2.12.1. Overview
- 17.2.12.2. Products
- 17.2.12.3. SWOT Analysis
- 17.2.12.4. Recent Developments
- 17.2.12.5. Financials (Based on Availability)
- 17.2.13 SAP SE
- 17.2.13.1. Overview
- 17.2.13.2. Products
- 17.2.13.3. SWOT Analysis
- 17.2.13.4. Recent Developments
- 17.2.13.5. Financials (Based on Availability)
- 17.2.1 SAS Institute Inc
List of Figures
- Figure 1: Global Manufacturing Analytics Industry Revenue Breakdown (Million, %) by Region 2024 & 2032
- Figure 2: Global Manufacturing Analytics Industry Volume Breakdown (K Unit, %) by Region 2024 & 2032
- Figure 3: North America Manufacturing Analytics Industry Revenue (Million), by Country 2024 & 2032
- Figure 4: North America Manufacturing Analytics Industry Volume (K Unit), by Country 2024 & 2032
- Figure 5: North America Manufacturing Analytics Industry Revenue Share (%), by Country 2024 & 2032
- Figure 6: North America Manufacturing Analytics Industry Volume Share (%), by Country 2024 & 2032
- Figure 7: Europe Manufacturing Analytics Industry Revenue (Million), by Country 2024 & 2032
- Figure 8: Europe Manufacturing Analytics Industry Volume (K Unit), by Country 2024 & 2032
- Figure 9: Europe Manufacturing Analytics Industry Revenue Share (%), by Country 2024 & 2032
- Figure 10: Europe Manufacturing Analytics Industry Volume Share (%), by Country 2024 & 2032
- Figure 11: Asia Pacific Manufacturing Analytics Industry Revenue (Million), by Country 2024 & 2032
- Figure 12: Asia Pacific Manufacturing Analytics Industry Volume (K Unit), by Country 2024 & 2032
- Figure 13: Asia Pacific Manufacturing Analytics Industry Revenue Share (%), by Country 2024 & 2032
- Figure 14: Asia Pacific Manufacturing Analytics Industry Volume Share (%), by Country 2024 & 2032
- Figure 15: South America Manufacturing Analytics Industry Revenue (Million), by Country 2024 & 2032
- Figure 16: South America Manufacturing Analytics Industry Volume (K Unit), by Country 2024 & 2032
- Figure 17: South America Manufacturing Analytics Industry Revenue Share (%), by Country 2024 & 2032
- Figure 18: South America Manufacturing Analytics Industry Volume Share (%), by Country 2024 & 2032
- Figure 19: North America Manufacturing Analytics Industry Revenue (Million), by Country 2024 & 2032
- Figure 20: North America Manufacturing Analytics Industry Volume (K Unit), by Country 2024 & 2032
- Figure 21: North America Manufacturing Analytics Industry Revenue Share (%), by Country 2024 & 2032
- Figure 22: North America Manufacturing Analytics Industry Volume Share (%), by Country 2024 & 2032
- Figure 23: MEA Manufacturing Analytics Industry Revenue (Million), by Country 2024 & 2032
- Figure 24: MEA Manufacturing Analytics Industry Volume (K Unit), by Country 2024 & 2032
- Figure 25: MEA Manufacturing Analytics Industry Revenue Share (%), by Country 2024 & 2032
- Figure 26: MEA Manufacturing Analytics Industry Volume Share (%), by Country 2024 & 2032
- Figure 27: North America Manufacturing Analytics Industry Revenue (Million), by Deployment 2024 & 2032
- Figure 28: North America Manufacturing Analytics Industry Volume (K Unit), by Deployment 2024 & 2032
- Figure 29: North America Manufacturing Analytics Industry Revenue Share (%), by Deployment 2024 & 2032
- Figure 30: North America Manufacturing Analytics Industry Volume Share (%), by Deployment 2024 & 2032
- Figure 31: North America Manufacturing Analytics Industry Revenue (Million), by Appllication 2024 & 2032
- Figure 32: North America Manufacturing Analytics Industry Volume (K Unit), by Appllication 2024 & 2032
- Figure 33: North America Manufacturing Analytics Industry Revenue Share (%), by Appllication 2024 & 2032
- Figure 34: North America Manufacturing Analytics Industry Volume Share (%), by Appllication 2024 & 2032
- Figure 35: North America Manufacturing Analytics Industry Revenue (Million), by End-user Industry 2024 & 2032
- Figure 36: North America Manufacturing Analytics Industry Volume (K Unit), by End-user Industry 2024 & 2032
- Figure 37: North America Manufacturing Analytics Industry Revenue Share (%), by End-user Industry 2024 & 2032
- Figure 38: North America Manufacturing Analytics Industry Volume Share (%), by End-user Industry 2024 & 2032
- Figure 39: North America Manufacturing Analytics Industry Revenue (Million), by Country 2024 & 2032
- Figure 40: North America Manufacturing Analytics Industry Volume (K Unit), by Country 2024 & 2032
- Figure 41: North America Manufacturing Analytics Industry Revenue Share (%), by Country 2024 & 2032
- Figure 42: North America Manufacturing Analytics Industry Volume Share (%), by Country 2024 & 2032
- Figure 43: Europe Manufacturing Analytics Industry Revenue (Million), by Deployment 2024 & 2032
- Figure 44: Europe Manufacturing Analytics Industry Volume (K Unit), by Deployment 2024 & 2032
- Figure 45: Europe Manufacturing Analytics Industry Revenue Share (%), by Deployment 2024 & 2032
- Figure 46: Europe Manufacturing Analytics Industry Volume Share (%), by Deployment 2024 & 2032
- Figure 47: Europe Manufacturing Analytics Industry Revenue (Million), by Appllication 2024 & 2032
- Figure 48: Europe Manufacturing Analytics Industry Volume (K Unit), by Appllication 2024 & 2032
- Figure 49: Europe Manufacturing Analytics Industry Revenue Share (%), by Appllication 2024 & 2032
- Figure 50: Europe Manufacturing Analytics Industry Volume Share (%), by Appllication 2024 & 2032
- Figure 51: Europe Manufacturing Analytics Industry Revenue (Million), by End-user Industry 2024 & 2032
- Figure 52: Europe Manufacturing Analytics Industry Volume (K Unit), by End-user Industry 2024 & 2032
- Figure 53: Europe Manufacturing Analytics Industry Revenue Share (%), by End-user Industry 2024 & 2032
- Figure 54: Europe Manufacturing Analytics Industry Volume Share (%), by End-user Industry 2024 & 2032
- Figure 55: Europe Manufacturing Analytics Industry Revenue (Million), by Country 2024 & 2032
- Figure 56: Europe Manufacturing Analytics Industry Volume (K Unit), by Country 2024 & 2032
- Figure 57: Europe Manufacturing Analytics Industry Revenue Share (%), by Country 2024 & 2032
- Figure 58: Europe Manufacturing Analytics Industry Volume Share (%), by Country 2024 & 2032
- Figure 59: Asia Pacific Manufacturing Analytics Industry Revenue (Million), by Deployment 2024 & 2032
- Figure 60: Asia Pacific Manufacturing Analytics Industry Volume (K Unit), by Deployment 2024 & 2032
- Figure 61: Asia Pacific Manufacturing Analytics Industry Revenue Share (%), by Deployment 2024 & 2032
- Figure 62: Asia Pacific Manufacturing Analytics Industry Volume Share (%), by Deployment 2024 & 2032
- Figure 63: Asia Pacific Manufacturing Analytics Industry Revenue (Million), by Appllication 2024 & 2032
- Figure 64: Asia Pacific Manufacturing Analytics Industry Volume (K Unit), by Appllication 2024 & 2032
- Figure 65: Asia Pacific Manufacturing Analytics Industry Revenue Share (%), by Appllication 2024 & 2032
- Figure 66: Asia Pacific Manufacturing Analytics Industry Volume Share (%), by Appllication 2024 & 2032
- Figure 67: Asia Pacific Manufacturing Analytics Industry Revenue (Million), by End-user Industry 2024 & 2032
- Figure 68: Asia Pacific Manufacturing Analytics Industry Volume (K Unit), by End-user Industry 2024 & 2032
- Figure 69: Asia Pacific Manufacturing Analytics Industry Revenue Share (%), by End-user Industry 2024 & 2032
- Figure 70: Asia Pacific Manufacturing Analytics Industry Volume Share (%), by End-user Industry 2024 & 2032
- Figure 71: Asia Pacific Manufacturing Analytics Industry Revenue (Million), by Country 2024 & 2032
- Figure 72: Asia Pacific Manufacturing Analytics Industry Volume (K Unit), by Country 2024 & 2032
- Figure 73: Asia Pacific Manufacturing Analytics Industry Revenue Share (%), by Country 2024 & 2032
- Figure 74: Asia Pacific Manufacturing Analytics Industry Volume Share (%), by Country 2024 & 2032
- Figure 75: Latin America Manufacturing Analytics Industry Revenue (Million), by Deployment 2024 & 2032
- Figure 76: Latin America Manufacturing Analytics Industry Volume (K Unit), by Deployment 2024 & 2032
- Figure 77: Latin America Manufacturing Analytics Industry Revenue Share (%), by Deployment 2024 & 2032
- Figure 78: Latin America Manufacturing Analytics Industry Volume Share (%), by Deployment 2024 & 2032
- Figure 79: Latin America Manufacturing Analytics Industry Revenue (Million), by Appllication 2024 & 2032
- Figure 80: Latin America Manufacturing Analytics Industry Volume (K Unit), by Appllication 2024 & 2032
- Figure 81: Latin America Manufacturing Analytics Industry Revenue Share (%), by Appllication 2024 & 2032
- Figure 82: Latin America Manufacturing Analytics Industry Volume Share (%), by Appllication 2024 & 2032
- Figure 83: Latin America Manufacturing Analytics Industry Revenue (Million), by End-user Industry 2024 & 2032
- Figure 84: Latin America Manufacturing Analytics Industry Volume (K Unit), by End-user Industry 2024 & 2032
- Figure 85: Latin America Manufacturing Analytics Industry Revenue Share (%), by End-user Industry 2024 & 2032
- Figure 86: Latin America Manufacturing Analytics Industry Volume Share (%), by End-user Industry 2024 & 2032
- Figure 87: Latin America Manufacturing Analytics Industry Revenue (Million), by Country 2024 & 2032
- Figure 88: Latin America Manufacturing Analytics Industry Volume (K Unit), by Country 2024 & 2032
- Figure 89: Latin America Manufacturing Analytics Industry Revenue Share (%), by Country 2024 & 2032
- Figure 90: Latin America Manufacturing Analytics Industry Volume Share (%), by Country 2024 & 2032
- Figure 91: Middle East Manufacturing Analytics Industry Revenue (Million), by Deployment 2024 & 2032
- Figure 92: Middle East Manufacturing Analytics Industry Volume (K Unit), by Deployment 2024 & 2032
- Figure 93: Middle East Manufacturing Analytics Industry Revenue Share (%), by Deployment 2024 & 2032
- Figure 94: Middle East Manufacturing Analytics Industry Volume Share (%), by Deployment 2024 & 2032
- Figure 95: Middle East Manufacturing Analytics Industry Revenue (Million), by Appllication 2024 & 2032
- Figure 96: Middle East Manufacturing Analytics Industry Volume (K Unit), by Appllication 2024 & 2032
- Figure 97: Middle East Manufacturing Analytics Industry Revenue Share (%), by Appllication 2024 & 2032
- Figure 98: Middle East Manufacturing Analytics Industry Volume Share (%), by Appllication 2024 & 2032
- Figure 99: Middle East Manufacturing Analytics Industry Revenue (Million), by End-user Industry 2024 & 2032
- Figure 100: Middle East Manufacturing Analytics Industry Volume (K Unit), by End-user Industry 2024 & 2032
- Figure 101: Middle East Manufacturing Analytics Industry Revenue Share (%), by End-user Industry 2024 & 2032
- Figure 102: Middle East Manufacturing Analytics Industry Volume Share (%), by End-user Industry 2024 & 2032
- Figure 103: Middle East Manufacturing Analytics Industry Revenue (Million), by Country 2024 & 2032
- Figure 104: Middle East Manufacturing Analytics Industry Volume (K Unit), by Country 2024 & 2032
- Figure 105: Middle East Manufacturing Analytics Industry Revenue Share (%), by Country 2024 & 2032
- Figure 106: Middle East Manufacturing Analytics Industry Volume Share (%), by Country 2024 & 2032
List of Tables
- Table 1: Global Manufacturing Analytics Industry Revenue Million Forecast, by Region 2019 & 2032
- Table 2: Global Manufacturing Analytics Industry Volume K Unit Forecast, by Region 2019 & 2032
- Table 3: Global Manufacturing Analytics Industry Revenue Million Forecast, by Deployment 2019 & 2032
- Table 4: Global Manufacturing Analytics Industry Volume K Unit Forecast, by Deployment 2019 & 2032
- Table 5: Global Manufacturing Analytics Industry Revenue Million Forecast, by Appllication 2019 & 2032
- Table 6: Global Manufacturing Analytics Industry Volume K Unit Forecast, by Appllication 2019 & 2032
- Table 7: Global Manufacturing Analytics Industry Revenue Million Forecast, by End-user Industry 2019 & 2032
- Table 8: Global Manufacturing Analytics Industry Volume K Unit Forecast, by End-user Industry 2019 & 2032
- Table 9: Global Manufacturing Analytics Industry Revenue Million Forecast, by Region 2019 & 2032
- Table 10: Global Manufacturing Analytics Industry Volume K Unit Forecast, by Region 2019 & 2032
- Table 11: Global Manufacturing Analytics Industry Revenue Million Forecast, by Country 2019 & 2032
- Table 12: Global Manufacturing Analytics Industry Volume K Unit Forecast, by Country 2019 & 2032
- Table 13: United States Manufacturing Analytics Industry Revenue (Million) Forecast, by Application 2019 & 2032
- Table 14: United States Manufacturing Analytics Industry Volume (K Unit) Forecast, by Application 2019 & 2032
- Table 15: Canada Manufacturing Analytics Industry Revenue (Million) Forecast, by Application 2019 & 2032
- Table 16: Canada Manufacturing Analytics Industry Volume (K Unit) Forecast, by Application 2019 & 2032
- Table 17: Mexico Manufacturing Analytics Industry Revenue (Million) Forecast, by Application 2019 & 2032
- Table 18: Mexico Manufacturing Analytics Industry Volume (K Unit) Forecast, by Application 2019 & 2032
- Table 19: Global Manufacturing Analytics Industry Revenue Million Forecast, by Country 2019 & 2032
- Table 20: Global Manufacturing Analytics Industry Volume K Unit Forecast, by Country 2019 & 2032
- Table 21: Germany Manufacturing Analytics Industry Revenue (Million) Forecast, by Application 2019 & 2032
- Table 22: Germany Manufacturing Analytics Industry Volume (K Unit) Forecast, by Application 2019 & 2032
- Table 23: United Kingdom Manufacturing Analytics Industry Revenue (Million) Forecast, by Application 2019 & 2032
- Table 24: United Kingdom Manufacturing Analytics Industry Volume (K Unit) Forecast, by Application 2019 & 2032
- Table 25: France Manufacturing Analytics Industry Revenue (Million) Forecast, by Application 2019 & 2032
- Table 26: France Manufacturing Analytics Industry Volume (K Unit) Forecast, by Application 2019 & 2032
- Table 27: Spain Manufacturing Analytics Industry Revenue (Million) Forecast, by Application 2019 & 2032
- Table 28: Spain Manufacturing Analytics Industry Volume (K Unit) Forecast, by Application 2019 & 2032
- Table 29: Italy Manufacturing Analytics Industry Revenue (Million) Forecast, by Application 2019 & 2032
- Table 30: Italy Manufacturing Analytics Industry Volume (K Unit) Forecast, by Application 2019 & 2032
- Table 31: Spain Manufacturing Analytics Industry Revenue (Million) Forecast, by Application 2019 & 2032
- Table 32: Spain Manufacturing Analytics Industry Volume (K Unit) Forecast, by Application 2019 & 2032
- Table 33: Belgium Manufacturing Analytics Industry Revenue (Million) Forecast, by Application 2019 & 2032
- Table 34: Belgium Manufacturing Analytics Industry Volume (K Unit) Forecast, by Application 2019 & 2032
- Table 35: Netherland Manufacturing Analytics Industry Revenue (Million) Forecast, by Application 2019 & 2032
- Table 36: Netherland Manufacturing Analytics Industry Volume (K Unit) Forecast, by Application 2019 & 2032
- Table 37: Nordics Manufacturing Analytics Industry Revenue (Million) Forecast, by Application 2019 & 2032
- Table 38: Nordics Manufacturing Analytics Industry Volume (K Unit) Forecast, by Application 2019 & 2032
- Table 39: Rest of Europe Manufacturing Analytics Industry Revenue (Million) Forecast, by Application 2019 & 2032
- Table 40: Rest of Europe Manufacturing Analytics Industry Volume (K Unit) Forecast, by Application 2019 & 2032
- Table 41: Global Manufacturing Analytics Industry Revenue Million Forecast, by Country 2019 & 2032
- Table 42: Global Manufacturing Analytics Industry Volume K Unit Forecast, by Country 2019 & 2032
- Table 43: China Manufacturing Analytics Industry Revenue (Million) Forecast, by Application 2019 & 2032
- Table 44: China Manufacturing Analytics Industry Volume (K Unit) Forecast, by Application 2019 & 2032
- Table 45: Japan Manufacturing Analytics Industry Revenue (Million) Forecast, by Application 2019 & 2032
- Table 46: Japan Manufacturing Analytics Industry Volume (K Unit) Forecast, by Application 2019 & 2032
- Table 47: India Manufacturing Analytics Industry Revenue (Million) Forecast, by Application 2019 & 2032
- Table 48: India Manufacturing Analytics Industry Volume (K Unit) Forecast, by Application 2019 & 2032
- Table 49: South Korea Manufacturing Analytics Industry Revenue (Million) Forecast, by Application 2019 & 2032
- Table 50: South Korea Manufacturing Analytics Industry Volume (K Unit) Forecast, by Application 2019 & 2032
- Table 51: Southeast Asia Manufacturing Analytics Industry Revenue (Million) Forecast, by Application 2019 & 2032
- Table 52: Southeast Asia Manufacturing Analytics Industry Volume (K Unit) Forecast, by Application 2019 & 2032
- Table 53: Australia Manufacturing Analytics Industry Revenue (Million) Forecast, by Application 2019 & 2032
- Table 54: Australia Manufacturing Analytics Industry Volume (K Unit) Forecast, by Application 2019 & 2032
- Table 55: Indonesia Manufacturing Analytics Industry Revenue (Million) Forecast, by Application 2019 & 2032
- Table 56: Indonesia Manufacturing Analytics Industry Volume (K Unit) Forecast, by Application 2019 & 2032
- Table 57: Phillipes Manufacturing Analytics Industry Revenue (Million) Forecast, by Application 2019 & 2032
- Table 58: Phillipes Manufacturing Analytics Industry Volume (K Unit) Forecast, by Application 2019 & 2032
- Table 59: Singapore Manufacturing Analytics Industry Revenue (Million) Forecast, by Application 2019 & 2032
- Table 60: Singapore Manufacturing Analytics Industry Volume (K Unit) Forecast, by Application 2019 & 2032
- Table 61: Thailandc Manufacturing Analytics Industry Revenue (Million) Forecast, by Application 2019 & 2032
- Table 62: Thailandc Manufacturing Analytics Industry Volume (K Unit) Forecast, by Application 2019 & 2032
- Table 63: Rest of Asia Pacific Manufacturing Analytics Industry Revenue (Million) Forecast, by Application 2019 & 2032
- Table 64: Rest of Asia Pacific Manufacturing Analytics Industry Volume (K Unit) Forecast, by Application 2019 & 2032
- Table 65: Global Manufacturing Analytics Industry Revenue Million Forecast, by Country 2019 & 2032
- Table 66: Global Manufacturing Analytics Industry Volume K Unit Forecast, by Country 2019 & 2032
- Table 67: Brazil Manufacturing Analytics Industry Revenue (Million) Forecast, by Application 2019 & 2032
- Table 68: Brazil Manufacturing Analytics Industry Volume (K Unit) Forecast, by Application 2019 & 2032
- Table 69: Argentina Manufacturing Analytics Industry Revenue (Million) Forecast, by Application 2019 & 2032
- Table 70: Argentina Manufacturing Analytics Industry Volume (K Unit) Forecast, by Application 2019 & 2032
- Table 71: Peru Manufacturing Analytics Industry Revenue (Million) Forecast, by Application 2019 & 2032
- Table 72: Peru Manufacturing Analytics Industry Volume (K Unit) Forecast, by Application 2019 & 2032
- Table 73: Chile Manufacturing Analytics Industry Revenue (Million) Forecast, by Application 2019 & 2032
- Table 74: Chile Manufacturing Analytics Industry Volume (K Unit) Forecast, by Application 2019 & 2032
- Table 75: Colombia Manufacturing Analytics Industry Revenue (Million) Forecast, by Application 2019 & 2032
- Table 76: Colombia Manufacturing Analytics Industry Volume (K Unit) Forecast, by Application 2019 & 2032
- Table 77: Ecuador Manufacturing Analytics Industry Revenue (Million) Forecast, by Application 2019 & 2032
- Table 78: Ecuador Manufacturing Analytics Industry Volume (K Unit) Forecast, by Application 2019 & 2032
- Table 79: Venezuela Manufacturing Analytics Industry Revenue (Million) Forecast, by Application 2019 & 2032
- Table 80: Venezuela Manufacturing Analytics Industry Volume (K Unit) Forecast, by Application 2019 & 2032
- Table 81: Rest of South America Manufacturing Analytics Industry Revenue (Million) Forecast, by Application 2019 & 2032
- Table 82: Rest of South America Manufacturing Analytics Industry Volume (K Unit) Forecast, by Application 2019 & 2032
- Table 83: Global Manufacturing Analytics Industry Revenue Million Forecast, by Country 2019 & 2032
- Table 84: Global Manufacturing Analytics Industry Volume K Unit Forecast, by Country 2019 & 2032
- Table 85: United States Manufacturing Analytics Industry Revenue (Million) Forecast, by Application 2019 & 2032
- Table 86: United States Manufacturing Analytics Industry Volume (K Unit) Forecast, by Application 2019 & 2032
- Table 87: Canada Manufacturing Analytics Industry Revenue (Million) Forecast, by Application 2019 & 2032
- Table 88: Canada Manufacturing Analytics Industry Volume (K Unit) Forecast, by Application 2019 & 2032
- Table 89: Mexico Manufacturing Analytics Industry Revenue (Million) Forecast, by Application 2019 & 2032
- Table 90: Mexico Manufacturing Analytics Industry Volume (K Unit) Forecast, by Application 2019 & 2032
- Table 91: Global Manufacturing Analytics Industry Revenue Million Forecast, by Country 2019 & 2032
- Table 92: Global Manufacturing Analytics Industry Volume K Unit Forecast, by Country 2019 & 2032
- Table 93: United Arab Emirates Manufacturing Analytics Industry Revenue (Million) Forecast, by Application 2019 & 2032
- Table 94: United Arab Emirates Manufacturing Analytics Industry Volume (K Unit) Forecast, by Application 2019 & 2032
- Table 95: Saudi Arabia Manufacturing Analytics Industry Revenue (Million) Forecast, by Application 2019 & 2032
- Table 96: Saudi Arabia Manufacturing Analytics Industry Volume (K Unit) Forecast, by Application 2019 & 2032
- Table 97: South Africa Manufacturing Analytics Industry Revenue (Million) Forecast, by Application 2019 & 2032
- Table 98: South Africa Manufacturing Analytics Industry Volume (K Unit) Forecast, by Application 2019 & 2032
- Table 99: Rest of Middle East and Africa Manufacturing Analytics Industry Revenue (Million) Forecast, by Application 2019 & 2032
- Table 100: Rest of Middle East and Africa Manufacturing Analytics Industry Volume (K Unit) Forecast, by Application 2019 & 2032
- Table 101: Global Manufacturing Analytics Industry Revenue Million Forecast, by Deployment 2019 & 2032
- Table 102: Global Manufacturing Analytics Industry Volume K Unit Forecast, by Deployment 2019 & 2032
- Table 103: Global Manufacturing Analytics Industry Revenue Million Forecast, by Appllication 2019 & 2032
- Table 104: Global Manufacturing Analytics Industry Volume K Unit Forecast, by Appllication 2019 & 2032
- Table 105: Global Manufacturing Analytics Industry Revenue Million Forecast, by End-user Industry 2019 & 2032
- Table 106: Global Manufacturing Analytics Industry Volume K Unit Forecast, by End-user Industry 2019 & 2032
- Table 107: Global Manufacturing Analytics Industry Revenue Million Forecast, by Country 2019 & 2032
- Table 108: Global Manufacturing Analytics Industry Volume K Unit Forecast, by Country 2019 & 2032
- Table 109: Global Manufacturing Analytics Industry Revenue Million Forecast, by Deployment 2019 & 2032
- Table 110: Global Manufacturing Analytics Industry Volume K Unit Forecast, by Deployment 2019 & 2032
- Table 111: Global Manufacturing Analytics Industry Revenue Million Forecast, by Appllication 2019 & 2032
- Table 112: Global Manufacturing Analytics Industry Volume K Unit Forecast, by Appllication 2019 & 2032
- Table 113: Global Manufacturing Analytics Industry Revenue Million Forecast, by End-user Industry 2019 & 2032
- Table 114: Global Manufacturing Analytics Industry Volume K Unit Forecast, by End-user Industry 2019 & 2032
- Table 115: Global Manufacturing Analytics Industry Revenue Million Forecast, by Country 2019 & 2032
- Table 116: Global Manufacturing Analytics Industry Volume K Unit Forecast, by Country 2019 & 2032
- Table 117: Global Manufacturing Analytics Industry Revenue Million Forecast, by Deployment 2019 & 2032
- Table 118: Global Manufacturing Analytics Industry Volume K Unit Forecast, by Deployment 2019 & 2032
- Table 119: Global Manufacturing Analytics Industry Revenue Million Forecast, by Appllication 2019 & 2032
- Table 120: Global Manufacturing Analytics Industry Volume K Unit Forecast, by Appllication 2019 & 2032
- Table 121: Global Manufacturing Analytics Industry Revenue Million Forecast, by End-user Industry 2019 & 2032
- Table 122: Global Manufacturing Analytics Industry Volume K Unit Forecast, by End-user Industry 2019 & 2032
- Table 123: Global Manufacturing Analytics Industry Revenue Million Forecast, by Country 2019 & 2032
- Table 124: Global Manufacturing Analytics Industry Volume K Unit Forecast, by Country 2019 & 2032
- Table 125: Global Manufacturing Analytics Industry Revenue Million Forecast, by Deployment 2019 & 2032
- Table 126: Global Manufacturing Analytics Industry Volume K Unit Forecast, by Deployment 2019 & 2032
- Table 127: Global Manufacturing Analytics Industry Revenue Million Forecast, by Appllication 2019 & 2032
- Table 128: Global Manufacturing Analytics Industry Volume K Unit Forecast, by Appllication 2019 & 2032
- Table 129: Global Manufacturing Analytics Industry Revenue Million Forecast, by End-user Industry 2019 & 2032
- Table 130: Global Manufacturing Analytics Industry Volume K Unit Forecast, by End-user Industry 2019 & 2032
- Table 131: Global Manufacturing Analytics Industry Revenue Million Forecast, by Country 2019 & 2032
- Table 132: Global Manufacturing Analytics Industry Volume K Unit Forecast, by Country 2019 & 2032
- Table 133: Global Manufacturing Analytics Industry Revenue Million Forecast, by Deployment 2019 & 2032
- Table 134: Global Manufacturing Analytics Industry Volume K Unit Forecast, by Deployment 2019 & 2032
- Table 135: Global Manufacturing Analytics Industry Revenue Million Forecast, by Appllication 2019 & 2032
- Table 136: Global Manufacturing Analytics Industry Volume K Unit Forecast, by Appllication 2019 & 2032
- Table 137: Global Manufacturing Analytics Industry Revenue Million Forecast, by End-user Industry 2019 & 2032
- Table 138: Global Manufacturing Analytics Industry Volume K Unit Forecast, by End-user Industry 2019 & 2032
- Table 139: Global Manufacturing Analytics Industry Revenue Million Forecast, by Country 2019 & 2032
- Table 140: Global Manufacturing Analytics Industry Volume K Unit Forecast, by Country 2019 & 2032
Frequently Asked Questions
1. What is the projected Compound Annual Growth Rate (CAGR) of the Manufacturing Analytics Industry?
The projected CAGR is approximately 24.00%.
2. Which companies are prominent players in the Manufacturing Analytics Industry?
Key companies in the market include SAS Institute Inc, TIBCO Software Inc, IBM Corp, QlikTech Inc, DXC Technology Company, Wipro Limited, Northwest Analytics Inc, Alteryx Inc, Salesforce com Inc (Tableau Software Inc ), Oracle Corp, Sisense Inc, General Electric Company, SAP SE.
3. What are the main segments of the Manufacturing Analytics Industry?
The market segments include Deployment, Appllication, End-user Industry.
4. Can you provide details about the market size?
The market size is estimated to be USD XX Million as of 2022.
5. What are some drivers contributing to market growth?
; Adoption of BI and Advanced Data Management Strategies in Manufacturing Applications; Increasing Application of Industry 4.0 Across Various Segments of Manufacturing Industries.
6. What are the notable trends driving market growth?
Automotive Sector is Expected to Grow at a Significant Rate.
7. Are there any restraints impacting market growth?
; High Initial Investment in the Transation of IIoT Across Industrial Region.
8. Can you provide examples of recent developments in the market?
N/A
9. What pricing options are available for accessing the report?
Pricing options include single-user, multi-user, and enterprise licenses priced at USD 4750, USD 5250, and USD 8750 respectively.
10. Is the market size provided in terms of value or volume?
The market size is provided in terms of value, measured in Million and volume, measured in K Unit.
11. Are there any specific market keywords associated with the report?
Yes, the market keyword associated with the report is "Manufacturing Analytics Industry," which aids in identifying and referencing the specific market segment covered.
12. How do I determine which pricing option suits my needs best?
The pricing options vary based on user requirements and access needs. Individual users may opt for single-user licenses, while businesses requiring broader access may choose multi-user or enterprise licenses for cost-effective access to the report.
13. Are there any additional resources or data provided in the Manufacturing Analytics Industry report?
While the report offers comprehensive insights, it's advisable to review the specific contents or supplementary materials provided to ascertain if additional resources or data are available.
14. How can I stay updated on further developments or reports in the Manufacturing Analytics Industry?
To stay informed about further developments, trends, and reports in the Manufacturing Analytics Industry, consider subscribing to industry newsletters, following relevant companies and organizations, or regularly checking reputable industry news sources and publications.
Methodology
Step 1 - Identification of Relevant Samples Size from Population Database


Step 2 - Approaches for Defining Global Market Size (Value, Volume* & Price*)

Note*: In applicable scenarios
Step 3 - Data Sources
Primary Research
- Web Analytics
- Survey Reports
- Research Institute
- Latest Research Reports
- Opinion Leaders
Secondary Research
- Annual Reports
- White Paper
- Latest Press Release
- Industry Association
- Paid Database
- Investor Presentations

Step 4 - Data Triangulation
Involves using different sources of information in order to increase the validity of a study
These sources are likely to be stakeholders in a program - participants, other researchers, program staff, other community members, and so on.
Then we put all data in single framework & apply various statistical tools to find out the dynamic on the market.
During the analysis stage, feedback from the stakeholder groups would be compared to determine areas of agreement as well as areas of divergence


