
Key Insights
The global manganese market, valued at $24.4 billion in 2025, is projected to experience robust growth, driven by a 5% compound annual growth rate (CAGR) from 2025 to 2033. This expansion is fueled by several key factors. The burgeoning electric vehicle (EV) sector significantly boosts demand for manganese in battery production, particularly for cathode materials like lithium-ion batteries. Furthermore, the increasing use of manganese in steelmaking, as an alloying agent to enhance strength and durability, contributes substantially to market growth. Construction and infrastructure development also contribute to demand, with manganese utilized in various building materials and cement production. While fluctuating raw material prices and geopolitical uncertainties pose potential restraints, technological advancements in manganese extraction and processing are expected to mitigate these challenges. The market is segmented by type (high, medium, and low carbon ferromanganese, silico-manganese, electrolyte manganese metal, and electrolyte manganese dioxide), application (coloring, oxidizing, alloying, polarizers, and others), and end-use sector (industrial, construction, power storage and electricity, and others). Key players like BHP, Tata Steel, Vale, and others are strategically positioning themselves to capitalize on this growth trajectory through investments in capacity expansion, research and development, and strategic partnerships.
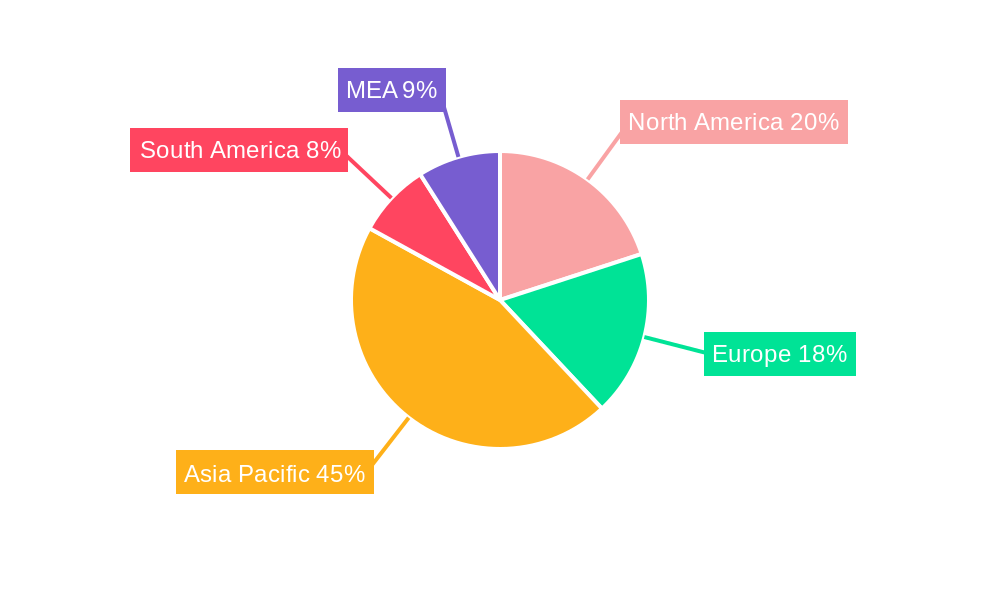
The regional landscape shows a diverse distribution of market share. Asia-Pacific, particularly China and India, are expected to dominate the market owing to their robust industrial growth and substantial steel production. North America and Europe also hold significant market shares driven by advanced manufacturing sectors and increasing EV adoption. South America and MEA regions present emerging opportunities as their economies develop and infrastructure projects increase. The forecast period (2025-2033) anticipates sustained growth, with market share fluctuations driven by regional economic development, government policies supporting green technologies, and fluctuations in global commodity prices. The market will continue to see innovation in manganese-based materials, pushing its application further into various sectors.

Manganese Market: A Comprehensive Report (2019-2033)
This comprehensive report provides an in-depth analysis of the global manganese market, encompassing market dynamics, growth trends, regional analysis, and key player profiles. The study period covers 2019-2033, with 2025 as the base year and forecast period extending to 2033. The report segments the market by type (High Carbon Ferromanganese, Medium Carbon Ferromanganese, Low Carbon Ferromanganese, Silico-Manganese, Electrolyte Manganese Metal, Electrolyte Manganese Dioxide), application (Coloring Agent, Oxidizing Agent, Alloying Additive, Polarizer, Others), and end-use sector (Industrial, Construction, Power Storage and Electricity, Other End-use Sectors). The market is projected to reach xx Billion by 2033, exhibiting a CAGR of xx% during the forecast period. This detailed analysis is crucial for industry professionals, investors, and strategic decision-makers seeking to navigate the evolving landscape of the manganese market.
Manganese Market Dynamics & Structure
The global manganese market is characterized by moderate concentration, with key players like BHP, Vale, and Tata Steel holding significant market share. Technological advancements in extraction and processing methods, alongside increasing demand from the booming electric vehicle (EV) battery sector, are key growth drivers. Stringent environmental regulations, particularly regarding emissions from manganese production, pose a challenge. The market witnesses frequent M&A activity, reflecting consolidation trends and strategic expansion strategies. Substitute materials, like other alloying elements, present competitive pressure. Demand is heavily influenced by construction activity and industrial production levels, making the market sensitive to economic cycles.
- Market Concentration: Moderately concentrated, with top 5 players holding approximately xx% market share in 2024.
- Technological Innovation: Focus on improving extraction efficiency, reducing environmental impact, and developing specialized manganese products for specific applications.
- Regulatory Framework: Stringent environmental regulations impacting production processes and waste management.
- Competitive Substitutes: Other alloying metals and materials, posing competitive pressure.
- End-User Demographics: Heavily influenced by industrial and construction sectors; growing demand from the power storage sector.
- M&A Trends: Significant M&A activity in recent years, driven by expansion, consolidation, and access to resources. An estimated xx billion USD worth of deals were closed between 2019 and 2024.
Manganese Market Growth Trends & Insights
The manganese market experienced steady growth during the historical period (2019-2024), driven primarily by robust demand from steel production and industrial applications. The market size reached xx Billion in 2024. The increasing adoption of manganese in EV batteries and renewable energy storage systems is projected to accelerate market growth in the forecast period (2025-2033). Technological advancements in manganese extraction and processing are expected to enhance efficiency and sustainability. Shifting consumer preferences towards environmentally friendly products and materials will indirectly influence demand.
- Market Size Evolution: From xx Billion in 2019 to xx Billion in 2024; projected to reach xx Billion by 2033.
- Adoption Rates: High adoption in traditional steelmaking applications; rapidly increasing adoption in the EV battery sector.
- Technological Disruptions: Advancements in extraction and processing, leading to improved efficiency and cost reduction.
- Consumer Behavior Shifts: Growing preference for sustainable and eco-friendly materials impacting demand.

Dominant Regions, Countries, or Segments in Manganese Market
The Asia-Pacific region is the dominant market for manganese, driven by strong demand from China and India, particularly in steel production and construction activities. Within the segment breakdown, High Carbon Ferromanganese holds the largest market share due to its extensive use in steelmaking. The increasing adoption of manganese in the power storage and electricity sector is driving growth in developed economies.
- Key Drivers (Asia-Pacific): Rapid industrialization, robust infrastructure development, and high steel production.
- Key Drivers (Developed Economies): Growing demand for electric vehicles and renewable energy storage solutions.
- Dominant Segment (By Type): High Carbon Ferromanganese due to its widespread use in steel production.
- Dominant Segment (By Application): Alloying Additive due to its crucial role in steelmaking.
- Dominant Segment (By End-use Sector): Industrial sector, driven by steel and construction activities.
Manganese Market Product Landscape
The manganese market offers a range of products tailored to diverse applications. High-purity manganese products are gaining traction for specialized applications like EV batteries, demanding stringent quality standards. Continuous advancements in production technology are leading to higher efficiency and lower environmental impact. Unique selling propositions emphasize purity, consistency, and tailored specifications for different industries.
Key Drivers, Barriers & Challenges in Manganese Market
Key Drivers:
- Increasing demand from the steel industry.
- Growing adoption in the EV battery sector.
- Expansion of infrastructure projects globally.
Challenges:
- Price volatility of raw materials.
- Environmental concerns related to mining and processing.
- Competition from substitute materials. The impact of these factors is estimated to reduce the market CAGR by approximately xx% in the next 5 years.
Emerging Opportunities in Manganese Market
- Expansion into new applications, like water treatment and agriculture.
- Development of sustainable mining and processing techniques.
- Growing demand for high-purity manganese in specialized applications.
Growth Accelerators in the Manganese Market Industry
Technological breakthroughs in extraction and processing, coupled with strategic partnerships and market expansion into emerging economies, are significant growth catalysts. The focus on sustainability and environmentally friendly production methods is attracting investments and driving innovation in the sector.
Key Players Shaping the Manganese Market Market
- BHP
- MOIL LIMITED
- Tata Steel
- Vale
- Carus Group Inc
- Jupiter Mines Limited
- Sibelco
- Mesa Minerals Limited
- NIPPON DENKO CO LTD
- Ningxia Tianyuan Manganese Industry Group Co Ltd
- Eramet
- Anglo American PLC
- Assore Limited (Assmang Proprietary Limited)
Notable Milestones in Manganese Market Sector
- August 2020: South32 Ltd. sold its stake in TEMCO to GFG Alliance, signifying consolidation in the manganese alloy smelting sector.
In-Depth Manganese Market Market Outlook
The manganese market is poised for significant growth, driven by the increasing demand from the EV battery sector and the broader renewable energy transition. Strategic investments in research and development, coupled with sustainable mining practices, will play a crucial role in shaping the future of this vital market. The long-term outlook remains positive, with substantial opportunities for innovation and expansion.
Manganese Market Segmentation
-
1. Application
- 1.1. Alloys
- 1.2. Electrolytic Manganese Dioxide
- 1.3. Electrolytic Manganese Metals
- 1.4. Other Applications
-
2. End-use Sector
- 2.1. Industrial
- 2.2. Construction
- 2.3. Power Storage and Electricity
- 2.4. Other End-use Sectors
Manganese Market Segmentation By Geography
-
1. Asia Pacific
- 1.1. China
- 1.2. India
- 1.3. Japan
- 1.4. South Korea
- 1.5. Rest of Asia Pacific
-
2. North America
- 2.1. United States
- 2.2. Canada
- 2.3. Mexico
-
3. Europe
- 3.1. Germany
- 3.2. United Kingdom
- 3.3. Italy
- 3.4. France
- 3.5. Rest of Europe
-
4. South America
- 4.1. Brazil
- 4.2. Argentina
- 4.3. Rest of South America
-
5. Middle East and Africa
- 5.1. Saudi Arabia
- 5.2. South Africa
- 5.3. Rest of Middle East and Africa
Manganese Market REPORT HIGHLIGHTS
| Aspects | Details |
|---|---|
| Study Period | 2019-2033 |
| Base Year | 2024 |
| Estimated Year | 2025 |
| Forecast Period | 2025-2033 |
| Historical Period | 2019-2024 |
| Growth Rate | CAGR of 5% from 2019-2033 |
| Segmentation |
|
Table of Contents
- 1. Introduction
- 1.1. Research Scope
- 1.2. Market Segmentation
- 1.3. Research Methodology
- 1.4. Definitions and Assumptions
- 2. Executive Summary
- 2.1. Introduction
- 3. Market Dynamics
- 3.1. Introduction
- 3.2. Market Drivers
- 3.2.1. Increasing Demand of Electric Vehicles; Other Drivers
- 3.3. Market Restrains
- 3.3.1. Other Restraints
- 3.4. Market Trends
- 3.4.1. Increasing Demand from Construction Sector
- 4. Market Factor Analysis
- 4.1. Porters Five Forces
- 4.2. Supply/Value Chain
- 4.3. PESTEL analysis
- 4.4. Market Entropy
- 4.5. Patent/Trademark Analysis
- 5. Global Manganese Market Analysis, Insights and Forecast, 2019-2031
- 5.1. Market Analysis, Insights and Forecast - by Application
- 5.1.1. Alloys
- 5.1.2. Electrolytic Manganese Dioxide
- 5.1.3. Electrolytic Manganese Metals
- 5.1.4. Other Applications
- 5.2. Market Analysis, Insights and Forecast - by End-use Sector
- 5.2.1. Industrial
- 5.2.2. Construction
- 5.2.3. Power Storage and Electricity
- 5.2.4. Other End-use Sectors
- 5.3. Market Analysis, Insights and Forecast - by Region
- 5.3.1. Asia Pacific
- 5.3.2. North America
- 5.3.3. Europe
- 5.3.4. South America
- 5.3.5. Middle East and Africa
- 5.1. Market Analysis, Insights and Forecast - by Application
- 6. Asia Pacific Manganese Market Analysis, Insights and Forecast, 2019-2031
- 6.1. Market Analysis, Insights and Forecast - by Application
- 6.1.1. Alloys
- 6.1.2. Electrolytic Manganese Dioxide
- 6.1.3. Electrolytic Manganese Metals
- 6.1.4. Other Applications
- 6.2. Market Analysis, Insights and Forecast - by End-use Sector
- 6.2.1. Industrial
- 6.2.2. Construction
- 6.2.3. Power Storage and Electricity
- 6.2.4. Other End-use Sectors
- 6.1. Market Analysis, Insights and Forecast - by Application
- 7. North America Manganese Market Analysis, Insights and Forecast, 2019-2031
- 7.1. Market Analysis, Insights and Forecast - by Application
- 7.1.1. Alloys
- 7.1.2. Electrolytic Manganese Dioxide
- 7.1.3. Electrolytic Manganese Metals
- 7.1.4. Other Applications
- 7.2. Market Analysis, Insights and Forecast - by End-use Sector
- 7.2.1. Industrial
- 7.2.2. Construction
- 7.2.3. Power Storage and Electricity
- 7.2.4. Other End-use Sectors
- 7.1. Market Analysis, Insights and Forecast - by Application
- 8. Europe Manganese Market Analysis, Insights and Forecast, 2019-2031
- 8.1. Market Analysis, Insights and Forecast - by Application
- 8.1.1. Alloys
- 8.1.2. Electrolytic Manganese Dioxide
- 8.1.3. Electrolytic Manganese Metals
- 8.1.4. Other Applications
- 8.2. Market Analysis, Insights and Forecast - by End-use Sector
- 8.2.1. Industrial
- 8.2.2. Construction
- 8.2.3. Power Storage and Electricity
- 8.2.4. Other End-use Sectors
- 8.1. Market Analysis, Insights and Forecast - by Application
- 9. South America Manganese Market Analysis, Insights and Forecast, 2019-2031
- 9.1. Market Analysis, Insights and Forecast - by Application
- 9.1.1. Alloys
- 9.1.2. Electrolytic Manganese Dioxide
- 9.1.3. Electrolytic Manganese Metals
- 9.1.4. Other Applications
- 9.2. Market Analysis, Insights and Forecast - by End-use Sector
- 9.2.1. Industrial
- 9.2.2. Construction
- 9.2.3. Power Storage and Electricity
- 9.2.4. Other End-use Sectors
- 9.1. Market Analysis, Insights and Forecast - by Application
- 10. Middle East and Africa Manganese Market Analysis, Insights and Forecast, 2019-2031
- 10.1. Market Analysis, Insights and Forecast - by Application
- 10.1.1. Alloys
- 10.1.2. Electrolytic Manganese Dioxide
- 10.1.3. Electrolytic Manganese Metals
- 10.1.4. Other Applications
- 10.2. Market Analysis, Insights and Forecast - by End-use Sector
- 10.2.1. Industrial
- 10.2.2. Construction
- 10.2.3. Power Storage and Electricity
- 10.2.4. Other End-use Sectors
- 10.1. Market Analysis, Insights and Forecast - by Application
- 11. North America Manganese Market Analysis, Insights and Forecast, 2019-2031
- 11.1. Market Analysis, Insights and Forecast - By Country/Sub-region
- 11.1.1 United States
- 11.1.2 Canada
- 11.1.3 Mexico
- 12. Europe Manganese Market Analysis, Insights and Forecast, 2019-2031
- 12.1. Market Analysis, Insights and Forecast - By Country/Sub-region
- 12.1.1 Germany
- 12.1.2 France
- 12.1.3 Italy
- 12.1.4 United Kingdom
- 12.1.5 Netherlands
- 12.1.6 Rest of Europe
- 13. Asia Pacific Manganese Market Analysis, Insights and Forecast, 2019-2031
- 13.1. Market Analysis, Insights and Forecast - By Country/Sub-region
- 13.1.1 China
- 13.1.2 Japan
- 13.1.3 India
- 13.1.4 South Korea
- 13.1.5 Taiwan
- 13.1.6 Australia
- 13.1.7 Rest of Asia-Pacific
- 14. South America Manganese Market Analysis, Insights and Forecast, 2019-2031
- 14.1. Market Analysis, Insights and Forecast - By Country/Sub-region
- 14.1.1 Brazil
- 14.1.2 Argentina
- 14.1.3 Rest of South America
- 15. MEA Manganese Market Analysis, Insights and Forecast, 2019-2031
- 15.1. Market Analysis, Insights and Forecast - By Country/Sub-region
- 15.1.1 Middle East
- 15.1.2 Africa
- 16. Competitive Analysis
- 16.1. Global Market Share Analysis 2024
- 16.2. Company Profiles
- 16.2.1 BHP
- 16.2.1.1. Overview
- 16.2.1.2. Products
- 16.2.1.3. SWOT Analysis
- 16.2.1.4. Recent Developments
- 16.2.1.5. Financials (Based on Availability)
- 16.2.2 MOIL LIMITED
- 16.2.2.1. Overview
- 16.2.2.2. Products
- 16.2.2.3. SWOT Analysis
- 16.2.2.4. Recent Developments
- 16.2.2.5. Financials (Based on Availability)
- 16.2.3 Tata Steel
- 16.2.3.1. Overview
- 16.2.3.2. Products
- 16.2.3.3. SWOT Analysis
- 16.2.3.4. Recent Developments
- 16.2.3.5. Financials (Based on Availability)
- 16.2.4 Vale
- 16.2.4.1. Overview
- 16.2.4.2. Products
- 16.2.4.3. SWOT Analysis
- 16.2.4.4. Recent Developments
- 16.2.4.5. Financials (Based on Availability)
- 16.2.5 Carus Group Inc
- 16.2.5.1. Overview
- 16.2.5.2. Products
- 16.2.5.3. SWOT Analysis
- 16.2.5.4. Recent Developments
- 16.2.5.5. Financials (Based on Availability)
- 16.2.6 Jupiter Mines Limited
- 16.2.6.1. Overview
- 16.2.6.2. Products
- 16.2.6.3. SWOT Analysis
- 16.2.6.4. Recent Developments
- 16.2.6.5. Financials (Based on Availability)
- 16.2.7 Sibelco
- 16.2.7.1. Overview
- 16.2.7.2. Products
- 16.2.7.3. SWOT Analysis
- 16.2.7.4. Recent Developments
- 16.2.7.5. Financials (Based on Availability)
- 16.2.8 Mesa Minerals Limited
- 16.2.8.1. Overview
- 16.2.8.2. Products
- 16.2.8.3. SWOT Analysis
- 16.2.8.4. Recent Developments
- 16.2.8.5. Financials (Based on Availability)
- 16.2.9 NIPPON DENKO CO LTD
- 16.2.9.1. Overview
- 16.2.9.2. Products
- 16.2.9.3. SWOT Analysis
- 16.2.9.4. Recent Developments
- 16.2.9.5. Financials (Based on Availability)
- 16.2.10 Ningxia Tianyuan Manganese Industry Group Co Ltd
- 16.2.10.1. Overview
- 16.2.10.2. Products
- 16.2.10.3. SWOT Analysis
- 16.2.10.4. Recent Developments
- 16.2.10.5. Financials (Based on Availability)
- 16.2.11 Eramet
- 16.2.11.1. Overview
- 16.2.11.2. Products
- 16.2.11.3. SWOT Analysis
- 16.2.11.4. Recent Developments
- 16.2.11.5. Financials (Based on Availability)
- 16.2.12 Anglo American PLC
- 16.2.12.1. Overview
- 16.2.12.2. Products
- 16.2.12.3. SWOT Analysis
- 16.2.12.4. Recent Developments
- 16.2.12.5. Financials (Based on Availability)
- 16.2.13 Assore Limited (Assmang Proprietary Limited)
- 16.2.13.1. Overview
- 16.2.13.2. Products
- 16.2.13.3. SWOT Analysis
- 16.2.13.4. Recent Developments
- 16.2.13.5. Financials (Based on Availability)
- 16.2.1 BHP
List of Figures
- Figure 1: Global Manganese Market Revenue Breakdown (Billion, %) by Region 2024 & 2032
- Figure 2: Global Manganese Market Volume Breakdown (K Tons, %) by Region 2024 & 2032
- Figure 3: North America Manganese Market Revenue (Billion), by Country 2024 & 2032
- Figure 4: North America Manganese Market Volume (K Tons), by Country 2024 & 2032
- Figure 5: North America Manganese Market Revenue Share (%), by Country 2024 & 2032
- Figure 6: North America Manganese Market Volume Share (%), by Country 2024 & 2032
- Figure 7: Europe Manganese Market Revenue (Billion), by Country 2024 & 2032
- Figure 8: Europe Manganese Market Volume (K Tons), by Country 2024 & 2032
- Figure 9: Europe Manganese Market Revenue Share (%), by Country 2024 & 2032
- Figure 10: Europe Manganese Market Volume Share (%), by Country 2024 & 2032
- Figure 11: Asia Pacific Manganese Market Revenue (Billion), by Country 2024 & 2032
- Figure 12: Asia Pacific Manganese Market Volume (K Tons), by Country 2024 & 2032
- Figure 13: Asia Pacific Manganese Market Revenue Share (%), by Country 2024 & 2032
- Figure 14: Asia Pacific Manganese Market Volume Share (%), by Country 2024 & 2032
- Figure 15: South America Manganese Market Revenue (Billion), by Country 2024 & 2032
- Figure 16: South America Manganese Market Volume (K Tons), by Country 2024 & 2032
- Figure 17: South America Manganese Market Revenue Share (%), by Country 2024 & 2032
- Figure 18: South America Manganese Market Volume Share (%), by Country 2024 & 2032
- Figure 19: MEA Manganese Market Revenue (Billion), by Country 2024 & 2032
- Figure 20: MEA Manganese Market Volume (K Tons), by Country 2024 & 2032
- Figure 21: MEA Manganese Market Revenue Share (%), by Country 2024 & 2032
- Figure 22: MEA Manganese Market Volume Share (%), by Country 2024 & 2032
- Figure 23: Asia Pacific Manganese Market Revenue (Billion), by Application 2024 & 2032
- Figure 24: Asia Pacific Manganese Market Volume (K Tons), by Application 2024 & 2032
- Figure 25: Asia Pacific Manganese Market Revenue Share (%), by Application 2024 & 2032
- Figure 26: Asia Pacific Manganese Market Volume Share (%), by Application 2024 & 2032
- Figure 27: Asia Pacific Manganese Market Revenue (Billion), by End-use Sector 2024 & 2032
- Figure 28: Asia Pacific Manganese Market Volume (K Tons), by End-use Sector 2024 & 2032
- Figure 29: Asia Pacific Manganese Market Revenue Share (%), by End-use Sector 2024 & 2032
- Figure 30: Asia Pacific Manganese Market Volume Share (%), by End-use Sector 2024 & 2032
- Figure 31: Asia Pacific Manganese Market Revenue (Billion), by Country 2024 & 2032
- Figure 32: Asia Pacific Manganese Market Volume (K Tons), by Country 2024 & 2032
- Figure 33: Asia Pacific Manganese Market Revenue Share (%), by Country 2024 & 2032
- Figure 34: Asia Pacific Manganese Market Volume Share (%), by Country 2024 & 2032
- Figure 35: North America Manganese Market Revenue (Billion), by Application 2024 & 2032
- Figure 36: North America Manganese Market Volume (K Tons), by Application 2024 & 2032
- Figure 37: North America Manganese Market Revenue Share (%), by Application 2024 & 2032
- Figure 38: North America Manganese Market Volume Share (%), by Application 2024 & 2032
- Figure 39: North America Manganese Market Revenue (Billion), by End-use Sector 2024 & 2032
- Figure 40: North America Manganese Market Volume (K Tons), by End-use Sector 2024 & 2032
- Figure 41: North America Manganese Market Revenue Share (%), by End-use Sector 2024 & 2032
- Figure 42: North America Manganese Market Volume Share (%), by End-use Sector 2024 & 2032
- Figure 43: North America Manganese Market Revenue (Billion), by Country 2024 & 2032
- Figure 44: North America Manganese Market Volume (K Tons), by Country 2024 & 2032
- Figure 45: North America Manganese Market Revenue Share (%), by Country 2024 & 2032
- Figure 46: North America Manganese Market Volume Share (%), by Country 2024 & 2032
- Figure 47: Europe Manganese Market Revenue (Billion), by Application 2024 & 2032
- Figure 48: Europe Manganese Market Volume (K Tons), by Application 2024 & 2032
- Figure 49: Europe Manganese Market Revenue Share (%), by Application 2024 & 2032
- Figure 50: Europe Manganese Market Volume Share (%), by Application 2024 & 2032
- Figure 51: Europe Manganese Market Revenue (Billion), by End-use Sector 2024 & 2032
- Figure 52: Europe Manganese Market Volume (K Tons), by End-use Sector 2024 & 2032
- Figure 53: Europe Manganese Market Revenue Share (%), by End-use Sector 2024 & 2032
- Figure 54: Europe Manganese Market Volume Share (%), by End-use Sector 2024 & 2032
- Figure 55: Europe Manganese Market Revenue (Billion), by Country 2024 & 2032
- Figure 56: Europe Manganese Market Volume (K Tons), by Country 2024 & 2032
- Figure 57: Europe Manganese Market Revenue Share (%), by Country 2024 & 2032
- Figure 58: Europe Manganese Market Volume Share (%), by Country 2024 & 2032
- Figure 59: South America Manganese Market Revenue (Billion), by Application 2024 & 2032
- Figure 60: South America Manganese Market Volume (K Tons), by Application 2024 & 2032
- Figure 61: South America Manganese Market Revenue Share (%), by Application 2024 & 2032
- Figure 62: South America Manganese Market Volume Share (%), by Application 2024 & 2032
- Figure 63: South America Manganese Market Revenue (Billion), by End-use Sector 2024 & 2032
- Figure 64: South America Manganese Market Volume (K Tons), by End-use Sector 2024 & 2032
- Figure 65: South America Manganese Market Revenue Share (%), by End-use Sector 2024 & 2032
- Figure 66: South America Manganese Market Volume Share (%), by End-use Sector 2024 & 2032
- Figure 67: South America Manganese Market Revenue (Billion), by Country 2024 & 2032
- Figure 68: South America Manganese Market Volume (K Tons), by Country 2024 & 2032
- Figure 69: South America Manganese Market Revenue Share (%), by Country 2024 & 2032
- Figure 70: South America Manganese Market Volume Share (%), by Country 2024 & 2032
- Figure 71: Middle East and Africa Manganese Market Revenue (Billion), by Application 2024 & 2032
- Figure 72: Middle East and Africa Manganese Market Volume (K Tons), by Application 2024 & 2032
- Figure 73: Middle East and Africa Manganese Market Revenue Share (%), by Application 2024 & 2032
- Figure 74: Middle East and Africa Manganese Market Volume Share (%), by Application 2024 & 2032
- Figure 75: Middle East and Africa Manganese Market Revenue (Billion), by End-use Sector 2024 & 2032
- Figure 76: Middle East and Africa Manganese Market Volume (K Tons), by End-use Sector 2024 & 2032
- Figure 77: Middle East and Africa Manganese Market Revenue Share (%), by End-use Sector 2024 & 2032
- Figure 78: Middle East and Africa Manganese Market Volume Share (%), by End-use Sector 2024 & 2032
- Figure 79: Middle East and Africa Manganese Market Revenue (Billion), by Country 2024 & 2032
- Figure 80: Middle East and Africa Manganese Market Volume (K Tons), by Country 2024 & 2032
- Figure 81: Middle East and Africa Manganese Market Revenue Share (%), by Country 2024 & 2032
- Figure 82: Middle East and Africa Manganese Market Volume Share (%), by Country 2024 & 2032
List of Tables
- Table 1: Global Manganese Market Revenue Billion Forecast, by Region 2019 & 2032
- Table 2: Global Manganese Market Volume K Tons Forecast, by Region 2019 & 2032
- Table 3: Global Manganese Market Revenue Billion Forecast, by Application 2019 & 2032
- Table 4: Global Manganese Market Volume K Tons Forecast, by Application 2019 & 2032
- Table 5: Global Manganese Market Revenue Billion Forecast, by End-use Sector 2019 & 2032
- Table 6: Global Manganese Market Volume K Tons Forecast, by End-use Sector 2019 & 2032
- Table 7: Global Manganese Market Revenue Billion Forecast, by Region 2019 & 2032
- Table 8: Global Manganese Market Volume K Tons Forecast, by Region 2019 & 2032
- Table 9: Global Manganese Market Revenue Billion Forecast, by Country 2019 & 2032
- Table 10: Global Manganese Market Volume K Tons Forecast, by Country 2019 & 2032
- Table 11: United States Manganese Market Revenue (Billion) Forecast, by Application 2019 & 2032
- Table 12: United States Manganese Market Volume (K Tons) Forecast, by Application 2019 & 2032
- Table 13: Canada Manganese Market Revenue (Billion) Forecast, by Application 2019 & 2032
- Table 14: Canada Manganese Market Volume (K Tons) Forecast, by Application 2019 & 2032
- Table 15: Mexico Manganese Market Revenue (Billion) Forecast, by Application 2019 & 2032
- Table 16: Mexico Manganese Market Volume (K Tons) Forecast, by Application 2019 & 2032
- Table 17: Global Manganese Market Revenue Billion Forecast, by Country 2019 & 2032
- Table 18: Global Manganese Market Volume K Tons Forecast, by Country 2019 & 2032
- Table 19: Germany Manganese Market Revenue (Billion) Forecast, by Application 2019 & 2032
- Table 20: Germany Manganese Market Volume (K Tons) Forecast, by Application 2019 & 2032
- Table 21: France Manganese Market Revenue (Billion) Forecast, by Application 2019 & 2032
- Table 22: France Manganese Market Volume (K Tons) Forecast, by Application 2019 & 2032
- Table 23: Italy Manganese Market Revenue (Billion) Forecast, by Application 2019 & 2032
- Table 24: Italy Manganese Market Volume (K Tons) Forecast, by Application 2019 & 2032
- Table 25: United Kingdom Manganese Market Revenue (Billion) Forecast, by Application 2019 & 2032
- Table 26: United Kingdom Manganese Market Volume (K Tons) Forecast, by Application 2019 & 2032
- Table 27: Netherlands Manganese Market Revenue (Billion) Forecast, by Application 2019 & 2032
- Table 28: Netherlands Manganese Market Volume (K Tons) Forecast, by Application 2019 & 2032
- Table 29: Rest of Europe Manganese Market Revenue (Billion) Forecast, by Application 2019 & 2032
- Table 30: Rest of Europe Manganese Market Volume (K Tons) Forecast, by Application 2019 & 2032
- Table 31: Global Manganese Market Revenue Billion Forecast, by Country 2019 & 2032
- Table 32: Global Manganese Market Volume K Tons Forecast, by Country 2019 & 2032
- Table 33: China Manganese Market Revenue (Billion) Forecast, by Application 2019 & 2032
- Table 34: China Manganese Market Volume (K Tons) Forecast, by Application 2019 & 2032
- Table 35: Japan Manganese Market Revenue (Billion) Forecast, by Application 2019 & 2032
- Table 36: Japan Manganese Market Volume (K Tons) Forecast, by Application 2019 & 2032
- Table 37: India Manganese Market Revenue (Billion) Forecast, by Application 2019 & 2032
- Table 38: India Manganese Market Volume (K Tons) Forecast, by Application 2019 & 2032
- Table 39: South Korea Manganese Market Revenue (Billion) Forecast, by Application 2019 & 2032
- Table 40: South Korea Manganese Market Volume (K Tons) Forecast, by Application 2019 & 2032
- Table 41: Taiwan Manganese Market Revenue (Billion) Forecast, by Application 2019 & 2032
- Table 42: Taiwan Manganese Market Volume (K Tons) Forecast, by Application 2019 & 2032
- Table 43: Australia Manganese Market Revenue (Billion) Forecast, by Application 2019 & 2032
- Table 44: Australia Manganese Market Volume (K Tons) Forecast, by Application 2019 & 2032
- Table 45: Rest of Asia-Pacific Manganese Market Revenue (Billion) Forecast, by Application 2019 & 2032
- Table 46: Rest of Asia-Pacific Manganese Market Volume (K Tons) Forecast, by Application 2019 & 2032
- Table 47: Global Manganese Market Revenue Billion Forecast, by Country 2019 & 2032
- Table 48: Global Manganese Market Volume K Tons Forecast, by Country 2019 & 2032
- Table 49: Brazil Manganese Market Revenue (Billion) Forecast, by Application 2019 & 2032
- Table 50: Brazil Manganese Market Volume (K Tons) Forecast, by Application 2019 & 2032
- Table 51: Argentina Manganese Market Revenue (Billion) Forecast, by Application 2019 & 2032
- Table 52: Argentina Manganese Market Volume (K Tons) Forecast, by Application 2019 & 2032
- Table 53: Rest of South America Manganese Market Revenue (Billion) Forecast, by Application 2019 & 2032
- Table 54: Rest of South America Manganese Market Volume (K Tons) Forecast, by Application 2019 & 2032
- Table 55: Global Manganese Market Revenue Billion Forecast, by Country 2019 & 2032
- Table 56: Global Manganese Market Volume K Tons Forecast, by Country 2019 & 2032
- Table 57: Middle East Manganese Market Revenue (Billion) Forecast, by Application 2019 & 2032
- Table 58: Middle East Manganese Market Volume (K Tons) Forecast, by Application 2019 & 2032
- Table 59: Africa Manganese Market Revenue (Billion) Forecast, by Application 2019 & 2032
- Table 60: Africa Manganese Market Volume (K Tons) Forecast, by Application 2019 & 2032
- Table 61: Global Manganese Market Revenue Billion Forecast, by Application 2019 & 2032
- Table 62: Global Manganese Market Volume K Tons Forecast, by Application 2019 & 2032
- Table 63: Global Manganese Market Revenue Billion Forecast, by End-use Sector 2019 & 2032
- Table 64: Global Manganese Market Volume K Tons Forecast, by End-use Sector 2019 & 2032
- Table 65: Global Manganese Market Revenue Billion Forecast, by Country 2019 & 2032
- Table 66: Global Manganese Market Volume K Tons Forecast, by Country 2019 & 2032
- Table 67: China Manganese Market Revenue (Billion) Forecast, by Application 2019 & 2032
- Table 68: China Manganese Market Volume (K Tons) Forecast, by Application 2019 & 2032
- Table 69: India Manganese Market Revenue (Billion) Forecast, by Application 2019 & 2032
- Table 70: India Manganese Market Volume (K Tons) Forecast, by Application 2019 & 2032
- Table 71: Japan Manganese Market Revenue (Billion) Forecast, by Application 2019 & 2032
- Table 72: Japan Manganese Market Volume (K Tons) Forecast, by Application 2019 & 2032
- Table 73: South Korea Manganese Market Revenue (Billion) Forecast, by Application 2019 & 2032
- Table 74: South Korea Manganese Market Volume (K Tons) Forecast, by Application 2019 & 2032
- Table 75: Rest of Asia Pacific Manganese Market Revenue (Billion) Forecast, by Application 2019 & 2032
- Table 76: Rest of Asia Pacific Manganese Market Volume (K Tons) Forecast, by Application 2019 & 2032
- Table 77: Global Manganese Market Revenue Billion Forecast, by Application 2019 & 2032
- Table 78: Global Manganese Market Volume K Tons Forecast, by Application 2019 & 2032
- Table 79: Global Manganese Market Revenue Billion Forecast, by End-use Sector 2019 & 2032
- Table 80: Global Manganese Market Volume K Tons Forecast, by End-use Sector 2019 & 2032
- Table 81: Global Manganese Market Revenue Billion Forecast, by Country 2019 & 2032
- Table 82: Global Manganese Market Volume K Tons Forecast, by Country 2019 & 2032
- Table 83: United States Manganese Market Revenue (Billion) Forecast, by Application 2019 & 2032
- Table 84: United States Manganese Market Volume (K Tons) Forecast, by Application 2019 & 2032
- Table 85: Canada Manganese Market Revenue (Billion) Forecast, by Application 2019 & 2032
- Table 86: Canada Manganese Market Volume (K Tons) Forecast, by Application 2019 & 2032
- Table 87: Mexico Manganese Market Revenue (Billion) Forecast, by Application 2019 & 2032
- Table 88: Mexico Manganese Market Volume (K Tons) Forecast, by Application 2019 & 2032
- Table 89: Global Manganese Market Revenue Billion Forecast, by Application 2019 & 2032
- Table 90: Global Manganese Market Volume K Tons Forecast, by Application 2019 & 2032
- Table 91: Global Manganese Market Revenue Billion Forecast, by End-use Sector 2019 & 2032
- Table 92: Global Manganese Market Volume K Tons Forecast, by End-use Sector 2019 & 2032
- Table 93: Global Manganese Market Revenue Billion Forecast, by Country 2019 & 2032
- Table 94: Global Manganese Market Volume K Tons Forecast, by Country 2019 & 2032
- Table 95: Germany Manganese Market Revenue (Billion) Forecast, by Application 2019 & 2032
- Table 96: Germany Manganese Market Volume (K Tons) Forecast, by Application 2019 & 2032
- Table 97: United Kingdom Manganese Market Revenue (Billion) Forecast, by Application 2019 & 2032
- Table 98: United Kingdom Manganese Market Volume (K Tons) Forecast, by Application 2019 & 2032
- Table 99: Italy Manganese Market Revenue (Billion) Forecast, by Application 2019 & 2032
- Table 100: Italy Manganese Market Volume (K Tons) Forecast, by Application 2019 & 2032
- Table 101: France Manganese Market Revenue (Billion) Forecast, by Application 2019 & 2032
- Table 102: France Manganese Market Volume (K Tons) Forecast, by Application 2019 & 2032
- Table 103: Rest of Europe Manganese Market Revenue (Billion) Forecast, by Application 2019 & 2032
- Table 104: Rest of Europe Manganese Market Volume (K Tons) Forecast, by Application 2019 & 2032
- Table 105: Global Manganese Market Revenue Billion Forecast, by Application 2019 & 2032
- Table 106: Global Manganese Market Volume K Tons Forecast, by Application 2019 & 2032
- Table 107: Global Manganese Market Revenue Billion Forecast, by End-use Sector 2019 & 2032
- Table 108: Global Manganese Market Volume K Tons Forecast, by End-use Sector 2019 & 2032
- Table 109: Global Manganese Market Revenue Billion Forecast, by Country 2019 & 2032
- Table 110: Global Manganese Market Volume K Tons Forecast, by Country 2019 & 2032
- Table 111: Brazil Manganese Market Revenue (Billion) Forecast, by Application 2019 & 2032
- Table 112: Brazil Manganese Market Volume (K Tons) Forecast, by Application 2019 & 2032
- Table 113: Argentina Manganese Market Revenue (Billion) Forecast, by Application 2019 & 2032
- Table 114: Argentina Manganese Market Volume (K Tons) Forecast, by Application 2019 & 2032
- Table 115: Rest of South America Manganese Market Revenue (Billion) Forecast, by Application 2019 & 2032
- Table 116: Rest of South America Manganese Market Volume (K Tons) Forecast, by Application 2019 & 2032
- Table 117: Global Manganese Market Revenue Billion Forecast, by Application 2019 & 2032
- Table 118: Global Manganese Market Volume K Tons Forecast, by Application 2019 & 2032
- Table 119: Global Manganese Market Revenue Billion Forecast, by End-use Sector 2019 & 2032
- Table 120: Global Manganese Market Volume K Tons Forecast, by End-use Sector 2019 & 2032
- Table 121: Global Manganese Market Revenue Billion Forecast, by Country 2019 & 2032
- Table 122: Global Manganese Market Volume K Tons Forecast, by Country 2019 & 2032
- Table 123: Saudi Arabia Manganese Market Revenue (Billion) Forecast, by Application 2019 & 2032
- Table 124: Saudi Arabia Manganese Market Volume (K Tons) Forecast, by Application 2019 & 2032
- Table 125: South Africa Manganese Market Revenue (Billion) Forecast, by Application 2019 & 2032
- Table 126: South Africa Manganese Market Volume (K Tons) Forecast, by Application 2019 & 2032
- Table 127: Rest of Middle East and Africa Manganese Market Revenue (Billion) Forecast, by Application 2019 & 2032
- Table 128: Rest of Middle East and Africa Manganese Market Volume (K Tons) Forecast, by Application 2019 & 2032
Frequently Asked Questions
1. What is the projected Compound Annual Growth Rate (CAGR) of the Manganese Market?
The projected CAGR is approximately 5%.
2. Which companies are prominent players in the Manganese Market?
Key companies in the market include BHP, MOIL LIMITED, Tata Steel, Vale, Carus Group Inc, Jupiter Mines Limited, Sibelco, Mesa Minerals Limited, NIPPON DENKO CO LTD, Ningxia Tianyuan Manganese Industry Group Co Ltd, Eramet, Anglo American PLC, Assore Limited (Assmang Proprietary Limited).
3. What are the main segments of the Manganese Market?
The market segments include Application, End-use Sector.
4. Can you provide details about the market size?
The market size is estimated to be USD 24.4 Billion as of 2022.
5. What are some drivers contributing to market growth?
Increasing Demand of Electric Vehicles; Other Drivers.
6. What are the notable trends driving market growth?
Increasing Demand from Construction Sector.
7. Are there any restraints impacting market growth?
Other Restraints.
8. Can you provide examples of recent developments in the market?
In August 2020, South32 Ltd. announced that it would sell its entire stake in the manganese alloy smelter, Tasmanian Electro Metallurgical Company (TEMCO) to UK-based conglomerate GFG Alliance and thereby enhancing the business of GFG Alliance.
9. What pricing options are available for accessing the report?
Pricing options include single-user, multi-user, and enterprise licenses priced at USD 4750, USD 5250, and USD 8750 respectively.
10. Is the market size provided in terms of value or volume?
The market size is provided in terms of value, measured in Billion and volume, measured in K Tons.
11. Are there any specific market keywords associated with the report?
Yes, the market keyword associated with the report is "Manganese Market," which aids in identifying and referencing the specific market segment covered.
12. How do I determine which pricing option suits my needs best?
The pricing options vary based on user requirements and access needs. Individual users may opt for single-user licenses, while businesses requiring broader access may choose multi-user or enterprise licenses for cost-effective access to the report.
13. Are there any additional resources or data provided in the Manganese Market report?
While the report offers comprehensive insights, it's advisable to review the specific contents or supplementary materials provided to ascertain if additional resources or data are available.
14. How can I stay updated on further developments or reports in the Manganese Market?
To stay informed about further developments, trends, and reports in the Manganese Market, consider subscribing to industry newsletters, following relevant companies and organizations, or regularly checking reputable industry news sources and publications.
Methodology
Step 1 - Identification of Relevant Samples Size from Population Database


Step 2 - Approaches for Defining Global Market Size (Value, Volume* & Price*)

Note*: In applicable scenarios
Step 3 - Data Sources
Primary Research
- Web Analytics
- Survey Reports
- Research Institute
- Latest Research Reports
- Opinion Leaders
Secondary Research
- Annual Reports
- White Paper
- Latest Press Release
- Industry Association
- Paid Database
- Investor Presentations

Step 4 - Data Triangulation
Involves using different sources of information in order to increase the validity of a study
These sources are likely to be stakeholders in a program - participants, other researchers, program staff, other community members, and so on.
Then we put all data in single framework & apply various statistical tools to find out the dynamic on the market.
During the analysis stage, feedback from the stakeholder groups would be compared to determine areas of agreement as well as areas of divergence


