
Key Insights
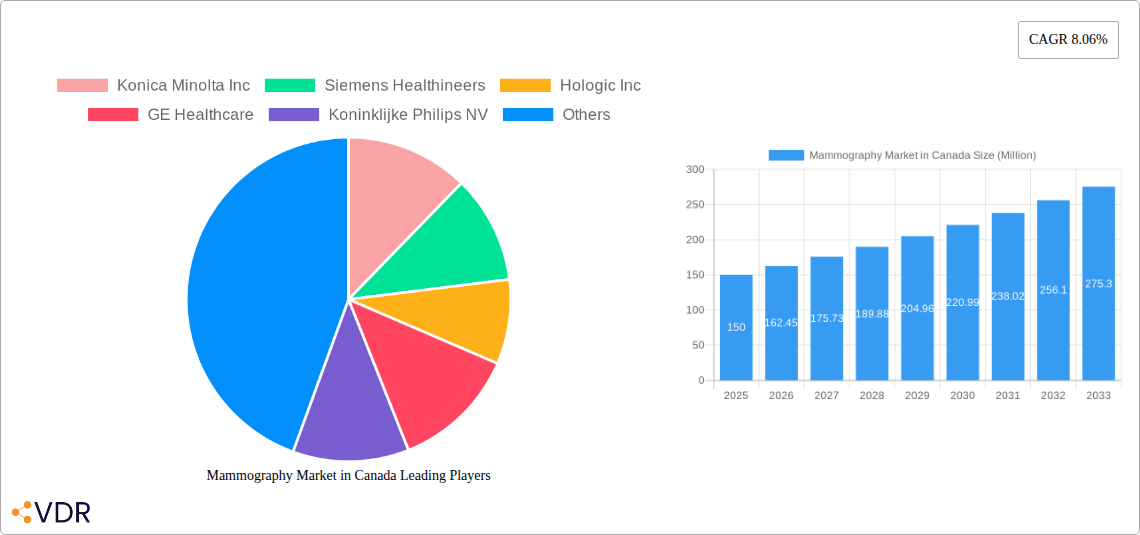
The Canadian mammography market, valued at approximately $150 million in 2025, is poised for robust growth, driven by a rising prevalence of breast cancer, an aging population, and increasing awareness of preventative healthcare. The market's compound annual growth rate (CAGR) of 8.06% from 2019-2024 suggests a continuing upward trajectory. Technological advancements, particularly in digital mammography systems and breast tomosynthesis, are significant drivers. Digital systems offer improved image quality and diagnostic accuracy, leading to earlier detection and better treatment outcomes. Tomosynthesis, creating 3D images of the breast, further enhances diagnostic capabilities, reducing the need for additional imaging and biopsies. The increasing adoption of these advanced technologies across hospitals, specialty clinics, and diagnostic centers fuels market expansion. However, high equipment costs and the need for specialized personnel can present challenges. Regional variations within Canada, with potentially higher growth in urban centers versus rural areas, also need consideration. The market is expected to see continued consolidation as larger players like GE Healthcare, Siemens Healthineers, and Hologic Inc. expand their market share through technological innovation and strategic partnerships.
The forecast period (2025-2033) anticipates substantial growth, exceeding $300 million by 2033. This expansion is predicated on continued technological advancements driving higher demand and improved diagnostic accuracy. Government initiatives promoting early breast cancer detection and increased healthcare spending will also contribute. However, potential restraints include budgetary constraints within healthcare systems and the need for continuous investment in training and staff development to maintain proficiency in the use of advanced mammography technologies. Segmentation within the market reveals a significant emphasis on digital and tomosynthesis systems, reflecting the industry trend towards enhanced diagnostic capabilities. The market’s growth will likely be influenced by factors such as advancements in AI-powered diagnostic tools, the introduction of new imaging modalities, and the implementation of government policies aimed at improving access to mammography services.
Mammography Market in Canada: A Comprehensive Report (2019-2033)
This in-depth report provides a comprehensive analysis of the Canadian mammography market, encompassing market dynamics, growth trends, regional performance, product landscape, and key players. With a study period spanning 2019-2033, a base year of 2025, and a forecast period of 2025-2033, this report is an invaluable resource for industry professionals, investors, and stakeholders seeking a detailed understanding of this vital healthcare sector. The report analyzes the parent market (Medical Imaging Equipment Market) and its child market (Mammography Market) to provide a holistic view.
Mammography Market in Canada Market Dynamics & Structure
The Canadian mammography market is characterized by a moderately concentrated landscape, with key players like Konica Minolta Inc, Siemens Healthineers, Hologic Inc, GE Healthcare, Koninklijke Philips NV, Canon Medical Systems Corporation, Planmed Oy, Carestream Health Inc, Analogic Corporation, and Fujifilm Holdings Corporation competing for market share. Market concentration is estimated at xx% in 2025.
- Technological Innovation: The market is driven by advancements in digital mammography, breast tomosynthesis, and AI-powered image analysis, leading to improved diagnostic accuracy and reduced radiation exposure.
- Regulatory Framework: Health Canada's regulatory approvals significantly influence market access and adoption of new technologies. Stringent regulatory compliance requirements shape the competitive landscape.
- Competitive Product Substitutes: While mammography remains the gold standard for breast cancer screening, alternative imaging techniques are emerging, creating competitive pressures.
- End-User Demographics: The aging Canadian population and increasing awareness of breast cancer screening contribute to market growth. The demand is primarily driven by hospitals (xx Million units in 2025) followed by specialty clinics (xx Million units in 2025) and diagnostic centers (xx Million units in 2025).
- M&A Trends: The market has witnessed a moderate level of mergers and acquisitions (M&A) activity in recent years, with xx deals recorded between 2019 and 2024. This activity is expected to continue, driven by companies seeking to expand their product portfolios and market reach. Innovation barriers include high R&D costs and stringent regulatory approvals.
Mammography Market in Canada Growth Trends & Insights
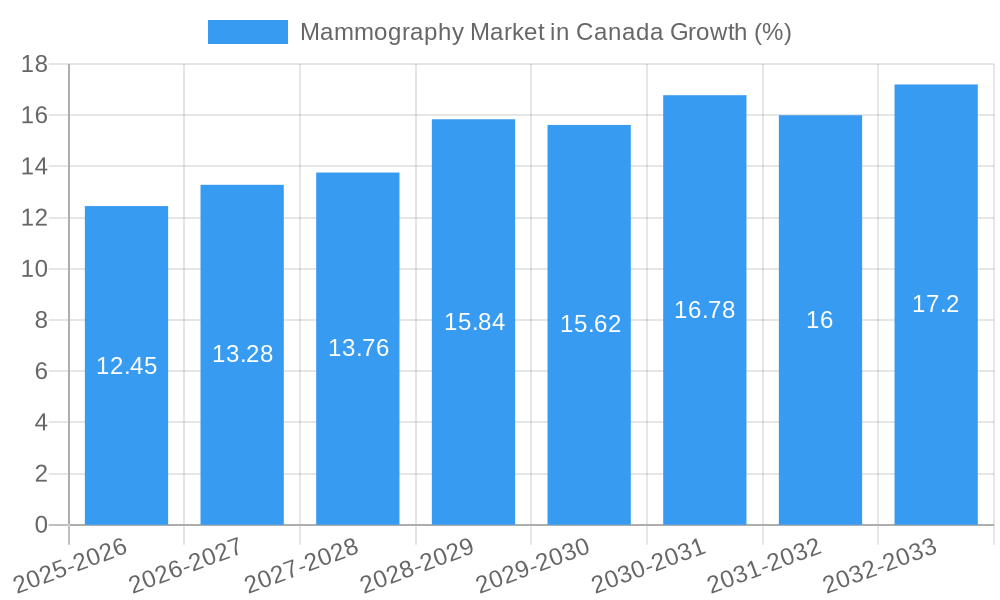
The Canadian mammography market is experiencing steady growth, driven by factors such as technological advancements, increased screening rates, and government initiatives promoting early cancer detection. The market size is estimated at xx Million units in 2025, exhibiting a CAGR of xx% during the historical period (2019-2024) and is projected to reach xx Million units by 2033, with a forecast period CAGR of xx%. Market penetration is currently estimated at xx% and is expected to increase to xx% by 2033. Technological disruptions, such as the adoption of AI-powered image analysis, are accelerating the market's growth. Consumer behavior is shifting towards a preference for minimally invasive, accurate and faster diagnostic procedures, further fueling market expansion. This trend is particularly pronounced amongst urban populations, with a higher density of advanced diagnostic centers.
Dominant Regions, Countries, or Segments in Mammography Market in Canada
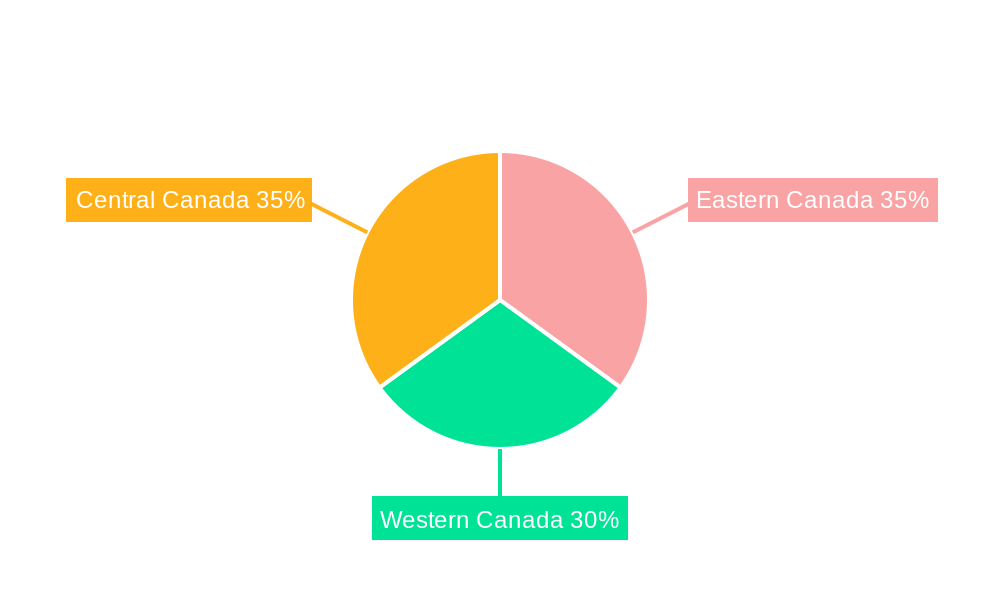
Ontario and Quebec represent the largest segments of the Canadian mammography market, accounting for a combined xx% market share in 2025. This dominance stems from high population density, well-established healthcare infrastructure, and a higher concentration of hospitals and diagnostic centers.
- Product Type: Digital mammography systems dominate the market, holding approximately xx% market share in 2025, driven by their superior image quality, versatility, and ease of use. Breast tomosynthesis is a fast-growing segment, exhibiting a high CAGR, due to its improved diagnostic capabilities.
- End User: Hospitals are the largest end-users, representing approximately xx% of the market in 2025, followed by specialty clinics and diagnostic centers. Growth in the specialty clinic segment is fuelled by increased access to private healthcare and improved patient convenience.
Mammography Market in Canada Product Landscape
The mammography product landscape is characterized by a range of digital and analog systems, including breast tomosynthesis and other specialized technologies. Digital systems offer superior image quality and reduced radiation dose, while tomosynthesis provides three-dimensional imaging for improved lesion detection. Key innovations focus on improving image quality, reducing radiation dose, and integrating AI-powered analysis tools for faster and more accurate diagnosis.
Key Drivers, Barriers & Challenges in Mammography Market in Canada
Key Drivers: Increased breast cancer awareness, government initiatives promoting early detection programs, technological advancements (AI-powered diagnostics, reduced radiation exposure), and an aging population are all key drivers of market growth.
Key Challenges: High initial investment costs associated with advanced mammography systems, the need for skilled radiologists to operate the equipment, stringent regulatory compliance requirements, and reimbursement policies can create barriers to market entry and expansion. Supply chain disruptions, exacerbated by global events, can impact the availability of equipment and parts. These disruptions had an estimated xx% impact on market growth in 2022.
Emerging Opportunities in Mammography Market in Canada
Emerging opportunities lie in the expansion of AI-powered diagnostic tools, the integration of telemammography services in remote areas, increased focus on personalized breast cancer screening strategies, and the development of portable mammography systems for enhanced patient access. Untapped markets exist in rural and remote areas where access to mammography services is limited.
Growth Accelerators in the Mammography Market in Canada Industry
Long-term growth will be fueled by continuous technological advancements, strategic collaborations between healthcare providers and technology companies, and government initiatives supporting early detection programs. The increasing adoption of AI-powered image analysis and the development of more efficient and cost-effective mammography technologies will be key drivers. Expansion into underserved markets and the introduction of innovative business models, such as pay-per-use services, will contribute to sustainable growth.
Key Players Shaping the Mammography Market in Canada Market
- Konica Minolta Inc
- Siemens Healthineers
- Hologic Inc
- GE Healthcare
- Koninklijke Philips NV
- Canon Medical Systems Corporation
- Planmed Oy
- Carestream Health Inc
- Analogic Corporation
- Fujifilm Holdings Corporation
Notable Milestones in Mammography Market in Canada Sector
- June 2022: Lunit received Health Canada approval for Lunit INSIGHT MMG, an AI solution for mammography, enhancing diagnostic capabilities.
- January 2023: The Queen Elizabeth Hospital in Charlottetown acquired a new digital mammography machine, improving early detection and reducing invasive biopsies.
In-Depth Mammography Market in Canada Market Outlook
The Canadian mammography market is poised for continued growth, driven by technological innovation, increasing awareness of breast cancer, and expanding access to screening services. Strategic opportunities exist for companies focused on developing AI-powered diagnostic tools, expanding telemammography services, and offering cost-effective solutions for underserved populations. The market is expected to witness significant expansion in the coming years, presenting lucrative opportunities for both established players and new entrants.
Mammography Market in Canada Segmentation
-
1. Product Type
- 1.1. Digital Systems
- 1.2. Analog Systems
- 1.3. Breast Tomosynthesis
- 1.4. Other Product Types
-
2. End User
- 2.1. Hospitals
- 2.2. Specialty Clinics
- 2.3. Diagnostic Centers
Mammography Market in Canada Segmentation By Geography
-
1. North America
- 1.1. United States
- 1.2. Canada
- 1.3. Mexico
-
2. South America
- 2.1. Brazil
- 2.2. Argentina
- 2.3. Rest of South America
-
3. Europe
- 3.1. United Kingdom
- 3.2. Germany
- 3.3. France
- 3.4. Italy
- 3.5. Spain
- 3.6. Russia
- 3.7. Benelux
- 3.8. Nordics
- 3.9. Rest of Europe
-
4. Middle East & Africa
- 4.1. Turkey
- 4.2. Israel
- 4.3. GCC
- 4.4. North Africa
- 4.5. South Africa
- 4.6. Rest of Middle East & Africa
-
5. Asia Pacific
- 5.1. China
- 5.2. India
- 5.3. Japan
- 5.4. South Korea
- 5.5. ASEAN
- 5.6. Oceania
- 5.7. Rest of Asia Pacific
Mammography Market in Canada REPORT HIGHLIGHTS
| Aspects | Details |
|---|---|
| Study Period | 2019-2033 |
| Base Year | 2024 |
| Estimated Year | 2025 |
| Forecast Period | 2025-2033 |
| Historical Period | 2019-2024 |
| Growth Rate | CAGR of 8.06% from 2019-2033 |
| Segmentation |
|
Table of Contents
- 1. Introduction
- 1.1. Research Scope
- 1.2. Market Segmentation
- 1.3. Research Methodology
- 1.4. Definitions and Assumptions
- 2. Executive Summary
- 2.1. Introduction
- 3. Market Dynamics
- 3.1. Introduction
- 3.2. Market Drivers
- 3.2.1. Growing Burden of Breast Cancer; Technological Advancements in the Field of Breast Imaging
- 3.3. Market Restrains
- 3.3.1. Risk of Adverse Effects from Radiation Exposure
- 3.4. Market Trends
- 3.4.1. Digital System are Expected to Witness Significant Growth Over the Forecast Period
- 4. Market Factor Analysis
- 4.1. Porters Five Forces
- 4.2. Supply/Value Chain
- 4.3. PESTEL analysis
- 4.4. Market Entropy
- 4.5. Patent/Trademark Analysis
- 5. Global Mammography Market in Canada Analysis, Insights and Forecast, 2019-2031
- 5.1. Market Analysis, Insights and Forecast - by Product Type
- 5.1.1. Digital Systems
- 5.1.2. Analog Systems
- 5.1.3. Breast Tomosynthesis
- 5.1.4. Other Product Types
- 5.2. Market Analysis, Insights and Forecast - by End User
- 5.2.1. Hospitals
- 5.2.2. Specialty Clinics
- 5.2.3. Diagnostic Centers
- 5.3. Market Analysis, Insights and Forecast - by Region
- 5.3.1. North America
- 5.3.2. South America
- 5.3.3. Europe
- 5.3.4. Middle East & Africa
- 5.3.5. Asia Pacific
- 5.1. Market Analysis, Insights and Forecast - by Product Type
- 6. North America Mammography Market in Canada Analysis, Insights and Forecast, 2019-2031
- 6.1. Market Analysis, Insights and Forecast - by Product Type
- 6.1.1. Digital Systems
- 6.1.2. Analog Systems
- 6.1.3. Breast Tomosynthesis
- 6.1.4. Other Product Types
- 6.2. Market Analysis, Insights and Forecast - by End User
- 6.2.1. Hospitals
- 6.2.2. Specialty Clinics
- 6.2.3. Diagnostic Centers
- 6.1. Market Analysis, Insights and Forecast - by Product Type
- 7. South America Mammography Market in Canada Analysis, Insights and Forecast, 2019-2031
- 7.1. Market Analysis, Insights and Forecast - by Product Type
- 7.1.1. Digital Systems
- 7.1.2. Analog Systems
- 7.1.3. Breast Tomosynthesis
- 7.1.4. Other Product Types
- 7.2. Market Analysis, Insights and Forecast - by End User
- 7.2.1. Hospitals
- 7.2.2. Specialty Clinics
- 7.2.3. Diagnostic Centers
- 7.1. Market Analysis, Insights and Forecast - by Product Type
- 8. Europe Mammography Market in Canada Analysis, Insights and Forecast, 2019-2031
- 8.1. Market Analysis, Insights and Forecast - by Product Type
- 8.1.1. Digital Systems
- 8.1.2. Analog Systems
- 8.1.3. Breast Tomosynthesis
- 8.1.4. Other Product Types
- 8.2. Market Analysis, Insights and Forecast - by End User
- 8.2.1. Hospitals
- 8.2.2. Specialty Clinics
- 8.2.3. Diagnostic Centers
- 8.1. Market Analysis, Insights and Forecast - by Product Type
- 9. Middle East & Africa Mammography Market in Canada Analysis, Insights and Forecast, 2019-2031
- 9.1. Market Analysis, Insights and Forecast - by Product Type
- 9.1.1. Digital Systems
- 9.1.2. Analog Systems
- 9.1.3. Breast Tomosynthesis
- 9.1.4. Other Product Types
- 9.2. Market Analysis, Insights and Forecast - by End User
- 9.2.1. Hospitals
- 9.2.2. Specialty Clinics
- 9.2.3. Diagnostic Centers
- 9.1. Market Analysis, Insights and Forecast - by Product Type
- 10. Asia Pacific Mammography Market in Canada Analysis, Insights and Forecast, 2019-2031
- 10.1. Market Analysis, Insights and Forecast - by Product Type
- 10.1.1. Digital Systems
- 10.1.2. Analog Systems
- 10.1.3. Breast Tomosynthesis
- 10.1.4. Other Product Types
- 10.2. Market Analysis, Insights and Forecast - by End User
- 10.2.1. Hospitals
- 10.2.2. Specialty Clinics
- 10.2.3. Diagnostic Centers
- 10.1. Market Analysis, Insights and Forecast - by Product Type
- 11. Eastern Canada Mammography Market in Canada Analysis, Insights and Forecast, 2019-2031
- 12. Western Canada Mammography Market in Canada Analysis, Insights and Forecast, 2019-2031
- 13. Central Canada Mammography Market in Canada Analysis, Insights and Forecast, 2019-2031
- 14. Competitive Analysis
- 14.1. Global Market Share Analysis 2024
- 14.2. Company Profiles
- 14.2.1 Konica Minolta Inc
- 14.2.1.1. Overview
- 14.2.1.2. Products
- 14.2.1.3. SWOT Analysis
- 14.2.1.4. Recent Developments
- 14.2.1.5. Financials (Based on Availability)
- 14.2.2 Siemens Healthineers
- 14.2.2.1. Overview
- 14.2.2.2. Products
- 14.2.2.3. SWOT Analysis
- 14.2.2.4. Recent Developments
- 14.2.2.5. Financials (Based on Availability)
- 14.2.3 Hologic Inc
- 14.2.3.1. Overview
- 14.2.3.2. Products
- 14.2.3.3. SWOT Analysis
- 14.2.3.4. Recent Developments
- 14.2.3.5. Financials (Based on Availability)
- 14.2.4 GE Healthcare
- 14.2.4.1. Overview
- 14.2.4.2. Products
- 14.2.4.3. SWOT Analysis
- 14.2.4.4. Recent Developments
- 14.2.4.5. Financials (Based on Availability)
- 14.2.5 Koninklijke Philips NV
- 14.2.5.1. Overview
- 14.2.5.2. Products
- 14.2.5.3. SWOT Analysis
- 14.2.5.4. Recent Developments
- 14.2.5.5. Financials (Based on Availability)
- 14.2.6 Canon Medical Systems Corporation
- 14.2.6.1. Overview
- 14.2.6.2. Products
- 14.2.6.3. SWOT Analysis
- 14.2.6.4. Recent Developments
- 14.2.6.5. Financials (Based on Availability)
- 14.2.7 Planmed Oy
- 14.2.7.1. Overview
- 14.2.7.2. Products
- 14.2.7.3. SWOT Analysis
- 14.2.7.4. Recent Developments
- 14.2.7.5. Financials (Based on Availability)
- 14.2.8 Carestream Health Inc
- 14.2.8.1. Overview
- 14.2.8.2. Products
- 14.2.8.3. SWOT Analysis
- 14.2.8.4. Recent Developments
- 14.2.8.5. Financials (Based on Availability)
- 14.2.9 Analogic Corporation*List Not Exhaustive
- 14.2.9.1. Overview
- 14.2.9.2. Products
- 14.2.9.3. SWOT Analysis
- 14.2.9.4. Recent Developments
- 14.2.9.5. Financials (Based on Availability)
- 14.2.10 Fujifilm Holdings Corporation
- 14.2.10.1. Overview
- 14.2.10.2. Products
- 14.2.10.3. SWOT Analysis
- 14.2.10.4. Recent Developments
- 14.2.10.5. Financials (Based on Availability)
- 14.2.1 Konica Minolta Inc
List of Figures
- Figure 1: Global Mammography Market in Canada Revenue Breakdown (Million, %) by Region 2024 & 2032
- Figure 2: Global Mammography Market in Canada Volume Breakdown (Piece, %) by Region 2024 & 2032
- Figure 3: Canada Mammography Market in Canada Revenue (Million), by Country 2024 & 2032
- Figure 4: Canada Mammography Market in Canada Volume (Piece), by Country 2024 & 2032
- Figure 5: Canada Mammography Market in Canada Revenue Share (%), by Country 2024 & 2032
- Figure 6: Canada Mammography Market in Canada Volume Share (%), by Country 2024 & 2032
- Figure 7: North America Mammography Market in Canada Revenue (Million), by Product Type 2024 & 2032
- Figure 8: North America Mammography Market in Canada Volume (Piece), by Product Type 2024 & 2032
- Figure 9: North America Mammography Market in Canada Revenue Share (%), by Product Type 2024 & 2032
- Figure 10: North America Mammography Market in Canada Volume Share (%), by Product Type 2024 & 2032
- Figure 11: North America Mammography Market in Canada Revenue (Million), by End User 2024 & 2032
- Figure 12: North America Mammography Market in Canada Volume (Piece), by End User 2024 & 2032
- Figure 13: North America Mammography Market in Canada Revenue Share (%), by End User 2024 & 2032
- Figure 14: North America Mammography Market in Canada Volume Share (%), by End User 2024 & 2032
- Figure 15: North America Mammography Market in Canada Revenue (Million), by Country 2024 & 2032
- Figure 16: North America Mammography Market in Canada Volume (Piece), by Country 2024 & 2032
- Figure 17: North America Mammography Market in Canada Revenue Share (%), by Country 2024 & 2032
- Figure 18: North America Mammography Market in Canada Volume Share (%), by Country 2024 & 2032
- Figure 19: South America Mammography Market in Canada Revenue (Million), by Product Type 2024 & 2032
- Figure 20: South America Mammography Market in Canada Volume (Piece), by Product Type 2024 & 2032
- Figure 21: South America Mammography Market in Canada Revenue Share (%), by Product Type 2024 & 2032
- Figure 22: South America Mammography Market in Canada Volume Share (%), by Product Type 2024 & 2032
- Figure 23: South America Mammography Market in Canada Revenue (Million), by End User 2024 & 2032
- Figure 24: South America Mammography Market in Canada Volume (Piece), by End User 2024 & 2032
- Figure 25: South America Mammography Market in Canada Revenue Share (%), by End User 2024 & 2032
- Figure 26: South America Mammography Market in Canada Volume Share (%), by End User 2024 & 2032
- Figure 27: South America Mammography Market in Canada Revenue (Million), by Country 2024 & 2032
- Figure 28: South America Mammography Market in Canada Volume (Piece), by Country 2024 & 2032
- Figure 29: South America Mammography Market in Canada Revenue Share (%), by Country 2024 & 2032
- Figure 30: South America Mammography Market in Canada Volume Share (%), by Country 2024 & 2032
- Figure 31: Europe Mammography Market in Canada Revenue (Million), by Product Type 2024 & 2032
- Figure 32: Europe Mammography Market in Canada Volume (Piece), by Product Type 2024 & 2032
- Figure 33: Europe Mammography Market in Canada Revenue Share (%), by Product Type 2024 & 2032
- Figure 34: Europe Mammography Market in Canada Volume Share (%), by Product Type 2024 & 2032
- Figure 35: Europe Mammography Market in Canada Revenue (Million), by End User 2024 & 2032
- Figure 36: Europe Mammography Market in Canada Volume (Piece), by End User 2024 & 2032
- Figure 37: Europe Mammography Market in Canada Revenue Share (%), by End User 2024 & 2032
- Figure 38: Europe Mammography Market in Canada Volume Share (%), by End User 2024 & 2032
- Figure 39: Europe Mammography Market in Canada Revenue (Million), by Country 2024 & 2032
- Figure 40: Europe Mammography Market in Canada Volume (Piece), by Country 2024 & 2032
- Figure 41: Europe Mammography Market in Canada Revenue Share (%), by Country 2024 & 2032
- Figure 42: Europe Mammography Market in Canada Volume Share (%), by Country 2024 & 2032
- Figure 43: Middle East & Africa Mammography Market in Canada Revenue (Million), by Product Type 2024 & 2032
- Figure 44: Middle East & Africa Mammography Market in Canada Volume (Piece), by Product Type 2024 & 2032
- Figure 45: Middle East & Africa Mammography Market in Canada Revenue Share (%), by Product Type 2024 & 2032
- Figure 46: Middle East & Africa Mammography Market in Canada Volume Share (%), by Product Type 2024 & 2032
- Figure 47: Middle East & Africa Mammography Market in Canada Revenue (Million), by End User 2024 & 2032
- Figure 48: Middle East & Africa Mammography Market in Canada Volume (Piece), by End User 2024 & 2032
- Figure 49: Middle East & Africa Mammography Market in Canada Revenue Share (%), by End User 2024 & 2032
- Figure 50: Middle East & Africa Mammography Market in Canada Volume Share (%), by End User 2024 & 2032
- Figure 51: Middle East & Africa Mammography Market in Canada Revenue (Million), by Country 2024 & 2032
- Figure 52: Middle East & Africa Mammography Market in Canada Volume (Piece), by Country 2024 & 2032
- Figure 53: Middle East & Africa Mammography Market in Canada Revenue Share (%), by Country 2024 & 2032
- Figure 54: Middle East & Africa Mammography Market in Canada Volume Share (%), by Country 2024 & 2032
- Figure 55: Asia Pacific Mammography Market in Canada Revenue (Million), by Product Type 2024 & 2032
- Figure 56: Asia Pacific Mammography Market in Canada Volume (Piece), by Product Type 2024 & 2032
- Figure 57: Asia Pacific Mammography Market in Canada Revenue Share (%), by Product Type 2024 & 2032
- Figure 58: Asia Pacific Mammography Market in Canada Volume Share (%), by Product Type 2024 & 2032
- Figure 59: Asia Pacific Mammography Market in Canada Revenue (Million), by End User 2024 & 2032
- Figure 60: Asia Pacific Mammography Market in Canada Volume (Piece), by End User 2024 & 2032
- Figure 61: Asia Pacific Mammography Market in Canada Revenue Share (%), by End User 2024 & 2032
- Figure 62: Asia Pacific Mammography Market in Canada Volume Share (%), by End User 2024 & 2032
- Figure 63: Asia Pacific Mammography Market in Canada Revenue (Million), by Country 2024 & 2032
- Figure 64: Asia Pacific Mammography Market in Canada Volume (Piece), by Country 2024 & 2032
- Figure 65: Asia Pacific Mammography Market in Canada Revenue Share (%), by Country 2024 & 2032
- Figure 66: Asia Pacific Mammography Market in Canada Volume Share (%), by Country 2024 & 2032
List of Tables
- Table 1: Global Mammography Market in Canada Revenue Million Forecast, by Region 2019 & 2032
- Table 2: Global Mammography Market in Canada Volume Piece Forecast, by Region 2019 & 2032
- Table 3: Global Mammography Market in Canada Revenue Million Forecast, by Product Type 2019 & 2032
- Table 4: Global Mammography Market in Canada Volume Piece Forecast, by Product Type 2019 & 2032
- Table 5: Global Mammography Market in Canada Revenue Million Forecast, by End User 2019 & 2032
- Table 6: Global Mammography Market in Canada Volume Piece Forecast, by End User 2019 & 2032
- Table 7: Global Mammography Market in Canada Revenue Million Forecast, by Region 2019 & 2032
- Table 8: Global Mammography Market in Canada Volume Piece Forecast, by Region 2019 & 2032
- Table 9: Global Mammography Market in Canada Revenue Million Forecast, by Country 2019 & 2032
- Table 10: Global Mammography Market in Canada Volume Piece Forecast, by Country 2019 & 2032
- Table 11: Eastern Canada Mammography Market in Canada Revenue (Million) Forecast, by Application 2019 & 2032
- Table 12: Eastern Canada Mammography Market in Canada Volume (Piece) Forecast, by Application 2019 & 2032
- Table 13: Western Canada Mammography Market in Canada Revenue (Million) Forecast, by Application 2019 & 2032
- Table 14: Western Canada Mammography Market in Canada Volume (Piece) Forecast, by Application 2019 & 2032
- Table 15: Central Canada Mammography Market in Canada Revenue (Million) Forecast, by Application 2019 & 2032
- Table 16: Central Canada Mammography Market in Canada Volume (Piece) Forecast, by Application 2019 & 2032
- Table 17: Global Mammography Market in Canada Revenue Million Forecast, by Product Type 2019 & 2032
- Table 18: Global Mammography Market in Canada Volume Piece Forecast, by Product Type 2019 & 2032
- Table 19: Global Mammography Market in Canada Revenue Million Forecast, by End User 2019 & 2032
- Table 20: Global Mammography Market in Canada Volume Piece Forecast, by End User 2019 & 2032
- Table 21: Global Mammography Market in Canada Revenue Million Forecast, by Country 2019 & 2032
- Table 22: Global Mammography Market in Canada Volume Piece Forecast, by Country 2019 & 2032
- Table 23: United States Mammography Market in Canada Revenue (Million) Forecast, by Application 2019 & 2032
- Table 24: United States Mammography Market in Canada Volume (Piece) Forecast, by Application 2019 & 2032
- Table 25: Canada Mammography Market in Canada Revenue (Million) Forecast, by Application 2019 & 2032
- Table 26: Canada Mammography Market in Canada Volume (Piece) Forecast, by Application 2019 & 2032
- Table 27: Mexico Mammography Market in Canada Revenue (Million) Forecast, by Application 2019 & 2032
- Table 28: Mexico Mammography Market in Canada Volume (Piece) Forecast, by Application 2019 & 2032
- Table 29: Global Mammography Market in Canada Revenue Million Forecast, by Product Type 2019 & 2032
- Table 30: Global Mammography Market in Canada Volume Piece Forecast, by Product Type 2019 & 2032
- Table 31: Global Mammography Market in Canada Revenue Million Forecast, by End User 2019 & 2032
- Table 32: Global Mammography Market in Canada Volume Piece Forecast, by End User 2019 & 2032
- Table 33: Global Mammography Market in Canada Revenue Million Forecast, by Country 2019 & 2032
- Table 34: Global Mammography Market in Canada Volume Piece Forecast, by Country 2019 & 2032
- Table 35: Brazil Mammography Market in Canada Revenue (Million) Forecast, by Application 2019 & 2032
- Table 36: Brazil Mammography Market in Canada Volume (Piece) Forecast, by Application 2019 & 2032
- Table 37: Argentina Mammography Market in Canada Revenue (Million) Forecast, by Application 2019 & 2032
- Table 38: Argentina Mammography Market in Canada Volume (Piece) Forecast, by Application 2019 & 2032
- Table 39: Rest of South America Mammography Market in Canada Revenue (Million) Forecast, by Application 2019 & 2032
- Table 40: Rest of South America Mammography Market in Canada Volume (Piece) Forecast, by Application 2019 & 2032
- Table 41: Global Mammography Market in Canada Revenue Million Forecast, by Product Type 2019 & 2032
- Table 42: Global Mammography Market in Canada Volume Piece Forecast, by Product Type 2019 & 2032
- Table 43: Global Mammography Market in Canada Revenue Million Forecast, by End User 2019 & 2032
- Table 44: Global Mammography Market in Canada Volume Piece Forecast, by End User 2019 & 2032
- Table 45: Global Mammography Market in Canada Revenue Million Forecast, by Country 2019 & 2032
- Table 46: Global Mammography Market in Canada Volume Piece Forecast, by Country 2019 & 2032
- Table 47: United Kingdom Mammography Market in Canada Revenue (Million) Forecast, by Application 2019 & 2032
- Table 48: United Kingdom Mammography Market in Canada Volume (Piece) Forecast, by Application 2019 & 2032
- Table 49: Germany Mammography Market in Canada Revenue (Million) Forecast, by Application 2019 & 2032
- Table 50: Germany Mammography Market in Canada Volume (Piece) Forecast, by Application 2019 & 2032
- Table 51: France Mammography Market in Canada Revenue (Million) Forecast, by Application 2019 & 2032
- Table 52: France Mammography Market in Canada Volume (Piece) Forecast, by Application 2019 & 2032
- Table 53: Italy Mammography Market in Canada Revenue (Million) Forecast, by Application 2019 & 2032
- Table 54: Italy Mammography Market in Canada Volume (Piece) Forecast, by Application 2019 & 2032
- Table 55: Spain Mammography Market in Canada Revenue (Million) Forecast, by Application 2019 & 2032
- Table 56: Spain Mammography Market in Canada Volume (Piece) Forecast, by Application 2019 & 2032
- Table 57: Russia Mammography Market in Canada Revenue (Million) Forecast, by Application 2019 & 2032
- Table 58: Russia Mammography Market in Canada Volume (Piece) Forecast, by Application 2019 & 2032
- Table 59: Benelux Mammography Market in Canada Revenue (Million) Forecast, by Application 2019 & 2032
- Table 60: Benelux Mammography Market in Canada Volume (Piece) Forecast, by Application 2019 & 2032
- Table 61: Nordics Mammography Market in Canada Revenue (Million) Forecast, by Application 2019 & 2032
- Table 62: Nordics Mammography Market in Canada Volume (Piece) Forecast, by Application 2019 & 2032
- Table 63: Rest of Europe Mammography Market in Canada Revenue (Million) Forecast, by Application 2019 & 2032
- Table 64: Rest of Europe Mammography Market in Canada Volume (Piece) Forecast, by Application 2019 & 2032
- Table 65: Global Mammography Market in Canada Revenue Million Forecast, by Product Type 2019 & 2032
- Table 66: Global Mammography Market in Canada Volume Piece Forecast, by Product Type 2019 & 2032
- Table 67: Global Mammography Market in Canada Revenue Million Forecast, by End User 2019 & 2032
- Table 68: Global Mammography Market in Canada Volume Piece Forecast, by End User 2019 & 2032
- Table 69: Global Mammography Market in Canada Revenue Million Forecast, by Country 2019 & 2032
- Table 70: Global Mammography Market in Canada Volume Piece Forecast, by Country 2019 & 2032
- Table 71: Turkey Mammography Market in Canada Revenue (Million) Forecast, by Application 2019 & 2032
- Table 72: Turkey Mammography Market in Canada Volume (Piece) Forecast, by Application 2019 & 2032
- Table 73: Israel Mammography Market in Canada Revenue (Million) Forecast, by Application 2019 & 2032
- Table 74: Israel Mammography Market in Canada Volume (Piece) Forecast, by Application 2019 & 2032
- Table 75: GCC Mammography Market in Canada Revenue (Million) Forecast, by Application 2019 & 2032
- Table 76: GCC Mammography Market in Canada Volume (Piece) Forecast, by Application 2019 & 2032
- Table 77: North Africa Mammography Market in Canada Revenue (Million) Forecast, by Application 2019 & 2032
- Table 78: North Africa Mammography Market in Canada Volume (Piece) Forecast, by Application 2019 & 2032
- Table 79: South Africa Mammography Market in Canada Revenue (Million) Forecast, by Application 2019 & 2032
- Table 80: South Africa Mammography Market in Canada Volume (Piece) Forecast, by Application 2019 & 2032
- Table 81: Rest of Middle East & Africa Mammography Market in Canada Revenue (Million) Forecast, by Application 2019 & 2032
- Table 82: Rest of Middle East & Africa Mammography Market in Canada Volume (Piece) Forecast, by Application 2019 & 2032
- Table 83: Global Mammography Market in Canada Revenue Million Forecast, by Product Type 2019 & 2032
- Table 84: Global Mammography Market in Canada Volume Piece Forecast, by Product Type 2019 & 2032
- Table 85: Global Mammography Market in Canada Revenue Million Forecast, by End User 2019 & 2032
- Table 86: Global Mammography Market in Canada Volume Piece Forecast, by End User 2019 & 2032
- Table 87: Global Mammography Market in Canada Revenue Million Forecast, by Country 2019 & 2032
- Table 88: Global Mammography Market in Canada Volume Piece Forecast, by Country 2019 & 2032
- Table 89: China Mammography Market in Canada Revenue (Million) Forecast, by Application 2019 & 2032
- Table 90: China Mammography Market in Canada Volume (Piece) Forecast, by Application 2019 & 2032
- Table 91: India Mammography Market in Canada Revenue (Million) Forecast, by Application 2019 & 2032
- Table 92: India Mammography Market in Canada Volume (Piece) Forecast, by Application 2019 & 2032
- Table 93: Japan Mammography Market in Canada Revenue (Million) Forecast, by Application 2019 & 2032
- Table 94: Japan Mammography Market in Canada Volume (Piece) Forecast, by Application 2019 & 2032
- Table 95: South Korea Mammography Market in Canada Revenue (Million) Forecast, by Application 2019 & 2032
- Table 96: South Korea Mammography Market in Canada Volume (Piece) Forecast, by Application 2019 & 2032
- Table 97: ASEAN Mammography Market in Canada Revenue (Million) Forecast, by Application 2019 & 2032
- Table 98: ASEAN Mammography Market in Canada Volume (Piece) Forecast, by Application 2019 & 2032
- Table 99: Oceania Mammography Market in Canada Revenue (Million) Forecast, by Application 2019 & 2032
- Table 100: Oceania Mammography Market in Canada Volume (Piece) Forecast, by Application 2019 & 2032
- Table 101: Rest of Asia Pacific Mammography Market in Canada Revenue (Million) Forecast, by Application 2019 & 2032
- Table 102: Rest of Asia Pacific Mammography Market in Canada Volume (Piece) Forecast, by Application 2019 & 2032
Frequently Asked Questions
1. What is the projected Compound Annual Growth Rate (CAGR) of the Mammography Market in Canada?
The projected CAGR is approximately 8.06%.
2. Which companies are prominent players in the Mammography Market in Canada?
Key companies in the market include Konica Minolta Inc, Siemens Healthineers, Hologic Inc, GE Healthcare, Koninklijke Philips NV, Canon Medical Systems Corporation, Planmed Oy, Carestream Health Inc, Analogic Corporation*List Not Exhaustive, Fujifilm Holdings Corporation.
3. What are the main segments of the Mammography Market in Canada?
The market segments include Product Type, End User.
4. Can you provide details about the market size?
The market size is estimated to be USD XX Million as of 2022.
5. What are some drivers contributing to market growth?
Growing Burden of Breast Cancer; Technological Advancements in the Field of Breast Imaging.
6. What are the notable trends driving market growth?
Digital System are Expected to Witness Significant Growth Over the Forecast Period.
7. Are there any restraints impacting market growth?
Risk of Adverse Effects from Radiation Exposure.
8. Can you provide examples of recent developments in the market?
January 2023: The Queen Elizabeth Hospital in Charlottetown purchased a new digital mammography machine to reduce the need for invasive biopsies and for early detection of breast cancers by radiologists to see breast cancers with less radiation delivered to the breast.
9. What pricing options are available for accessing the report?
Pricing options include single-user, multi-user, and enterprise licenses priced at USD 3800, USD 4500, and USD 5800 respectively.
10. Is the market size provided in terms of value or volume?
The market size is provided in terms of value, measured in Million and volume, measured in Piece.
11. Are there any specific market keywords associated with the report?
Yes, the market keyword associated with the report is "Mammography Market in Canada," which aids in identifying and referencing the specific market segment covered.
12. How do I determine which pricing option suits my needs best?
The pricing options vary based on user requirements and access needs. Individual users may opt for single-user licenses, while businesses requiring broader access may choose multi-user or enterprise licenses for cost-effective access to the report.
13. Are there any additional resources or data provided in the Mammography Market in Canada report?
While the report offers comprehensive insights, it's advisable to review the specific contents or supplementary materials provided to ascertain if additional resources or data are available.
14. How can I stay updated on further developments or reports in the Mammography Market in Canada?
To stay informed about further developments, trends, and reports in the Mammography Market in Canada, consider subscribing to industry newsletters, following relevant companies and organizations, or regularly checking reputable industry news sources and publications.
Methodology
Step 1 - Identification of Relevant Samples Size from Population Database


Step 2 - Approaches for Defining Global Market Size (Value, Volume* & Price*)

Note*: In applicable scenarios
Step 3 - Data Sources
Primary Research
- Web Analytics
- Survey Reports
- Research Institute
- Latest Research Reports
- Opinion Leaders
Secondary Research
- Annual Reports
- White Paper
- Latest Press Release
- Industry Association
- Paid Database
- Investor Presentations

Step 4 - Data Triangulation
Involves using different sources of information in order to increase the validity of a study
These sources are likely to be stakeholders in a program - participants, other researchers, program staff, other community members, and so on.
Then we put all data in single framework & apply various statistical tools to find out the dynamic on the market.
During the analysis stage, feedback from the stakeholder groups would be compared to determine areas of agreement as well as areas of divergence


