
Key Insights
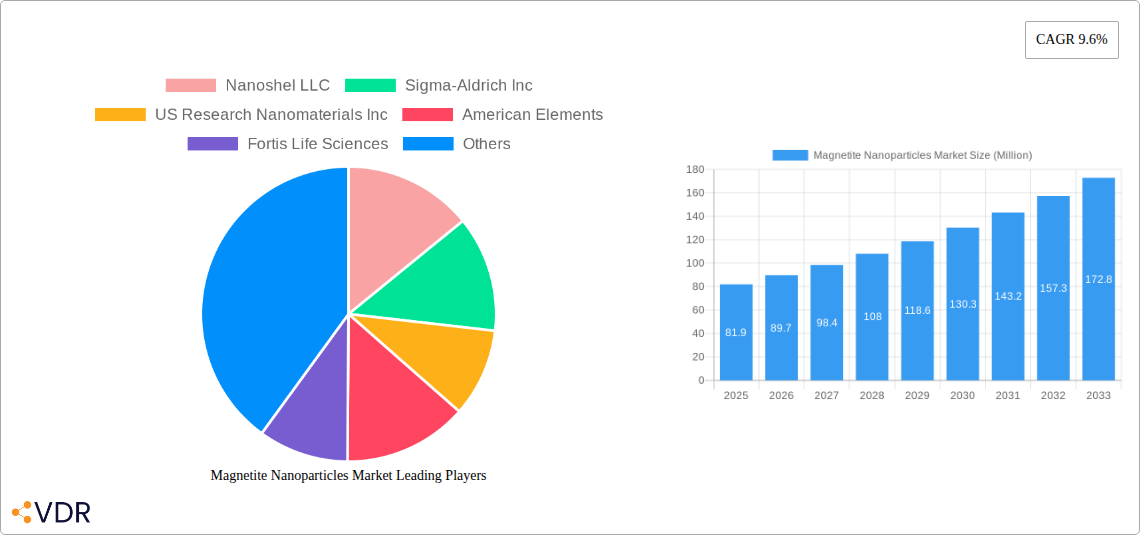
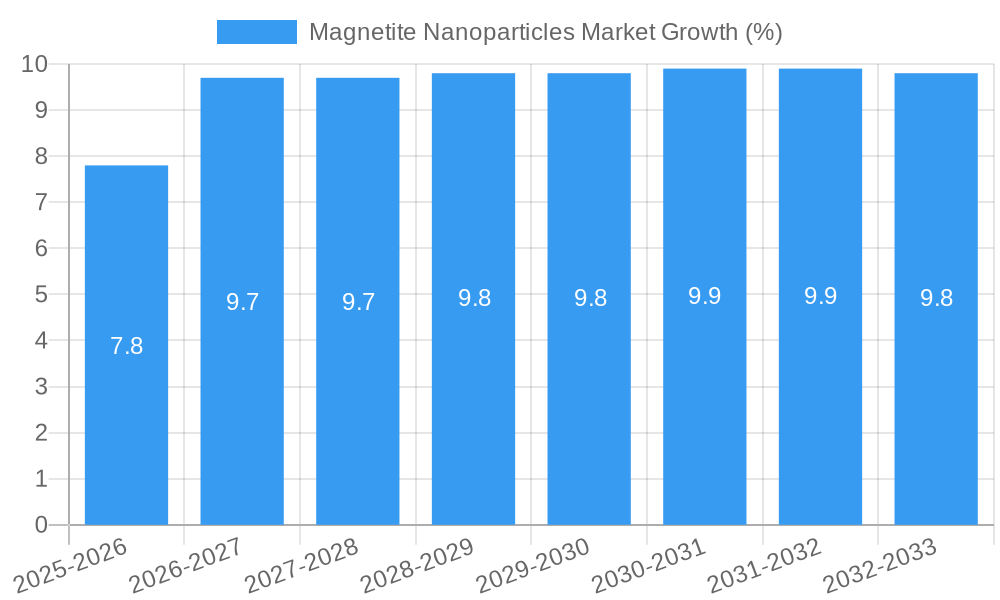
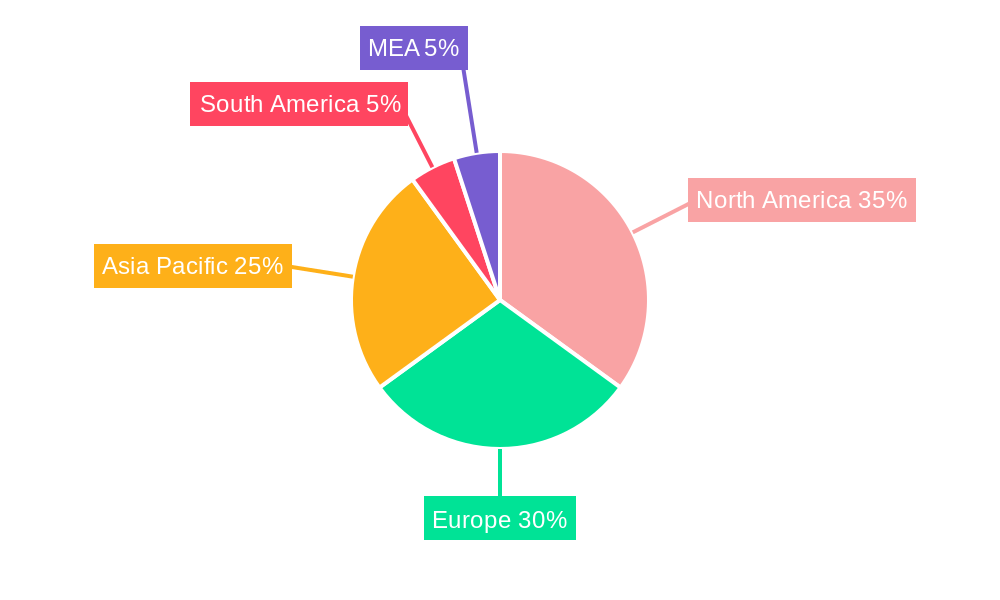
The global Magnetite Nanoparticles market, valued at $81.9 million in 2025, is projected to experience robust growth, exhibiting a Compound Annual Growth Rate (CAGR) of 9.6% from 2025 to 2033. This expansion is driven primarily by the increasing adoption of magnetite nanoparticles across diverse sectors. The biomedical application segment, leveraging their unique magnetic properties for drug delivery and diagnostics, is a significant contributor to market growth. Furthermore, the burgeoning electronics industry's demand for advanced materials in high-density data storage and magnetic sensors fuels substantial market expansion. The wastewater treatment sector also presents a promising avenue, with magnetite nanoparticles offering efficient and cost-effective solutions for pollutant removal. Growth within the energy sector, utilizing these nanoparticles in energy storage and conversion technologies, adds further impetus to the market's trajectory. While regulatory hurdles and potential environmental concerns related to nanoparticle synthesis and disposal pose some restraints, the ongoing research and development efforts focused on mitigating these challenges are expected to limit their impact on overall market growth. North America and Europe currently hold significant market share, driven by strong technological advancements and regulatory frameworks; however, the Asia-Pacific region is poised for significant growth due to rising industrialization and increasing investments in nanotechnology research.
The competitive landscape is characterized by a mix of established players and emerging companies. Key players such as Nanoshel LLC, Sigma-Aldrich Inc., and others are focusing on innovation and strategic partnerships to solidify their market position. The market is expected to witness increased consolidation and strategic alliances in the coming years, leading to further technological advancements and market penetration. The continuous development of novel applications, coupled with the increasing availability of cost-effective synthesis methods, will be key factors in shaping the future of the Magnetite Nanoparticles market. Specific regional growth rates will likely reflect factors such as governmental investments in nanotechnology research and development, infrastructure development and the rate of industrial expansion within each region.
Magnetite Nanoparticles Market: A Comprehensive Report (2019-2033)
This in-depth report provides a comprehensive analysis of the Magnetite Nanoparticles market, encompassing market dynamics, growth trends, regional dominance, product landscape, key players, and future outlook. The study period covers 2019-2033, with 2025 as the base and estimated year. The forecast period is 2025-2033, and the historical period is 2019-2024. This report is crucial for industry professionals, investors, and researchers seeking a detailed understanding of this rapidly evolving market, valued at xx Million in 2025 and projected to reach xx Million by 2033.
Magnetite Nanoparticles Market Market Dynamics & Structure
The Magnetite Nanoparticles market exhibits a moderately fragmented structure, with several key players competing across various applications. Market concentration is expected to shift slightly towards consolidation due to ongoing M&A activities. Technological innovation, particularly in synthesis methods and surface functionalization, is a major driver, while stringent regulatory frameworks governing nanomaterial usage present challenges. Competitive substitutes, such as other magnetic nanoparticles or alternative technologies, exert some pressure. End-user demographics are diverse, spanning healthcare, electronics, and environmental sectors.
- Market Concentration: Moderately Fragmented (xx% market share held by top 5 players in 2025)
- Technological Innovation: Focus on improved biocompatibility, enhanced magnetic properties, and cost-effective synthesis.
- Regulatory Landscape: Stringent regulations impacting product approval and commercialization, particularly in biomedical applications.
- Competitive Substitutes: Limited, but alternative materials are explored for niche applications.
- M&A Activity: Significant consolidation is predicted with a total of xx M&A deals predicted between 2025-2033 (xx in 2022 alone). Examples include Fortis Life Sciences' acquisition of nanoComposix and Ascensus Specialties' acquisition of Strem Chemicals UK.
- Innovation Barriers: High R&D costs, complex regulatory hurdles, and limited understanding of long-term health and environmental impacts.
Magnetite Nanoparticles Market Growth Trends & Insights
The Magnetite Nanoparticles market demonstrates robust growth, driven by increasing demand across diverse sectors. The market size experienced significant growth during the historical period (2019-2024) and is projected to maintain a healthy Compound Annual Growth Rate (CAGR) of xx% during the forecast period (2025-2033), reaching xx Million by 2033. This growth is fueled by technological advancements in synthesis and functionalization, leading to enhanced performance and expanded application possibilities. Market penetration is increasing steadily in key applications such as biomedical imaging and targeted drug delivery. Consumer behavior shifts towards eco-friendly solutions are also boosting demand in wastewater treatment and energy sectors.
Dominant Regions, Countries, or Segments in Magnetite Nanoparticles Market
The Biomedical segment currently dominates the Magnetite Nanoparticles market, driven by the extensive use of these nanoparticles in diagnostics and therapeutics. North America and Europe hold significant market share, propelled by strong research and development activities, advanced healthcare infrastructure, and favorable regulatory environments. However, the Asia-Pacific region is experiencing rapid growth, fueled by increasing healthcare spending and expanding technological capabilities.
- Key Drivers in Biomedical Segment: Growing prevalence of chronic diseases, increasing demand for advanced diagnostics and therapies, and substantial investments in medical research.
- Key Drivers in North America & Europe: Robust R&D investment, stringent regulatory frameworks, well-established healthcare infrastructure, and high disposable income.
- Key Drivers in Asia-Pacific: Rapid economic growth, rising healthcare expenditure, increasing awareness of advanced medical technologies, and a growing population.
- Market Share: Biomedical (xx%), Electronics (xx%), Wastewater Treatment (xx%), Energy (xx%), Other Applications (xx%) in 2025.
Magnetite Nanoparticles Market Product Landscape
Magnetite nanoparticles are offered in various sizes, shapes, and surface modifications, tailored to specific applications. Key innovations include the development of highly biocompatible nanoparticles for drug delivery, improved synthesis methods for controlled size and morphology, and novel surface functionalization techniques for enhanced targeting and performance. Unique selling propositions often include superior magnetic properties, high biocompatibility, and customized surface modifications for optimal functionality.
Key Drivers, Barriers & Challenges in Magnetite Nanoparticles Market
Key Drivers:
- Increasing demand for advanced diagnostic and therapeutic tools in the healthcare sector.
- Growing adoption in environmental remediation and energy applications.
- Technological advancements leading to improved performance and cost-effectiveness.
Key Challenges and Restraints:
- High R&D costs associated with nanoparticle synthesis and characterization.
- Concerns regarding the potential toxicity and environmental impact of nanoparticles.
- Stringent regulatory frameworks and approvals processes.
- Fluctuations in raw material prices (xx% predicted fluctuation during 2025-2033).
Emerging Opportunities in Magnetite Nanoparticles Market
Untapped markets in developing economies present significant growth opportunities. Emerging applications in areas such as hyperthermia cancer treatment, advanced sensors, and water purification are driving innovation and expansion. Evolving consumer preferences for sustainable solutions are also stimulating the demand for environmentally friendly nanomaterials in various industries.
Growth Accelerators in the Magnetite Nanoparticles Market Industry
Technological breakthroughs in synthesis techniques, surface functionalization, and characterization are accelerating market growth. Strategic partnerships between research institutions, pharmaceutical companies, and technology providers are fostering innovation and commercialization. Expansion into new geographic markets and diversification into emerging applications are key growth strategies for market players.
Key Players Shaping the Magnetite Nanoparticles Market Market
- Nanoshel LLC
- Sigma-Aldrich Inc
- US Research Nanomaterials Inc
- American Elements
- Fortis Life Sciences
- Reade International Corp
- NNCrystal US Corporation
- Strem Chemicals Inc
- Nanografi Nano Technology
- Cytodiagnostics Inc
- SkySpring Nanomaterials Inc
Notable Milestones in Magnetite Nanoparticles Market Sector
- July 2022: Fortis Life Sciences announced its acquisition of nanoComposix, strengthening its position in the magnetic particle market.
- November 2022: Ascensus Specialties LLC acquired Strem Chemicals UK, expanding its distribution network for high-purity catalysts and precursors.
In-Depth Magnetite Nanoparticles Market Market Outlook
The Magnetite Nanoparticles market is poised for significant growth, driven by continuous technological advancements and increasing adoption across diverse sectors. Strategic partnerships, expansion into emerging markets, and focus on developing sustainable and biocompatible nanoparticles will be crucial for companies to capitalize on the market's immense potential. The market's future is bright, with continued innovation promising new applications and improved performance, ultimately leading to substantial market expansion in the coming years.
Magnetite Nanoparticles Market Segmentation
-
1. Application
- 1.1. Biomedical
- 1.2. Electronics
- 1.3. Waste Water Treatment
- 1.4. Energy
- 1.5. Other Applications
Magnetite Nanoparticles Market Segmentation By Geography
-
1. Asia Pacific
- 1.1. China
- 1.2. India
- 1.3. Japan
- 1.4. South Korea
- 1.5. Rest of Asia Pacific
-
2. North America
- 2.1. United States
- 2.2. Canada
- 2.3. Mexico
-
3. Europe
- 3.1. Germany
- 3.2. United Kingdom
- 3.3. Italy
- 3.4. France
- 3.5. Rest of Europe
-
4. South America
- 4.1. Brazil
- 4.2. Argentina
- 4.3. Rest of South America
-
5. Middle East and Africa
- 5.1. Saudi Arabia
- 5.2. South Africa
- 5.3. Rest of Middle East and Africa
Magnetite Nanoparticles Market REPORT HIGHLIGHTS
| Aspects | Details |
|---|---|
| Study Period | 2019-2033 |
| Base Year | 2024 |
| Estimated Year | 2025 |
| Forecast Period | 2025-2033 |
| Historical Period | 2019-2024 |
| Growth Rate | CAGR of 9.6% from 2019-2033 |
| Segmentation |
|
Table of Contents
- 1. Introduction
- 1.1. Research Scope
- 1.2. Market Segmentation
- 1.3. Research Methodology
- 1.4. Definitions and Assumptions
- 2. Executive Summary
- 2.1. Introduction
- 3. Market Dynamics
- 3.1. Introduction
- 3.2. Market Drivers
- 3.2.1. Rising Demand from Electronics Industry; Growing Demand for Magnetite Nanoparticles in Wastewater Treatment Sector
- 3.3. Market Restrains
- 3.3.1. Uncertainty and Volatility in the Raw Material Prices
- 3.4. Market Trends
- 3.4.1. Increasing Demand from Bio-medical Industry
- 4. Market Factor Analysis
- 4.1. Porters Five Forces
- 4.2. Supply/Value Chain
- 4.3. PESTEL analysis
- 4.4. Market Entropy
- 4.5. Patent/Trademark Analysis
- 5. Global Magnetite Nanoparticles Market Analysis, Insights and Forecast, 2019-2031
- 5.1. Market Analysis, Insights and Forecast - by Application
- 5.1.1. Biomedical
- 5.1.2. Electronics
- 5.1.3. Waste Water Treatment
- 5.1.4. Energy
- 5.1.5. Other Applications
- 5.2. Market Analysis, Insights and Forecast - by Region
- 5.2.1. Asia Pacific
- 5.2.2. North America
- 5.2.3. Europe
- 5.2.4. South America
- 5.2.5. Middle East and Africa
- 5.1. Market Analysis, Insights and Forecast - by Application
- 6. Asia Pacific Magnetite Nanoparticles Market Analysis, Insights and Forecast, 2019-2031
- 6.1. Market Analysis, Insights and Forecast - by Application
- 6.1.1. Biomedical
- 6.1.2. Electronics
- 6.1.3. Waste Water Treatment
- 6.1.4. Energy
- 6.1.5. Other Applications
- 6.1. Market Analysis, Insights and Forecast - by Application
- 7. North America Magnetite Nanoparticles Market Analysis, Insights and Forecast, 2019-2031
- 7.1. Market Analysis, Insights and Forecast - by Application
- 7.1.1. Biomedical
- 7.1.2. Electronics
- 7.1.3. Waste Water Treatment
- 7.1.4. Energy
- 7.1.5. Other Applications
- 7.1. Market Analysis, Insights and Forecast - by Application
- 8. Europe Magnetite Nanoparticles Market Analysis, Insights and Forecast, 2019-2031
- 8.1. Market Analysis, Insights and Forecast - by Application
- 8.1.1. Biomedical
- 8.1.2. Electronics
- 8.1.3. Waste Water Treatment
- 8.1.4. Energy
- 8.1.5. Other Applications
- 8.1. Market Analysis, Insights and Forecast - by Application
- 9. South America Magnetite Nanoparticles Market Analysis, Insights and Forecast, 2019-2031
- 9.1. Market Analysis, Insights and Forecast - by Application
- 9.1.1. Biomedical
- 9.1.2. Electronics
- 9.1.3. Waste Water Treatment
- 9.1.4. Energy
- 9.1.5. Other Applications
- 9.1. Market Analysis, Insights and Forecast - by Application
- 10. Middle East and Africa Magnetite Nanoparticles Market Analysis, Insights and Forecast, 2019-2031
- 10.1. Market Analysis, Insights and Forecast - by Application
- 10.1.1. Biomedical
- 10.1.2. Electronics
- 10.1.3. Waste Water Treatment
- 10.1.4. Energy
- 10.1.5. Other Applications
- 10.1. Market Analysis, Insights and Forecast - by Application
- 11. North America Magnetite Nanoparticles Market Analysis, Insights and Forecast, 2019-2031
- 11.1. Market Analysis, Insights and Forecast - By Country/Sub-region
- 11.1.1 United States
- 11.1.2 Canada
- 11.1.3 Mexico
- 12. Europe Magnetite Nanoparticles Market Analysis, Insights and Forecast, 2019-2031
- 12.1. Market Analysis, Insights and Forecast - By Country/Sub-region
- 12.1.1 Germany
- 12.1.2 France
- 12.1.3 Italy
- 12.1.4 United Kingdom
- 12.1.5 Netherlands
- 12.1.6 Rest of Europe
- 13. Asia Pacific Magnetite Nanoparticles Market Analysis, Insights and Forecast, 2019-2031
- 13.1. Market Analysis, Insights and Forecast - By Country/Sub-region
- 13.1.1 China
- 13.1.2 Japan
- 13.1.3 India
- 13.1.4 South Korea
- 13.1.5 Taiwan
- 13.1.6 Australia
- 13.1.7 Rest of Asia-Pacific
- 14. South America Magnetite Nanoparticles Market Analysis, Insights and Forecast, 2019-2031
- 14.1. Market Analysis, Insights and Forecast - By Country/Sub-region
- 14.1.1 Brazil
- 14.1.2 Argentina
- 14.1.3 Rest of South America
- 15. MEA Magnetite Nanoparticles Market Analysis, Insights and Forecast, 2019-2031
- 15.1. Market Analysis, Insights and Forecast - By Country/Sub-region
- 15.1.1 Middle East
- 15.1.2 Africa
- 16. Competitive Analysis
- 16.1. Global Market Share Analysis 2024
- 16.2. Company Profiles
- 16.2.1 Nanoshel LLC
- 16.2.1.1. Overview
- 16.2.1.2. Products
- 16.2.1.3. SWOT Analysis
- 16.2.1.4. Recent Developments
- 16.2.1.5. Financials (Based on Availability)
- 16.2.2 Sigma-Aldrich Inc
- 16.2.2.1. Overview
- 16.2.2.2. Products
- 16.2.2.3. SWOT Analysis
- 16.2.2.4. Recent Developments
- 16.2.2.5. Financials (Based on Availability)
- 16.2.3 US Research Nanomaterials Inc
- 16.2.3.1. Overview
- 16.2.3.2. Products
- 16.2.3.3. SWOT Analysis
- 16.2.3.4. Recent Developments
- 16.2.3.5. Financials (Based on Availability)
- 16.2.4 American Elements
- 16.2.4.1. Overview
- 16.2.4.2. Products
- 16.2.4.3. SWOT Analysis
- 16.2.4.4. Recent Developments
- 16.2.4.5. Financials (Based on Availability)
- 16.2.5 Fortis Life Sciences
- 16.2.5.1. Overview
- 16.2.5.2. Products
- 16.2.5.3. SWOT Analysis
- 16.2.5.4. Recent Developments
- 16.2.5.5. Financials (Based on Availability)
- 16.2.6 Reade International Corp
- 16.2.6.1. Overview
- 16.2.6.2. Products
- 16.2.6.3. SWOT Analysis
- 16.2.6.4. Recent Developments
- 16.2.6.5. Financials (Based on Availability)
- 16.2.7 NNCrystal US Corporation
- 16.2.7.1. Overview
- 16.2.7.2. Products
- 16.2.7.3. SWOT Analysis
- 16.2.7.4. Recent Developments
- 16.2.7.5. Financials (Based on Availability)
- 16.2.8 Strem Chemicals Inc
- 16.2.8.1. Overview
- 16.2.8.2. Products
- 16.2.8.3. SWOT Analysis
- 16.2.8.4. Recent Developments
- 16.2.8.5. Financials (Based on Availability)
- 16.2.9 Nanografi Nano Technology
- 16.2.9.1. Overview
- 16.2.9.2. Products
- 16.2.9.3. SWOT Analysis
- 16.2.9.4. Recent Developments
- 16.2.9.5. Financials (Based on Availability)
- 16.2.10 Cytodiagnostics Inc
- 16.2.10.1. Overview
- 16.2.10.2. Products
- 16.2.10.3. SWOT Analysis
- 16.2.10.4. Recent Developments
- 16.2.10.5. Financials (Based on Availability)
- 16.2.11 SkySpring Nanomaterials Inc
- 16.2.11.1. Overview
- 16.2.11.2. Products
- 16.2.11.3. SWOT Analysis
- 16.2.11.4. Recent Developments
- 16.2.11.5. Financials (Based on Availability)
- 16.2.1 Nanoshel LLC
List of Figures
- Figure 1: Global Magnetite Nanoparticles Market Revenue Breakdown (Million, %) by Region 2024 & 2032
- Figure 2: Global Magnetite Nanoparticles Market Volume Breakdown (K Tons, %) by Region 2024 & 2032
- Figure 3: North America Magnetite Nanoparticles Market Revenue (Million), by Country 2024 & 2032
- Figure 4: North America Magnetite Nanoparticles Market Volume (K Tons), by Country 2024 & 2032
- Figure 5: North America Magnetite Nanoparticles Market Revenue Share (%), by Country 2024 & 2032
- Figure 6: North America Magnetite Nanoparticles Market Volume Share (%), by Country 2024 & 2032
- Figure 7: Europe Magnetite Nanoparticles Market Revenue (Million), by Country 2024 & 2032
- Figure 8: Europe Magnetite Nanoparticles Market Volume (K Tons), by Country 2024 & 2032
- Figure 9: Europe Magnetite Nanoparticles Market Revenue Share (%), by Country 2024 & 2032
- Figure 10: Europe Magnetite Nanoparticles Market Volume Share (%), by Country 2024 & 2032
- Figure 11: Asia Pacific Magnetite Nanoparticles Market Revenue (Million), by Country 2024 & 2032
- Figure 12: Asia Pacific Magnetite Nanoparticles Market Volume (K Tons), by Country 2024 & 2032
- Figure 13: Asia Pacific Magnetite Nanoparticles Market Revenue Share (%), by Country 2024 & 2032
- Figure 14: Asia Pacific Magnetite Nanoparticles Market Volume Share (%), by Country 2024 & 2032
- Figure 15: South America Magnetite Nanoparticles Market Revenue (Million), by Country 2024 & 2032
- Figure 16: South America Magnetite Nanoparticles Market Volume (K Tons), by Country 2024 & 2032
- Figure 17: South America Magnetite Nanoparticles Market Revenue Share (%), by Country 2024 & 2032
- Figure 18: South America Magnetite Nanoparticles Market Volume Share (%), by Country 2024 & 2032
- Figure 19: MEA Magnetite Nanoparticles Market Revenue (Million), by Country 2024 & 2032
- Figure 20: MEA Magnetite Nanoparticles Market Volume (K Tons), by Country 2024 & 2032
- Figure 21: MEA Magnetite Nanoparticles Market Revenue Share (%), by Country 2024 & 2032
- Figure 22: MEA Magnetite Nanoparticles Market Volume Share (%), by Country 2024 & 2032
- Figure 23: Asia Pacific Magnetite Nanoparticles Market Revenue (Million), by Application 2024 & 2032
- Figure 24: Asia Pacific Magnetite Nanoparticles Market Volume (K Tons), by Application 2024 & 2032
- Figure 25: Asia Pacific Magnetite Nanoparticles Market Revenue Share (%), by Application 2024 & 2032
- Figure 26: Asia Pacific Magnetite Nanoparticles Market Volume Share (%), by Application 2024 & 2032
- Figure 27: Asia Pacific Magnetite Nanoparticles Market Revenue (Million), by Country 2024 & 2032
- Figure 28: Asia Pacific Magnetite Nanoparticles Market Volume (K Tons), by Country 2024 & 2032
- Figure 29: Asia Pacific Magnetite Nanoparticles Market Revenue Share (%), by Country 2024 & 2032
- Figure 30: Asia Pacific Magnetite Nanoparticles Market Volume Share (%), by Country 2024 & 2032
- Figure 31: North America Magnetite Nanoparticles Market Revenue (Million), by Application 2024 & 2032
- Figure 32: North America Magnetite Nanoparticles Market Volume (K Tons), by Application 2024 & 2032
- Figure 33: North America Magnetite Nanoparticles Market Revenue Share (%), by Application 2024 & 2032
- Figure 34: North America Magnetite Nanoparticles Market Volume Share (%), by Application 2024 & 2032
- Figure 35: North America Magnetite Nanoparticles Market Revenue (Million), by Country 2024 & 2032
- Figure 36: North America Magnetite Nanoparticles Market Volume (K Tons), by Country 2024 & 2032
- Figure 37: North America Magnetite Nanoparticles Market Revenue Share (%), by Country 2024 & 2032
- Figure 38: North America Magnetite Nanoparticles Market Volume Share (%), by Country 2024 & 2032
- Figure 39: Europe Magnetite Nanoparticles Market Revenue (Million), by Application 2024 & 2032
- Figure 40: Europe Magnetite Nanoparticles Market Volume (K Tons), by Application 2024 & 2032
- Figure 41: Europe Magnetite Nanoparticles Market Revenue Share (%), by Application 2024 & 2032
- Figure 42: Europe Magnetite Nanoparticles Market Volume Share (%), by Application 2024 & 2032
- Figure 43: Europe Magnetite Nanoparticles Market Revenue (Million), by Country 2024 & 2032
- Figure 44: Europe Magnetite Nanoparticles Market Volume (K Tons), by Country 2024 & 2032
- Figure 45: Europe Magnetite Nanoparticles Market Revenue Share (%), by Country 2024 & 2032
- Figure 46: Europe Magnetite Nanoparticles Market Volume Share (%), by Country 2024 & 2032
- Figure 47: South America Magnetite Nanoparticles Market Revenue (Million), by Application 2024 & 2032
- Figure 48: South America Magnetite Nanoparticles Market Volume (K Tons), by Application 2024 & 2032
- Figure 49: South America Magnetite Nanoparticles Market Revenue Share (%), by Application 2024 & 2032
- Figure 50: South America Magnetite Nanoparticles Market Volume Share (%), by Application 2024 & 2032
- Figure 51: South America Magnetite Nanoparticles Market Revenue (Million), by Country 2024 & 2032
- Figure 52: South America Magnetite Nanoparticles Market Volume (K Tons), by Country 2024 & 2032
- Figure 53: South America Magnetite Nanoparticles Market Revenue Share (%), by Country 2024 & 2032
- Figure 54: South America Magnetite Nanoparticles Market Volume Share (%), by Country 2024 & 2032
- Figure 55: Middle East and Africa Magnetite Nanoparticles Market Revenue (Million), by Application 2024 & 2032
- Figure 56: Middle East and Africa Magnetite Nanoparticles Market Volume (K Tons), by Application 2024 & 2032
- Figure 57: Middle East and Africa Magnetite Nanoparticles Market Revenue Share (%), by Application 2024 & 2032
- Figure 58: Middle East and Africa Magnetite Nanoparticles Market Volume Share (%), by Application 2024 & 2032
- Figure 59: Middle East and Africa Magnetite Nanoparticles Market Revenue (Million), by Country 2024 & 2032
- Figure 60: Middle East and Africa Magnetite Nanoparticles Market Volume (K Tons), by Country 2024 & 2032
- Figure 61: Middle East and Africa Magnetite Nanoparticles Market Revenue Share (%), by Country 2024 & 2032
- Figure 62: Middle East and Africa Magnetite Nanoparticles Market Volume Share (%), by Country 2024 & 2032
List of Tables
- Table 1: Global Magnetite Nanoparticles Market Revenue Million Forecast, by Region 2019 & 2032
- Table 2: Global Magnetite Nanoparticles Market Volume K Tons Forecast, by Region 2019 & 2032
- Table 3: Global Magnetite Nanoparticles Market Revenue Million Forecast, by Application 2019 & 2032
- Table 4: Global Magnetite Nanoparticles Market Volume K Tons Forecast, by Application 2019 & 2032
- Table 5: Global Magnetite Nanoparticles Market Revenue Million Forecast, by Region 2019 & 2032
- Table 6: Global Magnetite Nanoparticles Market Volume K Tons Forecast, by Region 2019 & 2032
- Table 7: Global Magnetite Nanoparticles Market Revenue Million Forecast, by Country 2019 & 2032
- Table 8: Global Magnetite Nanoparticles Market Volume K Tons Forecast, by Country 2019 & 2032
- Table 9: United States Magnetite Nanoparticles Market Revenue (Million) Forecast, by Application 2019 & 2032
- Table 10: United States Magnetite Nanoparticles Market Volume (K Tons) Forecast, by Application 2019 & 2032
- Table 11: Canada Magnetite Nanoparticles Market Revenue (Million) Forecast, by Application 2019 & 2032
- Table 12: Canada Magnetite Nanoparticles Market Volume (K Tons) Forecast, by Application 2019 & 2032
- Table 13: Mexico Magnetite Nanoparticles Market Revenue (Million) Forecast, by Application 2019 & 2032
- Table 14: Mexico Magnetite Nanoparticles Market Volume (K Tons) Forecast, by Application 2019 & 2032
- Table 15: Global Magnetite Nanoparticles Market Revenue Million Forecast, by Country 2019 & 2032
- Table 16: Global Magnetite Nanoparticles Market Volume K Tons Forecast, by Country 2019 & 2032
- Table 17: Germany Magnetite Nanoparticles Market Revenue (Million) Forecast, by Application 2019 & 2032
- Table 18: Germany Magnetite Nanoparticles Market Volume (K Tons) Forecast, by Application 2019 & 2032
- Table 19: France Magnetite Nanoparticles Market Revenue (Million) Forecast, by Application 2019 & 2032
- Table 20: France Magnetite Nanoparticles Market Volume (K Tons) Forecast, by Application 2019 & 2032
- Table 21: Italy Magnetite Nanoparticles Market Revenue (Million) Forecast, by Application 2019 & 2032
- Table 22: Italy Magnetite Nanoparticles Market Volume (K Tons) Forecast, by Application 2019 & 2032
- Table 23: United Kingdom Magnetite Nanoparticles Market Revenue (Million) Forecast, by Application 2019 & 2032
- Table 24: United Kingdom Magnetite Nanoparticles Market Volume (K Tons) Forecast, by Application 2019 & 2032
- Table 25: Netherlands Magnetite Nanoparticles Market Revenue (Million) Forecast, by Application 2019 & 2032
- Table 26: Netherlands Magnetite Nanoparticles Market Volume (K Tons) Forecast, by Application 2019 & 2032
- Table 27: Rest of Europe Magnetite Nanoparticles Market Revenue (Million) Forecast, by Application 2019 & 2032
- Table 28: Rest of Europe Magnetite Nanoparticles Market Volume (K Tons) Forecast, by Application 2019 & 2032
- Table 29: Global Magnetite Nanoparticles Market Revenue Million Forecast, by Country 2019 & 2032
- Table 30: Global Magnetite Nanoparticles Market Volume K Tons Forecast, by Country 2019 & 2032
- Table 31: China Magnetite Nanoparticles Market Revenue (Million) Forecast, by Application 2019 & 2032
- Table 32: China Magnetite Nanoparticles Market Volume (K Tons) Forecast, by Application 2019 & 2032
- Table 33: Japan Magnetite Nanoparticles Market Revenue (Million) Forecast, by Application 2019 & 2032
- Table 34: Japan Magnetite Nanoparticles Market Volume (K Tons) Forecast, by Application 2019 & 2032
- Table 35: India Magnetite Nanoparticles Market Revenue (Million) Forecast, by Application 2019 & 2032
- Table 36: India Magnetite Nanoparticles Market Volume (K Tons) Forecast, by Application 2019 & 2032
- Table 37: South Korea Magnetite Nanoparticles Market Revenue (Million) Forecast, by Application 2019 & 2032
- Table 38: South Korea Magnetite Nanoparticles Market Volume (K Tons) Forecast, by Application 2019 & 2032
- Table 39: Taiwan Magnetite Nanoparticles Market Revenue (Million) Forecast, by Application 2019 & 2032
- Table 40: Taiwan Magnetite Nanoparticles Market Volume (K Tons) Forecast, by Application 2019 & 2032
- Table 41: Australia Magnetite Nanoparticles Market Revenue (Million) Forecast, by Application 2019 & 2032
- Table 42: Australia Magnetite Nanoparticles Market Volume (K Tons) Forecast, by Application 2019 & 2032
- Table 43: Rest of Asia-Pacific Magnetite Nanoparticles Market Revenue (Million) Forecast, by Application 2019 & 2032
- Table 44: Rest of Asia-Pacific Magnetite Nanoparticles Market Volume (K Tons) Forecast, by Application 2019 & 2032
- Table 45: Global Magnetite Nanoparticles Market Revenue Million Forecast, by Country 2019 & 2032
- Table 46: Global Magnetite Nanoparticles Market Volume K Tons Forecast, by Country 2019 & 2032
- Table 47: Brazil Magnetite Nanoparticles Market Revenue (Million) Forecast, by Application 2019 & 2032
- Table 48: Brazil Magnetite Nanoparticles Market Volume (K Tons) Forecast, by Application 2019 & 2032
- Table 49: Argentina Magnetite Nanoparticles Market Revenue (Million) Forecast, by Application 2019 & 2032
- Table 50: Argentina Magnetite Nanoparticles Market Volume (K Tons) Forecast, by Application 2019 & 2032
- Table 51: Rest of South America Magnetite Nanoparticles Market Revenue (Million) Forecast, by Application 2019 & 2032
- Table 52: Rest of South America Magnetite Nanoparticles Market Volume (K Tons) Forecast, by Application 2019 & 2032
- Table 53: Global Magnetite Nanoparticles Market Revenue Million Forecast, by Country 2019 & 2032
- Table 54: Global Magnetite Nanoparticles Market Volume K Tons Forecast, by Country 2019 & 2032
- Table 55: Middle East Magnetite Nanoparticles Market Revenue (Million) Forecast, by Application 2019 & 2032
- Table 56: Middle East Magnetite Nanoparticles Market Volume (K Tons) Forecast, by Application 2019 & 2032
- Table 57: Africa Magnetite Nanoparticles Market Revenue (Million) Forecast, by Application 2019 & 2032
- Table 58: Africa Magnetite Nanoparticles Market Volume (K Tons) Forecast, by Application 2019 & 2032
- Table 59: Global Magnetite Nanoparticles Market Revenue Million Forecast, by Application 2019 & 2032
- Table 60: Global Magnetite Nanoparticles Market Volume K Tons Forecast, by Application 2019 & 2032
- Table 61: Global Magnetite Nanoparticles Market Revenue Million Forecast, by Country 2019 & 2032
- Table 62: Global Magnetite Nanoparticles Market Volume K Tons Forecast, by Country 2019 & 2032
- Table 63: China Magnetite Nanoparticles Market Revenue (Million) Forecast, by Application 2019 & 2032
- Table 64: China Magnetite Nanoparticles Market Volume (K Tons) Forecast, by Application 2019 & 2032
- Table 65: India Magnetite Nanoparticles Market Revenue (Million) Forecast, by Application 2019 & 2032
- Table 66: India Magnetite Nanoparticles Market Volume (K Tons) Forecast, by Application 2019 & 2032
- Table 67: Japan Magnetite Nanoparticles Market Revenue (Million) Forecast, by Application 2019 & 2032
- Table 68: Japan Magnetite Nanoparticles Market Volume (K Tons) Forecast, by Application 2019 & 2032
- Table 69: South Korea Magnetite Nanoparticles Market Revenue (Million) Forecast, by Application 2019 & 2032
- Table 70: South Korea Magnetite Nanoparticles Market Volume (K Tons) Forecast, by Application 2019 & 2032
- Table 71: Rest of Asia Pacific Magnetite Nanoparticles Market Revenue (Million) Forecast, by Application 2019 & 2032
- Table 72: Rest of Asia Pacific Magnetite Nanoparticles Market Volume (K Tons) Forecast, by Application 2019 & 2032
- Table 73: Global Magnetite Nanoparticles Market Revenue Million Forecast, by Application 2019 & 2032
- Table 74: Global Magnetite Nanoparticles Market Volume K Tons Forecast, by Application 2019 & 2032
- Table 75: Global Magnetite Nanoparticles Market Revenue Million Forecast, by Country 2019 & 2032
- Table 76: Global Magnetite Nanoparticles Market Volume K Tons Forecast, by Country 2019 & 2032
- Table 77: United States Magnetite Nanoparticles Market Revenue (Million) Forecast, by Application 2019 & 2032
- Table 78: United States Magnetite Nanoparticles Market Volume (K Tons) Forecast, by Application 2019 & 2032
- Table 79: Canada Magnetite Nanoparticles Market Revenue (Million) Forecast, by Application 2019 & 2032
- Table 80: Canada Magnetite Nanoparticles Market Volume (K Tons) Forecast, by Application 2019 & 2032
- Table 81: Mexico Magnetite Nanoparticles Market Revenue (Million) Forecast, by Application 2019 & 2032
- Table 82: Mexico Magnetite Nanoparticles Market Volume (K Tons) Forecast, by Application 2019 & 2032
- Table 83: Global Magnetite Nanoparticles Market Revenue Million Forecast, by Application 2019 & 2032
- Table 84: Global Magnetite Nanoparticles Market Volume K Tons Forecast, by Application 2019 & 2032
- Table 85: Global Magnetite Nanoparticles Market Revenue Million Forecast, by Country 2019 & 2032
- Table 86: Global Magnetite Nanoparticles Market Volume K Tons Forecast, by Country 2019 & 2032
- Table 87: Germany Magnetite Nanoparticles Market Revenue (Million) Forecast, by Application 2019 & 2032
- Table 88: Germany Magnetite Nanoparticles Market Volume (K Tons) Forecast, by Application 2019 & 2032
- Table 89: United Kingdom Magnetite Nanoparticles Market Revenue (Million) Forecast, by Application 2019 & 2032
- Table 90: United Kingdom Magnetite Nanoparticles Market Volume (K Tons) Forecast, by Application 2019 & 2032
- Table 91: Italy Magnetite Nanoparticles Market Revenue (Million) Forecast, by Application 2019 & 2032
- Table 92: Italy Magnetite Nanoparticles Market Volume (K Tons) Forecast, by Application 2019 & 2032
- Table 93: France Magnetite Nanoparticles Market Revenue (Million) Forecast, by Application 2019 & 2032
- Table 94: France Magnetite Nanoparticles Market Volume (K Tons) Forecast, by Application 2019 & 2032
- Table 95: Rest of Europe Magnetite Nanoparticles Market Revenue (Million) Forecast, by Application 2019 & 2032
- Table 96: Rest of Europe Magnetite Nanoparticles Market Volume (K Tons) Forecast, by Application 2019 & 2032
- Table 97: Global Magnetite Nanoparticles Market Revenue Million Forecast, by Application 2019 & 2032
- Table 98: Global Magnetite Nanoparticles Market Volume K Tons Forecast, by Application 2019 & 2032
- Table 99: Global Magnetite Nanoparticles Market Revenue Million Forecast, by Country 2019 & 2032
- Table 100: Global Magnetite Nanoparticles Market Volume K Tons Forecast, by Country 2019 & 2032
- Table 101: Brazil Magnetite Nanoparticles Market Revenue (Million) Forecast, by Application 2019 & 2032
- Table 102: Brazil Magnetite Nanoparticles Market Volume (K Tons) Forecast, by Application 2019 & 2032
- Table 103: Argentina Magnetite Nanoparticles Market Revenue (Million) Forecast, by Application 2019 & 2032
- Table 104: Argentina Magnetite Nanoparticles Market Volume (K Tons) Forecast, by Application 2019 & 2032
- Table 105: Rest of South America Magnetite Nanoparticles Market Revenue (Million) Forecast, by Application 2019 & 2032
- Table 106: Rest of South America Magnetite Nanoparticles Market Volume (K Tons) Forecast, by Application 2019 & 2032
- Table 107: Global Magnetite Nanoparticles Market Revenue Million Forecast, by Application 2019 & 2032
- Table 108: Global Magnetite Nanoparticles Market Volume K Tons Forecast, by Application 2019 & 2032
- Table 109: Global Magnetite Nanoparticles Market Revenue Million Forecast, by Country 2019 & 2032
- Table 110: Global Magnetite Nanoparticles Market Volume K Tons Forecast, by Country 2019 & 2032
- Table 111: Saudi Arabia Magnetite Nanoparticles Market Revenue (Million) Forecast, by Application 2019 & 2032
- Table 112: Saudi Arabia Magnetite Nanoparticles Market Volume (K Tons) Forecast, by Application 2019 & 2032
- Table 113: South Africa Magnetite Nanoparticles Market Revenue (Million) Forecast, by Application 2019 & 2032
- Table 114: South Africa Magnetite Nanoparticles Market Volume (K Tons) Forecast, by Application 2019 & 2032
- Table 115: Rest of Middle East and Africa Magnetite Nanoparticles Market Revenue (Million) Forecast, by Application 2019 & 2032
- Table 116: Rest of Middle East and Africa Magnetite Nanoparticles Market Volume (K Tons) Forecast, by Application 2019 & 2032
Frequently Asked Questions
1. What is the projected Compound Annual Growth Rate (CAGR) of the Magnetite Nanoparticles Market?
The projected CAGR is approximately 9.6%.
2. Which companies are prominent players in the Magnetite Nanoparticles Market?
Key companies in the market include Nanoshel LLC, Sigma-Aldrich Inc, US Research Nanomaterials Inc, American Elements, Fortis Life Sciences, Reade International Corp, NNCrystal US Corporation, Strem Chemicals Inc, Nanografi Nano Technology, Cytodiagnostics Inc, SkySpring Nanomaterials Inc.
3. What are the main segments of the Magnetite Nanoparticles Market?
The market segments include Application.
4. Can you provide details about the market size?
The market size is estimated to be USD 81.9 Million as of 2022.
5. What are some drivers contributing to market growth?
Rising Demand from Electronics Industry; Growing Demand for Magnetite Nanoparticles in Wastewater Treatment Sector.
6. What are the notable trends driving market growth?
Increasing Demand from Bio-medical Industry.
7. Are there any restraints impacting market growth?
Uncertainty and Volatility in the Raw Material Prices.
8. Can you provide examples of recent developments in the market?
In November 2022, Ascensus Specialties LLC announced its acquisition of the business and certain assets of Strem Chemicals UK, the independent distributor of Ascensus high-purity, research-grade catalysts, ligands, organometallics, metal carbonyls and CVD/ALD precursors for the UK market.
9. What pricing options are available for accessing the report?
Pricing options include single-user, multi-user, and enterprise licenses priced at USD 4750, USD 5250, and USD 8750 respectively.
10. Is the market size provided in terms of value or volume?
The market size is provided in terms of value, measured in Million and volume, measured in K Tons.
11. Are there any specific market keywords associated with the report?
Yes, the market keyword associated with the report is "Magnetite Nanoparticles Market," which aids in identifying and referencing the specific market segment covered.
12. How do I determine which pricing option suits my needs best?
The pricing options vary based on user requirements and access needs. Individual users may opt for single-user licenses, while businesses requiring broader access may choose multi-user or enterprise licenses for cost-effective access to the report.
13. Are there any additional resources or data provided in the Magnetite Nanoparticles Market report?
While the report offers comprehensive insights, it's advisable to review the specific contents or supplementary materials provided to ascertain if additional resources or data are available.
14. How can I stay updated on further developments or reports in the Magnetite Nanoparticles Market?
To stay informed about further developments, trends, and reports in the Magnetite Nanoparticles Market, consider subscribing to industry newsletters, following relevant companies and organizations, or regularly checking reputable industry news sources and publications.
Methodology
Step 1 - Identification of Relevant Samples Size from Population Database


Step 2 - Approaches for Defining Global Market Size (Value, Volume* & Price*)

Note*: In applicable scenarios
Step 3 - Data Sources
Primary Research
- Web Analytics
- Survey Reports
- Research Institute
- Latest Research Reports
- Opinion Leaders
Secondary Research
- Annual Reports
- White Paper
- Latest Press Release
- Industry Association
- Paid Database
- Investor Presentations

Step 4 - Data Triangulation
Involves using different sources of information in order to increase the validity of a study
These sources are likely to be stakeholders in a program - participants, other researchers, program staff, other community members, and so on.
Then we put all data in single framework & apply various statistical tools to find out the dynamic on the market.
During the analysis stage, feedback from the stakeholder groups would be compared to determine areas of agreement as well as areas of divergence


