
Key Insights
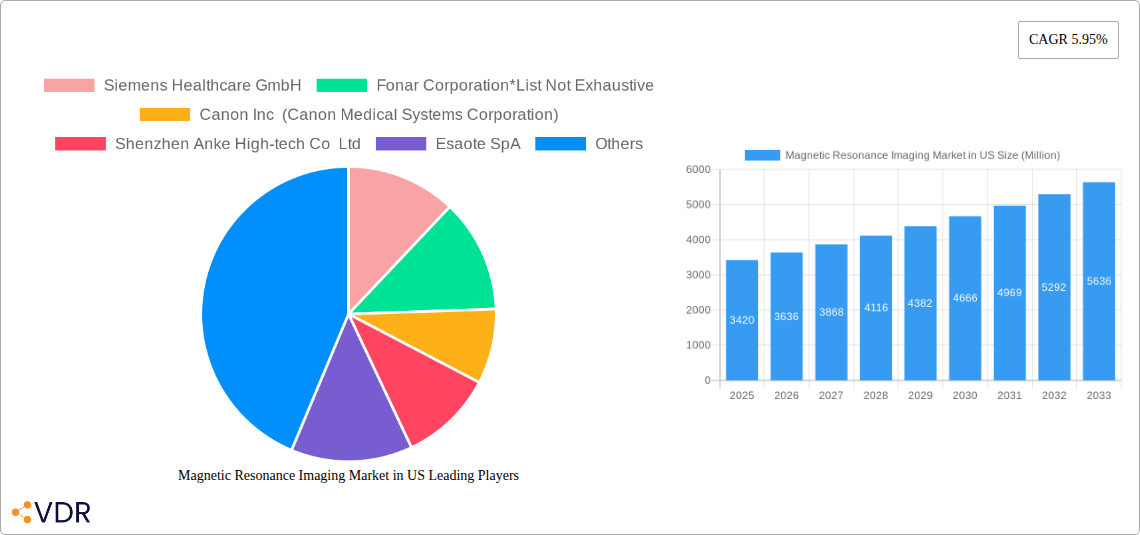
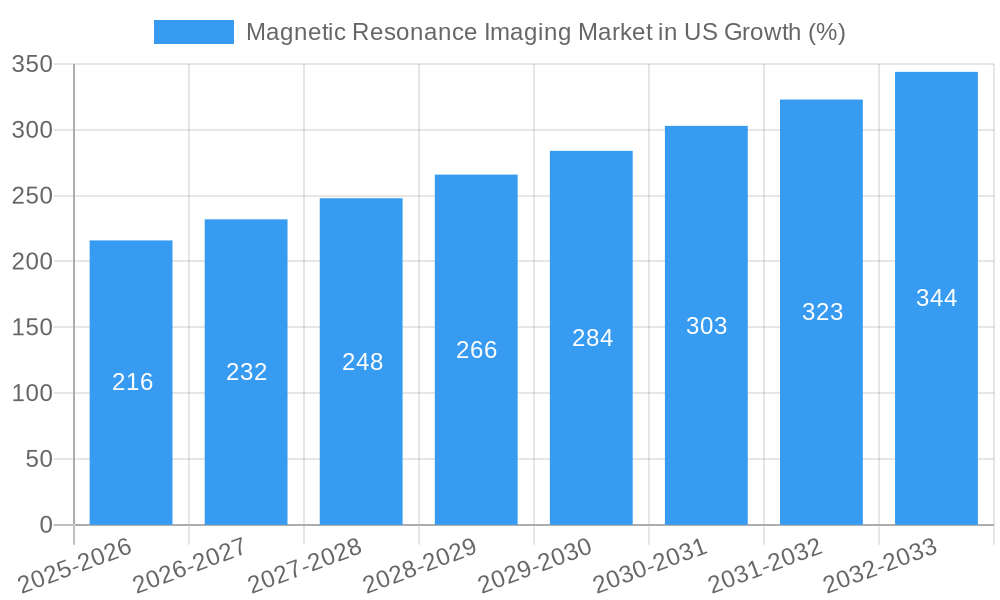
The US Magnetic Resonance Imaging (MRI) market, valued at $3.42 billion in 2025, is projected to experience robust growth, driven by a rising geriatric population necessitating increased diagnostic procedures, technological advancements leading to higher image quality and faster scan times, and expanding applications across various medical specialties. The market's Compound Annual Growth Rate (CAGR) of 5.95% from 2025 to 2033 indicates substantial expansion, with high-field and ultra-high-field MRI systems leading the growth due to their superior image resolution and diagnostic capabilities. Technological innovations like artificial intelligence (AI) integration for improved image analysis and faster processing are further accelerating market expansion. However, factors such as high equipment costs, stringent regulatory approvals, and the availability of alternative imaging technologies such as CT scans pose potential restraints to the market's growth.
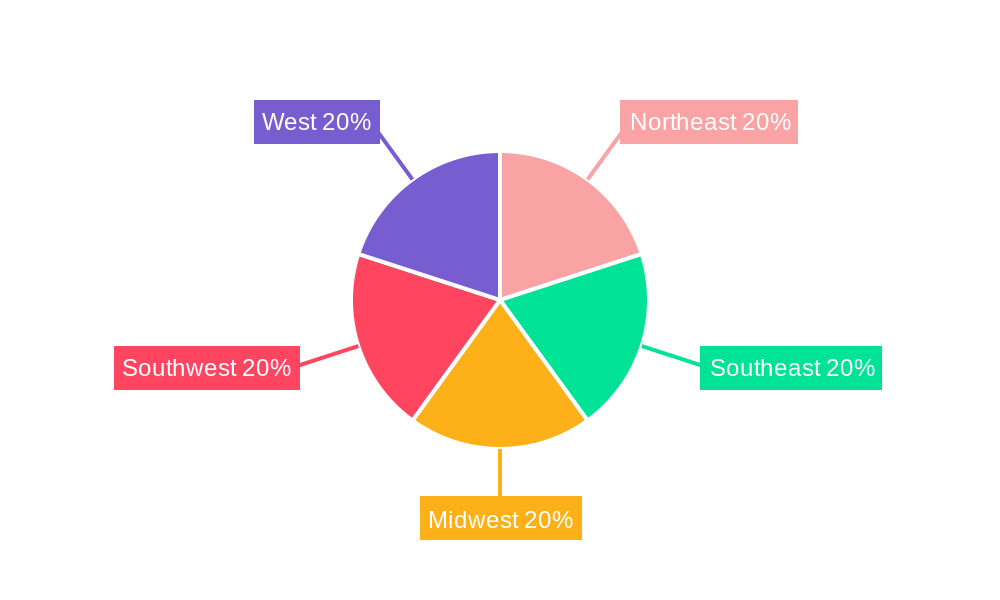
The segmentation analysis reveals strong demand across various applications, notably oncology, neurology, and cardiology, reflecting the crucial role MRI plays in diagnosing and monitoring these conditions. Within the architecture segment, open MRI systems are gaining traction due to their patient-friendly design, especially beneficial for claustrophobic patients or those requiring more accessible scans. The regional analysis of the US market points to a relatively even distribution across the Northeast, Southeast, Midwest, Southwest, and West, reflecting consistent healthcare infrastructure and demand for advanced diagnostic technologies throughout the country. The leading market players, including Siemens Healthcare, GE Healthcare, and Philips, are actively engaged in R&D and strategic acquisitions to consolidate their market share and drive technological advancements. The foreseeable future indicates a continued upward trajectory for the US MRI market, fueled by an aging population, increased healthcare spending, and ongoing innovations in MRI technology.
Magnetic Resonance Imaging (MRI) Market in US: A Comprehensive Market Report (2019-2033)
This in-depth report provides a comprehensive analysis of the Magnetic Resonance Imaging (MRI) market in the US, covering market dynamics, growth trends, key segments, competitive landscape, and future outlook. The report utilizes data from 2019-2024 (historical period), with 2025 as the base year and forecasts extending to 2033. The market is segmented by architecture (Closed MRI Systems, Open MRI Systems), field strength (Low Field, High Field, Very High Field, Ultra-high Field MRI Systems), and application (Oncology, Neurology, Cardiology, Gastroenterology, Musculoskeletal, Other Applications). The total market size is projected to reach xx Million by 2033.
Magnetic Resonance Imaging Market in US Market Dynamics & Structure
The US MRI market is characterized by a moderately concentrated landscape, with key players such as Siemens Healthcare GmbH, GE HealthCare, Koninklijke Philips N V, and Canon Inc. (Canon Medical Systems Corporation) holding significant market share. Technological innovation, particularly in deep learning and advanced imaging techniques, is a major driver. Stringent regulatory frameworks from the FDA influence product development and market access. The market faces competition from alternative imaging modalities like CT scans and ultrasound, although MRI retains its advantage in certain applications. M&A activity has been relatively moderate in recent years, with xx deals recorded between 2019 and 2024, resulting in a xx% market share shift. End-user demographics are shifting towards an aging population with increased prevalence of chronic diseases, fueling demand.
- Market Concentration: Moderately concentrated, with top 5 players holding approximately xx% market share in 2024.
- Innovation Drivers: Deep learning, AI-powered image analysis, improved coil technology, and faster scan times.
- Regulatory Framework: Stringent FDA approvals and safety regulations impacting product launches and market entry.
- Competitive Substitutes: CT scans, ultrasound, and other diagnostic imaging technologies.
- End-User Demographics: Aging population and rising prevalence of chronic diseases driving demand.
- M&A Trends: Moderate activity in recent years, with xx deals recorded between 2019-2024.
Magnetic Resonance Imaging Market in US Growth Trends & Insights
The US MRI market experienced a Compound Annual Growth Rate (CAGR) of xx% during the historical period (2019-2024), reaching a market size of xx Million in 2024. This growth is attributed to factors such as technological advancements, increasing healthcare expenditure, rising prevalence of chronic diseases, and growing adoption of advanced imaging techniques across various healthcare settings. Market penetration remains relatively high in urban areas but offers significant growth potential in rural regions. Technological disruptions, like the introduction of AI-powered image analysis tools, are streamlining workflows and improving diagnostic accuracy, further accelerating market growth. Consumer behavior is shifting towards greater demand for faster, higher-resolution imaging with reduced scan times. The forecast period (2025-2033) projects a CAGR of xx%, driven by continued technological innovation and increasing healthcare spending. By 2033, the market size is anticipated to reach xx Million.
Dominant Regions, Countries, or Segments in Magnetic Resonance Imaging Market in US
The Northeast and West Coast regions dominate the US MRI market, driven by high healthcare expenditure, presence of major research institutions, and concentration of specialized healthcare facilities. Within applications, Oncology and Neurology currently hold the largest market share, owing to the critical role of MRI in cancer diagnosis and treatment planning and the increasing prevalence of neurological disorders. High-field MRI systems are witnessing significant growth due to their superior image quality and diagnostic capabilities. Open MRI systems are gaining traction due to their patient comfort and suitability for claustrophobic patients.
- Leading Region: Northeast and West Coast (xx% market share in 2024)
- Leading Application: Oncology and Neurology (combined xx% market share in 2024)
- Leading Architecture: Closed MRI Systems (xx% market share in 2024)
- Leading Field Strength: High-Field MRI Systems (xx% market share in 2024)
- Growth Drivers: High healthcare spending, presence of major hospitals, technological advancements, and increasing prevalence of chronic diseases.
Magnetic Resonance Imaging Market in US Product Landscape
The MRI market is witnessing continuous product innovation focusing on improved image quality, faster scan times, and enhanced patient comfort. Advancements include AI-powered image reconstruction, deep learning for automated image analysis, and the development of specialized coils for specific anatomical regions. These innovations are driving increased adoption and improving diagnostic accuracy. Key performance metrics include spatial resolution, temporal resolution, signal-to-noise ratio, and scan time. Unique selling propositions are focused on improved image quality, reduced scan time, patient comfort, and integration with hospital information systems.
Key Drivers, Barriers & Challenges in Magnetic Resonance Imaging Market in US
Key Drivers:
- Rising prevalence of chronic diseases requiring advanced imaging.
- Technological advancements resulting in improved image quality and speed.
- Increasing healthcare spending and insurance coverage.
Challenges:
- High cost of MRI systems and associated infrastructure limits accessibility.
- Stringent regulatory requirements for approval and safety.
- Competition from other imaging modalities with lower cost and faster scan times. The estimated impact of these factors on market growth in 2024 is xx%.
Emerging Opportunities in Magnetic Resonance Imaging Market in US
- Expansion into untapped markets such as rural areas through mobile MRI units.
- Development of novel applications such as functional MRI for brain research.
- Growing demand for AI-powered image analysis tools and cloud-based solutions for remote diagnostics.
Growth Accelerators in the Magnetic Resonance Imaging Market in US Industry
Technological breakthroughs such as AI-powered image reconstruction and advanced coil technology are expected to significantly boost market growth. Strategic partnerships between manufacturers and healthcare providers are streamlining implementation and optimizing workflow. Market expansion strategies targeting underserved communities and offering cost-effective solutions will further fuel market growth.
Key Players Shaping the Magnetic Resonance Imaging Market in US Market
- Siemens Healthcare GmbH
- Fonar Corporation
- Canon Inc (Canon Medical Systems Corporation)
- Shenzhen Anke High-tech Co Ltd
- Esaote SpA
- Aurora Imaging Technology
- Koninklijke Philips N V
- GE HealthCare
- Neusoft Medical Systems Co Ltd
- Fujifilm Holdings Corporation
Notable Milestones in Magnetic Resonance Imaging Market in US Sector
- June 2023: GE HealthCare launched its FDA-cleared Sonic DL, accelerating MRI image acquisition.
- May 2023: Cincinnati Children’s Hospital Medical Center used XENOVIEW xenon MRI for lung ventilation imaging.
In-Depth Magnetic Resonance Imaging Market in US Market Outlook
The future of the US MRI market is bright, driven by ongoing technological advancements, increasing healthcare spending, and the rising prevalence of chronic diseases. Strategic partnerships, expansion into new applications, and the adoption of innovative business models will further propel market growth. The market's potential is significant, with continued expansion expected throughout the forecast period, primarily driven by the ongoing demand for enhanced diagnostic capabilities and the development of new applications.
Magnetic Resonance Imaging Market in US Segmentation
-
1. Architecture
- 1.1. Closed MRI Systems
- 1.2. Open MRI Systems
-
2. Field Strength
- 2.1. Low Field MRI Systems
- 2.2. High Field MRI Systems
- 2.3. Very Hig
-
3. Application
- 3.1. Oncology
- 3.2. Neurology
- 3.3. Cardiology
- 3.4. Gastroenterology
- 3.5. Musculoskeletal
- 3.6. Other Applications
Magnetic Resonance Imaging Market in US Segmentation By Geography
-
1. North America
- 1.1. United States
- 1.2. Canada
- 1.3. Mexico
-
2. South America
- 2.1. Brazil
- 2.2. Argentina
- 2.3. Rest of South America
-
3. Europe
- 3.1. United Kingdom
- 3.2. Germany
- 3.3. France
- 3.4. Italy
- 3.5. Spain
- 3.6. Russia
- 3.7. Benelux
- 3.8. Nordics
- 3.9. Rest of Europe
-
4. Middle East & Africa
- 4.1. Turkey
- 4.2. Israel
- 4.3. GCC
- 4.4. North Africa
- 4.5. South Africa
- 4.6. Rest of Middle East & Africa
-
5. Asia Pacific
- 5.1. China
- 5.2. India
- 5.3. Japan
- 5.4. South Korea
- 5.5. ASEAN
- 5.6. Oceania
- 5.7. Rest of Asia Pacific
Magnetic Resonance Imaging Market in US REPORT HIGHLIGHTS
| Aspects | Details |
|---|---|
| Study Period | 2019-2033 |
| Base Year | 2024 |
| Estimated Year | 2025 |
| Forecast Period | 2025-2033 |
| Historical Period | 2019-2024 |
| Growth Rate | CAGR of 5.95% from 2019-2033 |
| Segmentation |
|
Table of Contents
- 1. Introduction
- 1.1. Research Scope
- 1.2. Market Segmentation
- 1.3. Research Methodology
- 1.4. Definitions and Assumptions
- 2. Executive Summary
- 2.1. Introduction
- 3. Market Dynamics
- 3.1. Introduction
- 3.2. Market Drivers
- 3.2.1. Growing Burden of Chronic Diseases; Advancements in MRI Systems and Availability of Universal Health Coverage
- 3.3. Market Restrains
- 3.3.1. High Cost of MRI Systems
- 3.4. Market Trends
- 3.4.1. Neurology Segment is Expected to Witness Significant Growth Over the Forecast Period
- 4. Market Factor Analysis
- 4.1. Porters Five Forces
- 4.2. Supply/Value Chain
- 4.3. PESTEL analysis
- 4.4. Market Entropy
- 4.5. Patent/Trademark Analysis
- 5. Global Magnetic Resonance Imaging Market in US Analysis, Insights and Forecast, 2019-2031
- 5.1. Market Analysis, Insights and Forecast - by Architecture
- 5.1.1. Closed MRI Systems
- 5.1.2. Open MRI Systems
- 5.2. Market Analysis, Insights and Forecast - by Field Strength
- 5.2.1. Low Field MRI Systems
- 5.2.2. High Field MRI Systems
- 5.2.3. Very Hig
- 5.3. Market Analysis, Insights and Forecast - by Application
- 5.3.1. Oncology
- 5.3.2. Neurology
- 5.3.3. Cardiology
- 5.3.4. Gastroenterology
- 5.3.5. Musculoskeletal
- 5.3.6. Other Applications
- 5.4. Market Analysis, Insights and Forecast - by Region
- 5.4.1. North America
- 5.4.2. South America
- 5.4.3. Europe
- 5.4.4. Middle East & Africa
- 5.4.5. Asia Pacific
- 5.1. Market Analysis, Insights and Forecast - by Architecture
- 6. North America Magnetic Resonance Imaging Market in US Analysis, Insights and Forecast, 2019-2031
- 6.1. Market Analysis, Insights and Forecast - by Architecture
- 6.1.1. Closed MRI Systems
- 6.1.2. Open MRI Systems
- 6.2. Market Analysis, Insights and Forecast - by Field Strength
- 6.2.1. Low Field MRI Systems
- 6.2.2. High Field MRI Systems
- 6.2.3. Very Hig
- 6.3. Market Analysis, Insights and Forecast - by Application
- 6.3.1. Oncology
- 6.3.2. Neurology
- 6.3.3. Cardiology
- 6.3.4. Gastroenterology
- 6.3.5. Musculoskeletal
- 6.3.6. Other Applications
- 6.1. Market Analysis, Insights and Forecast - by Architecture
- 7. South America Magnetic Resonance Imaging Market in US Analysis, Insights and Forecast, 2019-2031
- 7.1. Market Analysis, Insights and Forecast - by Architecture
- 7.1.1. Closed MRI Systems
- 7.1.2. Open MRI Systems
- 7.2. Market Analysis, Insights and Forecast - by Field Strength
- 7.2.1. Low Field MRI Systems
- 7.2.2. High Field MRI Systems
- 7.2.3. Very Hig
- 7.3. Market Analysis, Insights and Forecast - by Application
- 7.3.1. Oncology
- 7.3.2. Neurology
- 7.3.3. Cardiology
- 7.3.4. Gastroenterology
- 7.3.5. Musculoskeletal
- 7.3.6. Other Applications
- 7.1. Market Analysis, Insights and Forecast - by Architecture
- 8. Europe Magnetic Resonance Imaging Market in US Analysis, Insights and Forecast, 2019-2031
- 8.1. Market Analysis, Insights and Forecast - by Architecture
- 8.1.1. Closed MRI Systems
- 8.1.2. Open MRI Systems
- 8.2. Market Analysis, Insights and Forecast - by Field Strength
- 8.2.1. Low Field MRI Systems
- 8.2.2. High Field MRI Systems
- 8.2.3. Very Hig
- 8.3. Market Analysis, Insights and Forecast - by Application
- 8.3.1. Oncology
- 8.3.2. Neurology
- 8.3.3. Cardiology
- 8.3.4. Gastroenterology
- 8.3.5. Musculoskeletal
- 8.3.6. Other Applications
- 8.1. Market Analysis, Insights and Forecast - by Architecture
- 9. Middle East & Africa Magnetic Resonance Imaging Market in US Analysis, Insights and Forecast, 2019-2031
- 9.1. Market Analysis, Insights and Forecast - by Architecture
- 9.1.1. Closed MRI Systems
- 9.1.2. Open MRI Systems
- 9.2. Market Analysis, Insights and Forecast - by Field Strength
- 9.2.1. Low Field MRI Systems
- 9.2.2. High Field MRI Systems
- 9.2.3. Very Hig
- 9.3. Market Analysis, Insights and Forecast - by Application
- 9.3.1. Oncology
- 9.3.2. Neurology
- 9.3.3. Cardiology
- 9.3.4. Gastroenterology
- 9.3.5. Musculoskeletal
- 9.3.6. Other Applications
- 9.1. Market Analysis, Insights and Forecast - by Architecture
- 10. Asia Pacific Magnetic Resonance Imaging Market in US Analysis, Insights and Forecast, 2019-2031
- 10.1. Market Analysis, Insights and Forecast - by Architecture
- 10.1.1. Closed MRI Systems
- 10.1.2. Open MRI Systems
- 10.2. Market Analysis, Insights and Forecast - by Field Strength
- 10.2.1. Low Field MRI Systems
- 10.2.2. High Field MRI Systems
- 10.2.3. Very Hig
- 10.3. Market Analysis, Insights and Forecast - by Application
- 10.3.1. Oncology
- 10.3.2. Neurology
- 10.3.3. Cardiology
- 10.3.4. Gastroenterology
- 10.3.5. Musculoskeletal
- 10.3.6. Other Applications
- 10.1. Market Analysis, Insights and Forecast - by Architecture
- 11. Northeast Magnetic Resonance Imaging Market in US Analysis, Insights and Forecast, 2019-2031
- 12. Southeast Magnetic Resonance Imaging Market in US Analysis, Insights and Forecast, 2019-2031
- 13. Midwest Magnetic Resonance Imaging Market in US Analysis, Insights and Forecast, 2019-2031
- 14. Southwest Magnetic Resonance Imaging Market in US Analysis, Insights and Forecast, 2019-2031
- 15. West Magnetic Resonance Imaging Market in US Analysis, Insights and Forecast, 2019-2031
- 16. Competitive Analysis
- 16.1. Global Market Share Analysis 2024
- 16.2. Company Profiles
- 16.2.1 Siemens Healthcare GmbH
- 16.2.1.1. Overview
- 16.2.1.2. Products
- 16.2.1.3. SWOT Analysis
- 16.2.1.4. Recent Developments
- 16.2.1.5. Financials (Based on Availability)
- 16.2.2 Fonar Corporation*List Not Exhaustive
- 16.2.2.1. Overview
- 16.2.2.2. Products
- 16.2.2.3. SWOT Analysis
- 16.2.2.4. Recent Developments
- 16.2.2.5. Financials (Based on Availability)
- 16.2.3 Canon Inc (Canon Medical Systems Corporation)
- 16.2.3.1. Overview
- 16.2.3.2. Products
- 16.2.3.3. SWOT Analysis
- 16.2.3.4. Recent Developments
- 16.2.3.5. Financials (Based on Availability)
- 16.2.4 Shenzhen Anke High-tech Co Ltd
- 16.2.4.1. Overview
- 16.2.4.2. Products
- 16.2.4.3. SWOT Analysis
- 16.2.4.4. Recent Developments
- 16.2.4.5. Financials (Based on Availability)
- 16.2.5 Esaote SpA
- 16.2.5.1. Overview
- 16.2.5.2. Products
- 16.2.5.3. SWOT Analysis
- 16.2.5.4. Recent Developments
- 16.2.5.5. Financials (Based on Availability)
- 16.2.6 Aurora Imaging Technology
- 16.2.6.1. Overview
- 16.2.6.2. Products
- 16.2.6.3. SWOT Analysis
- 16.2.6.4. Recent Developments
- 16.2.6.5. Financials (Based on Availability)
- 16.2.7 Koninklijke Philips N V
- 16.2.7.1. Overview
- 16.2.7.2. Products
- 16.2.7.3. SWOT Analysis
- 16.2.7.4. Recent Developments
- 16.2.7.5. Financials (Based on Availability)
- 16.2.8 GE HealthCare
- 16.2.8.1. Overview
- 16.2.8.2. Products
- 16.2.8.3. SWOT Analysis
- 16.2.8.4. Recent Developments
- 16.2.8.5. Financials (Based on Availability)
- 16.2.9 Neusoft Medical Systems Co Ltd
- 16.2.9.1. Overview
- 16.2.9.2. Products
- 16.2.9.3. SWOT Analysis
- 16.2.9.4. Recent Developments
- 16.2.9.5. Financials (Based on Availability)
- 16.2.10 Fujifilm Holdings Corporation
- 16.2.10.1. Overview
- 16.2.10.2. Products
- 16.2.10.3. SWOT Analysis
- 16.2.10.4. Recent Developments
- 16.2.10.5. Financials (Based on Availability)
- 16.2.1 Siemens Healthcare GmbH
List of Figures
- Figure 1: Global Magnetic Resonance Imaging Market in US Revenue Breakdown (Million, %) by Region 2024 & 2032
- Figure 2: Global Magnetic Resonance Imaging Market in US Volume Breakdown (Piece, %) by Region 2024 & 2032
- Figure 3: United states Magnetic Resonance Imaging Market in US Revenue (Million), by Country 2024 & 2032
- Figure 4: United states Magnetic Resonance Imaging Market in US Volume (Piece), by Country 2024 & 2032
- Figure 5: United states Magnetic Resonance Imaging Market in US Revenue Share (%), by Country 2024 & 2032
- Figure 6: United states Magnetic Resonance Imaging Market in US Volume Share (%), by Country 2024 & 2032
- Figure 7: North America Magnetic Resonance Imaging Market in US Revenue (Million), by Architecture 2024 & 2032
- Figure 8: North America Magnetic Resonance Imaging Market in US Volume (Piece), by Architecture 2024 & 2032
- Figure 9: North America Magnetic Resonance Imaging Market in US Revenue Share (%), by Architecture 2024 & 2032
- Figure 10: North America Magnetic Resonance Imaging Market in US Volume Share (%), by Architecture 2024 & 2032
- Figure 11: North America Magnetic Resonance Imaging Market in US Revenue (Million), by Field Strength 2024 & 2032
- Figure 12: North America Magnetic Resonance Imaging Market in US Volume (Piece), by Field Strength 2024 & 2032
- Figure 13: North America Magnetic Resonance Imaging Market in US Revenue Share (%), by Field Strength 2024 & 2032
- Figure 14: North America Magnetic Resonance Imaging Market in US Volume Share (%), by Field Strength 2024 & 2032
- Figure 15: North America Magnetic Resonance Imaging Market in US Revenue (Million), by Application 2024 & 2032
- Figure 16: North America Magnetic Resonance Imaging Market in US Volume (Piece), by Application 2024 & 2032
- Figure 17: North America Magnetic Resonance Imaging Market in US Revenue Share (%), by Application 2024 & 2032
- Figure 18: North America Magnetic Resonance Imaging Market in US Volume Share (%), by Application 2024 & 2032
- Figure 19: North America Magnetic Resonance Imaging Market in US Revenue (Million), by Country 2024 & 2032
- Figure 20: North America Magnetic Resonance Imaging Market in US Volume (Piece), by Country 2024 & 2032
- Figure 21: North America Magnetic Resonance Imaging Market in US Revenue Share (%), by Country 2024 & 2032
- Figure 22: North America Magnetic Resonance Imaging Market in US Volume Share (%), by Country 2024 & 2032
- Figure 23: South America Magnetic Resonance Imaging Market in US Revenue (Million), by Architecture 2024 & 2032
- Figure 24: South America Magnetic Resonance Imaging Market in US Volume (Piece), by Architecture 2024 & 2032
- Figure 25: South America Magnetic Resonance Imaging Market in US Revenue Share (%), by Architecture 2024 & 2032
- Figure 26: South America Magnetic Resonance Imaging Market in US Volume Share (%), by Architecture 2024 & 2032
- Figure 27: South America Magnetic Resonance Imaging Market in US Revenue (Million), by Field Strength 2024 & 2032
- Figure 28: South America Magnetic Resonance Imaging Market in US Volume (Piece), by Field Strength 2024 & 2032
- Figure 29: South America Magnetic Resonance Imaging Market in US Revenue Share (%), by Field Strength 2024 & 2032
- Figure 30: South America Magnetic Resonance Imaging Market in US Volume Share (%), by Field Strength 2024 & 2032
- Figure 31: South America Magnetic Resonance Imaging Market in US Revenue (Million), by Application 2024 & 2032
- Figure 32: South America Magnetic Resonance Imaging Market in US Volume (Piece), by Application 2024 & 2032
- Figure 33: South America Magnetic Resonance Imaging Market in US Revenue Share (%), by Application 2024 & 2032
- Figure 34: South America Magnetic Resonance Imaging Market in US Volume Share (%), by Application 2024 & 2032
- Figure 35: South America Magnetic Resonance Imaging Market in US Revenue (Million), by Country 2024 & 2032
- Figure 36: South America Magnetic Resonance Imaging Market in US Volume (Piece), by Country 2024 & 2032
- Figure 37: South America Magnetic Resonance Imaging Market in US Revenue Share (%), by Country 2024 & 2032
- Figure 38: South America Magnetic Resonance Imaging Market in US Volume Share (%), by Country 2024 & 2032
- Figure 39: Europe Magnetic Resonance Imaging Market in US Revenue (Million), by Architecture 2024 & 2032
- Figure 40: Europe Magnetic Resonance Imaging Market in US Volume (Piece), by Architecture 2024 & 2032
- Figure 41: Europe Magnetic Resonance Imaging Market in US Revenue Share (%), by Architecture 2024 & 2032
- Figure 42: Europe Magnetic Resonance Imaging Market in US Volume Share (%), by Architecture 2024 & 2032
- Figure 43: Europe Magnetic Resonance Imaging Market in US Revenue (Million), by Field Strength 2024 & 2032
- Figure 44: Europe Magnetic Resonance Imaging Market in US Volume (Piece), by Field Strength 2024 & 2032
- Figure 45: Europe Magnetic Resonance Imaging Market in US Revenue Share (%), by Field Strength 2024 & 2032
- Figure 46: Europe Magnetic Resonance Imaging Market in US Volume Share (%), by Field Strength 2024 & 2032
- Figure 47: Europe Magnetic Resonance Imaging Market in US Revenue (Million), by Application 2024 & 2032
- Figure 48: Europe Magnetic Resonance Imaging Market in US Volume (Piece), by Application 2024 & 2032
- Figure 49: Europe Magnetic Resonance Imaging Market in US Revenue Share (%), by Application 2024 & 2032
- Figure 50: Europe Magnetic Resonance Imaging Market in US Volume Share (%), by Application 2024 & 2032
- Figure 51: Europe Magnetic Resonance Imaging Market in US Revenue (Million), by Country 2024 & 2032
- Figure 52: Europe Magnetic Resonance Imaging Market in US Volume (Piece), by Country 2024 & 2032
- Figure 53: Europe Magnetic Resonance Imaging Market in US Revenue Share (%), by Country 2024 & 2032
- Figure 54: Europe Magnetic Resonance Imaging Market in US Volume Share (%), by Country 2024 & 2032
- Figure 55: Middle East & Africa Magnetic Resonance Imaging Market in US Revenue (Million), by Architecture 2024 & 2032
- Figure 56: Middle East & Africa Magnetic Resonance Imaging Market in US Volume (Piece), by Architecture 2024 & 2032
- Figure 57: Middle East & Africa Magnetic Resonance Imaging Market in US Revenue Share (%), by Architecture 2024 & 2032
- Figure 58: Middle East & Africa Magnetic Resonance Imaging Market in US Volume Share (%), by Architecture 2024 & 2032
- Figure 59: Middle East & Africa Magnetic Resonance Imaging Market in US Revenue (Million), by Field Strength 2024 & 2032
- Figure 60: Middle East & Africa Magnetic Resonance Imaging Market in US Volume (Piece), by Field Strength 2024 & 2032
- Figure 61: Middle East & Africa Magnetic Resonance Imaging Market in US Revenue Share (%), by Field Strength 2024 & 2032
- Figure 62: Middle East & Africa Magnetic Resonance Imaging Market in US Volume Share (%), by Field Strength 2024 & 2032
- Figure 63: Middle East & Africa Magnetic Resonance Imaging Market in US Revenue (Million), by Application 2024 & 2032
- Figure 64: Middle East & Africa Magnetic Resonance Imaging Market in US Volume (Piece), by Application 2024 & 2032
- Figure 65: Middle East & Africa Magnetic Resonance Imaging Market in US Revenue Share (%), by Application 2024 & 2032
- Figure 66: Middle East & Africa Magnetic Resonance Imaging Market in US Volume Share (%), by Application 2024 & 2032
- Figure 67: Middle East & Africa Magnetic Resonance Imaging Market in US Revenue (Million), by Country 2024 & 2032
- Figure 68: Middle East & Africa Magnetic Resonance Imaging Market in US Volume (Piece), by Country 2024 & 2032
- Figure 69: Middle East & Africa Magnetic Resonance Imaging Market in US Revenue Share (%), by Country 2024 & 2032
- Figure 70: Middle East & Africa Magnetic Resonance Imaging Market in US Volume Share (%), by Country 2024 & 2032
- Figure 71: Asia Pacific Magnetic Resonance Imaging Market in US Revenue (Million), by Architecture 2024 & 2032
- Figure 72: Asia Pacific Magnetic Resonance Imaging Market in US Volume (Piece), by Architecture 2024 & 2032
- Figure 73: Asia Pacific Magnetic Resonance Imaging Market in US Revenue Share (%), by Architecture 2024 & 2032
- Figure 74: Asia Pacific Magnetic Resonance Imaging Market in US Volume Share (%), by Architecture 2024 & 2032
- Figure 75: Asia Pacific Magnetic Resonance Imaging Market in US Revenue (Million), by Field Strength 2024 & 2032
- Figure 76: Asia Pacific Magnetic Resonance Imaging Market in US Volume (Piece), by Field Strength 2024 & 2032
- Figure 77: Asia Pacific Magnetic Resonance Imaging Market in US Revenue Share (%), by Field Strength 2024 & 2032
- Figure 78: Asia Pacific Magnetic Resonance Imaging Market in US Volume Share (%), by Field Strength 2024 & 2032
- Figure 79: Asia Pacific Magnetic Resonance Imaging Market in US Revenue (Million), by Application 2024 & 2032
- Figure 80: Asia Pacific Magnetic Resonance Imaging Market in US Volume (Piece), by Application 2024 & 2032
- Figure 81: Asia Pacific Magnetic Resonance Imaging Market in US Revenue Share (%), by Application 2024 & 2032
- Figure 82: Asia Pacific Magnetic Resonance Imaging Market in US Volume Share (%), by Application 2024 & 2032
- Figure 83: Asia Pacific Magnetic Resonance Imaging Market in US Revenue (Million), by Country 2024 & 2032
- Figure 84: Asia Pacific Magnetic Resonance Imaging Market in US Volume (Piece), by Country 2024 & 2032
- Figure 85: Asia Pacific Magnetic Resonance Imaging Market in US Revenue Share (%), by Country 2024 & 2032
- Figure 86: Asia Pacific Magnetic Resonance Imaging Market in US Volume Share (%), by Country 2024 & 2032
List of Tables
- Table 1: Global Magnetic Resonance Imaging Market in US Revenue Million Forecast, by Region 2019 & 2032
- Table 2: Global Magnetic Resonance Imaging Market in US Volume Piece Forecast, by Region 2019 & 2032
- Table 3: Global Magnetic Resonance Imaging Market in US Revenue Million Forecast, by Architecture 2019 & 2032
- Table 4: Global Magnetic Resonance Imaging Market in US Volume Piece Forecast, by Architecture 2019 & 2032
- Table 5: Global Magnetic Resonance Imaging Market in US Revenue Million Forecast, by Field Strength 2019 & 2032
- Table 6: Global Magnetic Resonance Imaging Market in US Volume Piece Forecast, by Field Strength 2019 & 2032
- Table 7: Global Magnetic Resonance Imaging Market in US Revenue Million Forecast, by Application 2019 & 2032
- Table 8: Global Magnetic Resonance Imaging Market in US Volume Piece Forecast, by Application 2019 & 2032
- Table 9: Global Magnetic Resonance Imaging Market in US Revenue Million Forecast, by Region 2019 & 2032
- Table 10: Global Magnetic Resonance Imaging Market in US Volume Piece Forecast, by Region 2019 & 2032
- Table 11: Global Magnetic Resonance Imaging Market in US Revenue Million Forecast, by Country 2019 & 2032
- Table 12: Global Magnetic Resonance Imaging Market in US Volume Piece Forecast, by Country 2019 & 2032
- Table 13: Northeast Magnetic Resonance Imaging Market in US Revenue (Million) Forecast, by Application 2019 & 2032
- Table 14: Northeast Magnetic Resonance Imaging Market in US Volume (Piece) Forecast, by Application 2019 & 2032
- Table 15: Southeast Magnetic Resonance Imaging Market in US Revenue (Million) Forecast, by Application 2019 & 2032
- Table 16: Southeast Magnetic Resonance Imaging Market in US Volume (Piece) Forecast, by Application 2019 & 2032
- Table 17: Midwest Magnetic Resonance Imaging Market in US Revenue (Million) Forecast, by Application 2019 & 2032
- Table 18: Midwest Magnetic Resonance Imaging Market in US Volume (Piece) Forecast, by Application 2019 & 2032
- Table 19: Southwest Magnetic Resonance Imaging Market in US Revenue (Million) Forecast, by Application 2019 & 2032
- Table 20: Southwest Magnetic Resonance Imaging Market in US Volume (Piece) Forecast, by Application 2019 & 2032
- Table 21: West Magnetic Resonance Imaging Market in US Revenue (Million) Forecast, by Application 2019 & 2032
- Table 22: West Magnetic Resonance Imaging Market in US Volume (Piece) Forecast, by Application 2019 & 2032
- Table 23: Global Magnetic Resonance Imaging Market in US Revenue Million Forecast, by Architecture 2019 & 2032
- Table 24: Global Magnetic Resonance Imaging Market in US Volume Piece Forecast, by Architecture 2019 & 2032
- Table 25: Global Magnetic Resonance Imaging Market in US Revenue Million Forecast, by Field Strength 2019 & 2032
- Table 26: Global Magnetic Resonance Imaging Market in US Volume Piece Forecast, by Field Strength 2019 & 2032
- Table 27: Global Magnetic Resonance Imaging Market in US Revenue Million Forecast, by Application 2019 & 2032
- Table 28: Global Magnetic Resonance Imaging Market in US Volume Piece Forecast, by Application 2019 & 2032
- Table 29: Global Magnetic Resonance Imaging Market in US Revenue Million Forecast, by Country 2019 & 2032
- Table 30: Global Magnetic Resonance Imaging Market in US Volume Piece Forecast, by Country 2019 & 2032
- Table 31: United States Magnetic Resonance Imaging Market in US Revenue (Million) Forecast, by Application 2019 & 2032
- Table 32: United States Magnetic Resonance Imaging Market in US Volume (Piece) Forecast, by Application 2019 & 2032
- Table 33: Canada Magnetic Resonance Imaging Market in US Revenue (Million) Forecast, by Application 2019 & 2032
- Table 34: Canada Magnetic Resonance Imaging Market in US Volume (Piece) Forecast, by Application 2019 & 2032
- Table 35: Mexico Magnetic Resonance Imaging Market in US Revenue (Million) Forecast, by Application 2019 & 2032
- Table 36: Mexico Magnetic Resonance Imaging Market in US Volume (Piece) Forecast, by Application 2019 & 2032
- Table 37: Global Magnetic Resonance Imaging Market in US Revenue Million Forecast, by Architecture 2019 & 2032
- Table 38: Global Magnetic Resonance Imaging Market in US Volume Piece Forecast, by Architecture 2019 & 2032
- Table 39: Global Magnetic Resonance Imaging Market in US Revenue Million Forecast, by Field Strength 2019 & 2032
- Table 40: Global Magnetic Resonance Imaging Market in US Volume Piece Forecast, by Field Strength 2019 & 2032
- Table 41: Global Magnetic Resonance Imaging Market in US Revenue Million Forecast, by Application 2019 & 2032
- Table 42: Global Magnetic Resonance Imaging Market in US Volume Piece Forecast, by Application 2019 & 2032
- Table 43: Global Magnetic Resonance Imaging Market in US Revenue Million Forecast, by Country 2019 & 2032
- Table 44: Global Magnetic Resonance Imaging Market in US Volume Piece Forecast, by Country 2019 & 2032
- Table 45: Brazil Magnetic Resonance Imaging Market in US Revenue (Million) Forecast, by Application 2019 & 2032
- Table 46: Brazil Magnetic Resonance Imaging Market in US Volume (Piece) Forecast, by Application 2019 & 2032
- Table 47: Argentina Magnetic Resonance Imaging Market in US Revenue (Million) Forecast, by Application 2019 & 2032
- Table 48: Argentina Magnetic Resonance Imaging Market in US Volume (Piece) Forecast, by Application 2019 & 2032
- Table 49: Rest of South America Magnetic Resonance Imaging Market in US Revenue (Million) Forecast, by Application 2019 & 2032
- Table 50: Rest of South America Magnetic Resonance Imaging Market in US Volume (Piece) Forecast, by Application 2019 & 2032
- Table 51: Global Magnetic Resonance Imaging Market in US Revenue Million Forecast, by Architecture 2019 & 2032
- Table 52: Global Magnetic Resonance Imaging Market in US Volume Piece Forecast, by Architecture 2019 & 2032
- Table 53: Global Magnetic Resonance Imaging Market in US Revenue Million Forecast, by Field Strength 2019 & 2032
- Table 54: Global Magnetic Resonance Imaging Market in US Volume Piece Forecast, by Field Strength 2019 & 2032
- Table 55: Global Magnetic Resonance Imaging Market in US Revenue Million Forecast, by Application 2019 & 2032
- Table 56: Global Magnetic Resonance Imaging Market in US Volume Piece Forecast, by Application 2019 & 2032
- Table 57: Global Magnetic Resonance Imaging Market in US Revenue Million Forecast, by Country 2019 & 2032
- Table 58: Global Magnetic Resonance Imaging Market in US Volume Piece Forecast, by Country 2019 & 2032
- Table 59: United Kingdom Magnetic Resonance Imaging Market in US Revenue (Million) Forecast, by Application 2019 & 2032
- Table 60: United Kingdom Magnetic Resonance Imaging Market in US Volume (Piece) Forecast, by Application 2019 & 2032
- Table 61: Germany Magnetic Resonance Imaging Market in US Revenue (Million) Forecast, by Application 2019 & 2032
- Table 62: Germany Magnetic Resonance Imaging Market in US Volume (Piece) Forecast, by Application 2019 & 2032
- Table 63: France Magnetic Resonance Imaging Market in US Revenue (Million) Forecast, by Application 2019 & 2032
- Table 64: France Magnetic Resonance Imaging Market in US Volume (Piece) Forecast, by Application 2019 & 2032
- Table 65: Italy Magnetic Resonance Imaging Market in US Revenue (Million) Forecast, by Application 2019 & 2032
- Table 66: Italy Magnetic Resonance Imaging Market in US Volume (Piece) Forecast, by Application 2019 & 2032
- Table 67: Spain Magnetic Resonance Imaging Market in US Revenue (Million) Forecast, by Application 2019 & 2032
- Table 68: Spain Magnetic Resonance Imaging Market in US Volume (Piece) Forecast, by Application 2019 & 2032
- Table 69: Russia Magnetic Resonance Imaging Market in US Revenue (Million) Forecast, by Application 2019 & 2032
- Table 70: Russia Magnetic Resonance Imaging Market in US Volume (Piece) Forecast, by Application 2019 & 2032
- Table 71: Benelux Magnetic Resonance Imaging Market in US Revenue (Million) Forecast, by Application 2019 & 2032
- Table 72: Benelux Magnetic Resonance Imaging Market in US Volume (Piece) Forecast, by Application 2019 & 2032
- Table 73: Nordics Magnetic Resonance Imaging Market in US Revenue (Million) Forecast, by Application 2019 & 2032
- Table 74: Nordics Magnetic Resonance Imaging Market in US Volume (Piece) Forecast, by Application 2019 & 2032
- Table 75: Rest of Europe Magnetic Resonance Imaging Market in US Revenue (Million) Forecast, by Application 2019 & 2032
- Table 76: Rest of Europe Magnetic Resonance Imaging Market in US Volume (Piece) Forecast, by Application 2019 & 2032
- Table 77: Global Magnetic Resonance Imaging Market in US Revenue Million Forecast, by Architecture 2019 & 2032
- Table 78: Global Magnetic Resonance Imaging Market in US Volume Piece Forecast, by Architecture 2019 & 2032
- Table 79: Global Magnetic Resonance Imaging Market in US Revenue Million Forecast, by Field Strength 2019 & 2032
- Table 80: Global Magnetic Resonance Imaging Market in US Volume Piece Forecast, by Field Strength 2019 & 2032
- Table 81: Global Magnetic Resonance Imaging Market in US Revenue Million Forecast, by Application 2019 & 2032
- Table 82: Global Magnetic Resonance Imaging Market in US Volume Piece Forecast, by Application 2019 & 2032
- Table 83: Global Magnetic Resonance Imaging Market in US Revenue Million Forecast, by Country 2019 & 2032
- Table 84: Global Magnetic Resonance Imaging Market in US Volume Piece Forecast, by Country 2019 & 2032
- Table 85: Turkey Magnetic Resonance Imaging Market in US Revenue (Million) Forecast, by Application 2019 & 2032
- Table 86: Turkey Magnetic Resonance Imaging Market in US Volume (Piece) Forecast, by Application 2019 & 2032
- Table 87: Israel Magnetic Resonance Imaging Market in US Revenue (Million) Forecast, by Application 2019 & 2032
- Table 88: Israel Magnetic Resonance Imaging Market in US Volume (Piece) Forecast, by Application 2019 & 2032
- Table 89: GCC Magnetic Resonance Imaging Market in US Revenue (Million) Forecast, by Application 2019 & 2032
- Table 90: GCC Magnetic Resonance Imaging Market in US Volume (Piece) Forecast, by Application 2019 & 2032
- Table 91: North Africa Magnetic Resonance Imaging Market in US Revenue (Million) Forecast, by Application 2019 & 2032
- Table 92: North Africa Magnetic Resonance Imaging Market in US Volume (Piece) Forecast, by Application 2019 & 2032
- Table 93: South Africa Magnetic Resonance Imaging Market in US Revenue (Million) Forecast, by Application 2019 & 2032
- Table 94: South Africa Magnetic Resonance Imaging Market in US Volume (Piece) Forecast, by Application 2019 & 2032
- Table 95: Rest of Middle East & Africa Magnetic Resonance Imaging Market in US Revenue (Million) Forecast, by Application 2019 & 2032
- Table 96: Rest of Middle East & Africa Magnetic Resonance Imaging Market in US Volume (Piece) Forecast, by Application 2019 & 2032
- Table 97: Global Magnetic Resonance Imaging Market in US Revenue Million Forecast, by Architecture 2019 & 2032
- Table 98: Global Magnetic Resonance Imaging Market in US Volume Piece Forecast, by Architecture 2019 & 2032
- Table 99: Global Magnetic Resonance Imaging Market in US Revenue Million Forecast, by Field Strength 2019 & 2032
- Table 100: Global Magnetic Resonance Imaging Market in US Volume Piece Forecast, by Field Strength 2019 & 2032
- Table 101: Global Magnetic Resonance Imaging Market in US Revenue Million Forecast, by Application 2019 & 2032
- Table 102: Global Magnetic Resonance Imaging Market in US Volume Piece Forecast, by Application 2019 & 2032
- Table 103: Global Magnetic Resonance Imaging Market in US Revenue Million Forecast, by Country 2019 & 2032
- Table 104: Global Magnetic Resonance Imaging Market in US Volume Piece Forecast, by Country 2019 & 2032
- Table 105: China Magnetic Resonance Imaging Market in US Revenue (Million) Forecast, by Application 2019 & 2032
- Table 106: China Magnetic Resonance Imaging Market in US Volume (Piece) Forecast, by Application 2019 & 2032
- Table 107: India Magnetic Resonance Imaging Market in US Revenue (Million) Forecast, by Application 2019 & 2032
- Table 108: India Magnetic Resonance Imaging Market in US Volume (Piece) Forecast, by Application 2019 & 2032
- Table 109: Japan Magnetic Resonance Imaging Market in US Revenue (Million) Forecast, by Application 2019 & 2032
- Table 110: Japan Magnetic Resonance Imaging Market in US Volume (Piece) Forecast, by Application 2019 & 2032
- Table 111: South Korea Magnetic Resonance Imaging Market in US Revenue (Million) Forecast, by Application 2019 & 2032
- Table 112: South Korea Magnetic Resonance Imaging Market in US Volume (Piece) Forecast, by Application 2019 & 2032
- Table 113: ASEAN Magnetic Resonance Imaging Market in US Revenue (Million) Forecast, by Application 2019 & 2032
- Table 114: ASEAN Magnetic Resonance Imaging Market in US Volume (Piece) Forecast, by Application 2019 & 2032
- Table 115: Oceania Magnetic Resonance Imaging Market in US Revenue (Million) Forecast, by Application 2019 & 2032
- Table 116: Oceania Magnetic Resonance Imaging Market in US Volume (Piece) Forecast, by Application 2019 & 2032
- Table 117: Rest of Asia Pacific Magnetic Resonance Imaging Market in US Revenue (Million) Forecast, by Application 2019 & 2032
- Table 118: Rest of Asia Pacific Magnetic Resonance Imaging Market in US Volume (Piece) Forecast, by Application 2019 & 2032
Frequently Asked Questions
1. What is the projected Compound Annual Growth Rate (CAGR) of the Magnetic Resonance Imaging Market in US?
The projected CAGR is approximately 5.95%.
2. Which companies are prominent players in the Magnetic Resonance Imaging Market in US?
Key companies in the market include Siemens Healthcare GmbH, Fonar Corporation*List Not Exhaustive, Canon Inc (Canon Medical Systems Corporation), Shenzhen Anke High-tech Co Ltd, Esaote SpA, Aurora Imaging Technology, Koninklijke Philips N V, GE HealthCare, Neusoft Medical Systems Co Ltd, Fujifilm Holdings Corporation.
3. What are the main segments of the Magnetic Resonance Imaging Market in US?
The market segments include Architecture, Field Strength, Application.
4. Can you provide details about the market size?
The market size is estimated to be USD 3.42 Million as of 2022.
5. What are some drivers contributing to market growth?
Growing Burden of Chronic Diseases; Advancements in MRI Systems and Availability of Universal Health Coverage.
6. What are the notable trends driving market growth?
Neurology Segment is Expected to Witness Significant Growth Over the Forecast Period.
7. Are there any restraints impacting market growth?
High Cost of MRI Systems.
8. Can you provide examples of recent developments in the market?
June 2023: GE HealthCare launched its FDA-cleared Sonic DL, a state-of-the-art deep learning-based technology designed to dramatically accelerate image acquisition in magnetic resonance imaging (MRI). Sonic DL enables new imaging paradigms, such as high-quality cardiac MRI in a single heartbeat.
9. What pricing options are available for accessing the report?
Pricing options include single-user, multi-user, and enterprise licenses priced at USD 3800, USD 4500, and USD 5800 respectively.
10. Is the market size provided in terms of value or volume?
The market size is provided in terms of value, measured in Million and volume, measured in Piece.
11. Are there any specific market keywords associated with the report?
Yes, the market keyword associated with the report is "Magnetic Resonance Imaging Market in US," which aids in identifying and referencing the specific market segment covered.
12. How do I determine which pricing option suits my needs best?
The pricing options vary based on user requirements and access needs. Individual users may opt for single-user licenses, while businesses requiring broader access may choose multi-user or enterprise licenses for cost-effective access to the report.
13. Are there any additional resources or data provided in the Magnetic Resonance Imaging Market in US report?
While the report offers comprehensive insights, it's advisable to review the specific contents or supplementary materials provided to ascertain if additional resources or data are available.
14. How can I stay updated on further developments or reports in the Magnetic Resonance Imaging Market in US?
To stay informed about further developments, trends, and reports in the Magnetic Resonance Imaging Market in US, consider subscribing to industry newsletters, following relevant companies and organizations, or regularly checking reputable industry news sources and publications.
Methodology
Step 1 - Identification of Relevant Samples Size from Population Database


Step 2 - Approaches for Defining Global Market Size (Value, Volume* & Price*)

Note*: In applicable scenarios
Step 3 - Data Sources
Primary Research
- Web Analytics
- Survey Reports
- Research Institute
- Latest Research Reports
- Opinion Leaders
Secondary Research
- Annual Reports
- White Paper
- Latest Press Release
- Industry Association
- Paid Database
- Investor Presentations

Step 4 - Data Triangulation
Involves using different sources of information in order to increase the validity of a study
These sources are likely to be stakeholders in a program - participants, other researchers, program staff, other community members, and so on.
Then we put all data in single framework & apply various statistical tools to find out the dynamic on the market.
During the analysis stage, feedback from the stakeholder groups would be compared to determine areas of agreement as well as areas of divergence


