
Key Insights
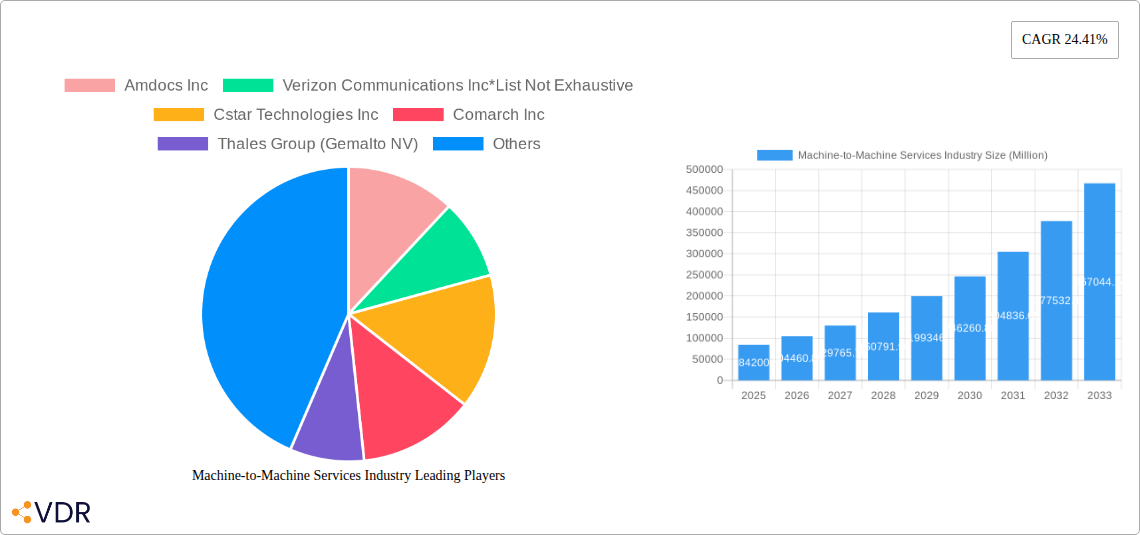
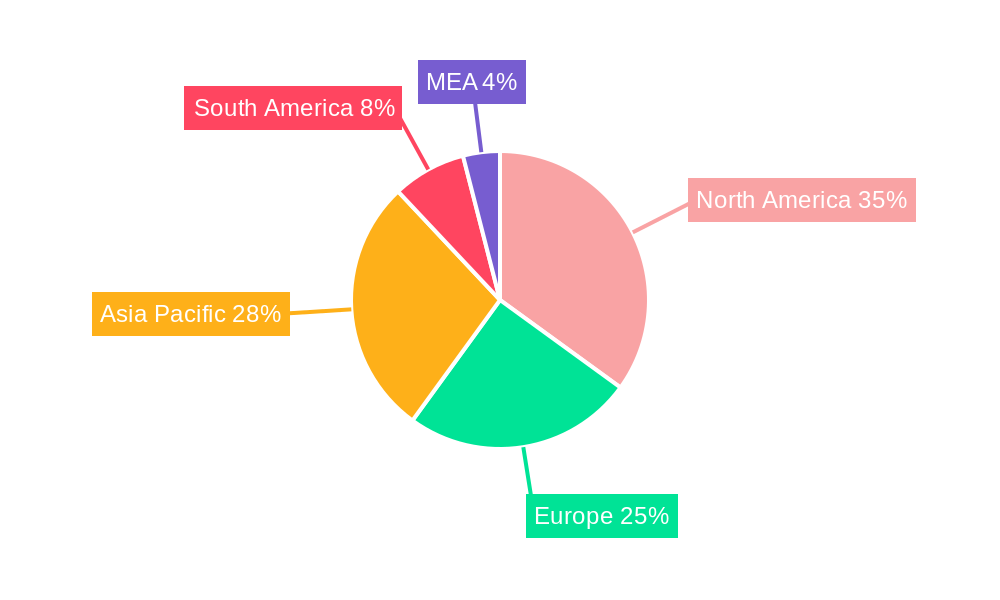
The Machine-to-Machine (M2M) services market is experiencing robust growth, projected to reach \$84.20 billion in 2025 and exhibiting a Compound Annual Growth Rate (CAGR) of 24.41%. This expansion is driven by several key factors. The increasing adoption of IoT (Internet of Things) devices across diverse sectors like retail, banking, and telecommunications fuels the demand for seamless connectivity and data management solutions offered by M2M services. Furthermore, the rise of smart cities and the need for efficient infrastructure management are significant contributors. The managed services segment, characterized by its cost-effectiveness and ease of implementation, dominates the market. However, the professional services segment is witnessing significant growth due to the increasing need for specialized expertise in M2M deployment and integration. Geographically, North America currently holds a substantial market share, owing to early adoption and a robust technological infrastructure. However, rapid digitalization in Asia-Pacific is expected to drive significant market growth in this region over the forecast period. The automotive, healthcare, and oil & gas industries are showing particularly strong adoption rates, demanding advanced M2M solutions for remote monitoring, predictive maintenance, and improved operational efficiency. Competition is intensifying among established players like Amdocs, Verizon, and Cisco, along with emerging technology providers, driving innovation and fostering a competitive pricing landscape.
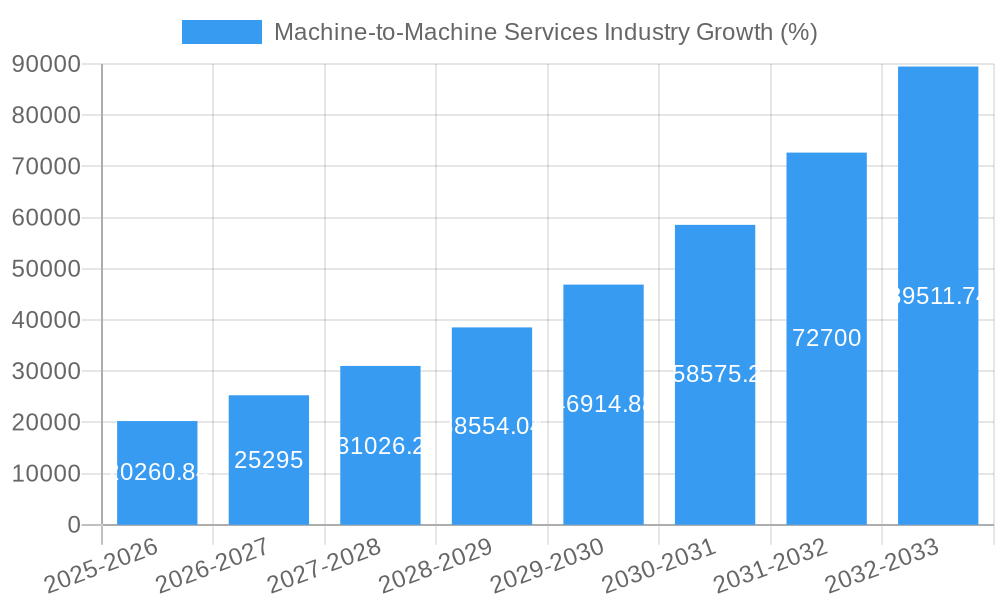
The forecast period (2025-2033) promises sustained growth, propelled by ongoing technological advancements in areas like 5G connectivity, edge computing, and AI-driven analytics, which will further enhance the capabilities and applications of M2M services. While regulatory hurdles and security concerns pose challenges, the overall market outlook remains positive. The continued expansion of IoT devices and the rising adoption of M2M solutions across various sectors indicate a strong future for this dynamic market. Factors such as increasing data security concerns and the need for robust cybersecurity measures will influence market growth. Nevertheless, the overall trend points toward a significant expansion of the M2M services market in the coming years.
Machine-to-Machine (M2M) Services Market Report: 2019-2033
This comprehensive report provides an in-depth analysis of the Machine-to-Machine (M2M) services market, encompassing market size, growth trends, key players, and future outlook. The study period covers 2019-2033, with 2025 as the base and estimated year. This report is essential for industry professionals, investors, and strategists seeking a clear understanding of this rapidly evolving sector. The report projects a xx Million units market value by 2033, showcasing significant growth potential across various segments and geographies.
Machine-to-Machine Services Industry Market Dynamics & Structure
The M2M services market is characterized by moderate concentration, with several large players and numerous smaller niche providers. Technological innovation, driven by advancements in IoT, 5G, and AI, is a primary growth driver. Regulatory frameworks, particularly concerning data security and privacy, significantly impact market dynamics. Competitive substitutes, such as traditional wired communication systems, exist but are gradually losing ground to the cost-effectiveness and flexibility of M2M solutions. End-user demographics are expanding, with increasing adoption across various sectors. M&A activity has been steadily increasing, with larger companies acquiring smaller firms to consolidate market share and expand their technological capabilities.
- Market Concentration: Moderately concentrated, with a few dominant players holding xx% market share.
- Technological Innovation: Rapid advancements in 5G, AI, and edge computing are major drivers.
- Regulatory Frameworks: Data security and privacy regulations are key influencing factors.
- Competitive Substitutes: Traditional wired communication systems pose some level of competition.
- End-User Demographics: Expanding adoption across Retail, Banking, Telecom, Healthcare, and other sectors.
- M&A Trends: Steady increase in mergers and acquisitions, with xx deals recorded in the last 5 years.
Machine-to-Machine Services Industry Growth Trends & Insights
The M2M services market experienced significant growth during the historical period (2019-2024), with a CAGR of xx%. This growth is attributed to the increasing adoption of IoT devices across various industries, driving demand for reliable and secure M2M connectivity solutions. Technological disruptions, such as the widespread adoption of 5G and the rise of edge computing, are further accelerating market growth. Consumer behavior shifts towards smart devices and connected services also contribute to market expansion. The forecast period (2025-2033) anticipates continued growth, driven by the growing demand for real-time data analytics and automation across industries, with a projected CAGR of xx% leading to a market value of xx Million units by 2033. Market penetration is expected to reach xx% by 2033.
Dominant Regions, Countries, or Segments in Machine-to-Machine Services Industry
North America currently holds the largest market share in the M2M services industry due to early adoption of advanced technologies and robust infrastructure. However, Asia-Pacific is projected to exhibit the fastest growth rate, driven by rapidly expanding IoT deployments and increasing government support. Within the segments, the Managed Services category dominates, accounting for xx% of the market share due to its cost-effectiveness and ease of management. The Telecom and IT Industry segment leads in end-user adoption, fueled by the high demand for network infrastructure and data management.
- Key Drivers for North America: Advanced technological infrastructure, high investment in R&D, and early adoption of IoT.
- Key Drivers for Asia-Pacific: Rapid IoT adoption, growing government investments in digital infrastructure, and increasing smartphone penetration.
- Dominant Segment (By Type): Managed Services – xx% market share, driven by cost-effectiveness and ease of management.
- Dominant Segment (By End User): Telecom and IT Industry – xx% market share, driven by the high demand for reliable network infrastructure.
Machine-to-Machine Services Industry Product Landscape
The M2M services market offers a wide range of products, including embedded SIM (eSIM) technology, secure connectivity solutions, data analytics platforms, and remote device management tools. Recent innovations focus on enhanced security features, improved data transmission speeds, and integration with cloud-based platforms. Unique selling propositions (USPs) often center on superior reliability, scalability, and cost-efficiency. Advancements in technologies like AI and machine learning are enabling intelligent M2M solutions that can optimize performance and predict potential issues.
Key Drivers, Barriers & Challenges in Machine-to-Machine Services Industry
Key Drivers: The increasing adoption of IoT devices, advancements in 5G technology, and the growing demand for real-time data analytics are propelling market growth. Government initiatives supporting digital transformation and the expansion of smart city projects further accelerate market expansion.
Key Challenges: Security concerns related to data breaches and cyberattacks remain a major challenge. Interoperability issues between different M2M devices and platforms also present an obstacle. Furthermore, the high cost of implementation and a lack of skilled professionals can hinder widespread adoption. Supply chain disruptions and regulatory complexities contribute to challenges in growth.
Emerging Opportunities in Machine-to-Machine Services Industry
Emerging opportunities lie in the expansion of M2M services into new and untapped markets, such as smart agriculture, smart homes, and industrial automation. The integration of AI and machine learning capabilities into M2M solutions offers significant potential for improving efficiency and creating new value-added services. The development of low-power wide-area networks (LPWAN) is opening up new possibilities for connecting low-power, long-range devices.
Growth Accelerators in the Machine-to-Machine Services Industry
Technological advancements in areas like 5G, AI, and edge computing are significantly driving growth. Strategic partnerships between technology providers and industry-specific companies are expanding market reach and application possibilities. Governments worldwide are investing in infrastructure development and digital transformation initiatives, fueling the market's expansion into new sectors.
Key Players Shaping the Machine-to-Machine Services Industry Market
- Amdocs Inc
- Verizon Communications Inc
- Cstar Technologies Inc
- Comarch Inc
- Thales Group (Gemalto NV)
- Huawei Technologies Co Ltd
- Rogers Communications Inc
- Cisco System Inc
- International Business Machine Corporation
- Nokia Corp (Alcatel-Lucent S A)
- EE Ltd
- Intel Corporation
Notable Milestones in Machine-to-Machine Services Industry Sector
- November 2023: Ericsson launches an AI-powered transport controller for optimizing mobile networks.
- February 2023: A5G Networks partners with Intel Smart Edge for enhanced edge computing solutions.
- June 2022: STMicroelectronics launches the ST4SIM-201 eSIM for 5G M2M communication.
- June 2022: M2M Germany collaborates with Wattsense for building digitization solutions.
In-Depth Machine-to-Machine Services Industry Market Outlook
The M2M services market holds immense potential for growth, driven by ongoing technological advancements, the expansion of IoT applications, and increasing government support for digital transformation initiatives. Strategic partnerships and innovative business models are further accelerating market expansion. The market is expected to witness significant growth across various sectors, creating lucrative opportunities for both established players and new entrants. Focus on providing secure, reliable, and scalable solutions will be key to success in this dynamic market.
Machine-to-Machine Services Industry Segmentation
-
1. Type
- 1.1. Managed Service
- 1.2. Professional Service
-
2. End User
- 2.1. Retail
- 2.2. Banking and Financial Institution
- 2.3. Telecom and IT Industry
- 2.4. Healthcare
- 2.5. Automotive
- 2.6. Oil and Gas
- 2.7. Transportation
Machine-to-Machine Services Industry Segmentation By Geography
- 1. North America
- 2. Europe
- 3. Asia Pacific
- 4. Latin America
- 5. Middle East
Machine-to-Machine Services Industry REPORT HIGHLIGHTS
| Aspects | Details |
|---|---|
| Study Period | 2019-2033 |
| Base Year | 2024 |
| Estimated Year | 2025 |
| Forecast Period | 2025-2033 |
| Historical Period | 2019-2024 |
| Growth Rate | CAGR of 24.41% from 2019-2033 |
| Segmentation |
|
Table of Contents
- 1. Introduction
- 1.1. Research Scope
- 1.2. Market Segmentation
- 1.3. Research Methodology
- 1.4. Definitions and Assumptions
- 2. Executive Summary
- 2.1. Introduction
- 3. Market Dynamics
- 3.1. Introduction
- 3.2. Market Drivers
- 3.2.1. Rapid Technological Advancements; Increasing Number of Connected Devices
- 3.3. Market Restrains
- 3.3.1. Lack of Standardization; Huge Delivery Cost
- 3.4. Market Trends
- 3.4.1. Telecom Industry to Witness Significant Growth Among Other End-user Verticals
- 4. Market Factor Analysis
- 4.1. Porters Five Forces
- 4.2. Supply/Value Chain
- 4.3. PESTEL analysis
- 4.4. Market Entropy
- 4.5. Patent/Trademark Analysis
- 5. Global Machine-to-Machine Services Industry Analysis, Insights and Forecast, 2019-2031
- 5.1. Market Analysis, Insights and Forecast - by Type
- 5.1.1. Managed Service
- 5.1.2. Professional Service
- 5.2. Market Analysis, Insights and Forecast - by End User
- 5.2.1. Retail
- 5.2.2. Banking and Financial Institution
- 5.2.3. Telecom and IT Industry
- 5.2.4. Healthcare
- 5.2.5. Automotive
- 5.2.6. Oil and Gas
- 5.2.7. Transportation
- 5.3. Market Analysis, Insights and Forecast - by Region
- 5.3.1. North America
- 5.3.2. Europe
- 5.3.3. Asia Pacific
- 5.3.4. Latin America
- 5.3.5. Middle East
- 5.1. Market Analysis, Insights and Forecast - by Type
- 6. North America Machine-to-Machine Services Industry Analysis, Insights and Forecast, 2019-2031
- 6.1. Market Analysis, Insights and Forecast - by Type
- 6.1.1. Managed Service
- 6.1.2. Professional Service
- 6.2. Market Analysis, Insights and Forecast - by End User
- 6.2.1. Retail
- 6.2.2. Banking and Financial Institution
- 6.2.3. Telecom and IT Industry
- 6.2.4. Healthcare
- 6.2.5. Automotive
- 6.2.6. Oil and Gas
- 6.2.7. Transportation
- 6.1. Market Analysis, Insights and Forecast - by Type
- 7. Europe Machine-to-Machine Services Industry Analysis, Insights and Forecast, 2019-2031
- 7.1. Market Analysis, Insights and Forecast - by Type
- 7.1.1. Managed Service
- 7.1.2. Professional Service
- 7.2. Market Analysis, Insights and Forecast - by End User
- 7.2.1. Retail
- 7.2.2. Banking and Financial Institution
- 7.2.3. Telecom and IT Industry
- 7.2.4. Healthcare
- 7.2.5. Automotive
- 7.2.6. Oil and Gas
- 7.2.7. Transportation
- 7.1. Market Analysis, Insights and Forecast - by Type
- 8. Asia Pacific Machine-to-Machine Services Industry Analysis, Insights and Forecast, 2019-2031
- 8.1. Market Analysis, Insights and Forecast - by Type
- 8.1.1. Managed Service
- 8.1.2. Professional Service
- 8.2. Market Analysis, Insights and Forecast - by End User
- 8.2.1. Retail
- 8.2.2. Banking and Financial Institution
- 8.2.3. Telecom and IT Industry
- 8.2.4. Healthcare
- 8.2.5. Automotive
- 8.2.6. Oil and Gas
- 8.2.7. Transportation
- 8.1. Market Analysis, Insights and Forecast - by Type
- 9. Latin America Machine-to-Machine Services Industry Analysis, Insights and Forecast, 2019-2031
- 9.1. Market Analysis, Insights and Forecast - by Type
- 9.1.1. Managed Service
- 9.1.2. Professional Service
- 9.2. Market Analysis, Insights and Forecast - by End User
- 9.2.1. Retail
- 9.2.2. Banking and Financial Institution
- 9.2.3. Telecom and IT Industry
- 9.2.4. Healthcare
- 9.2.5. Automotive
- 9.2.6. Oil and Gas
- 9.2.7. Transportation
- 9.1. Market Analysis, Insights and Forecast - by Type
- 10. Middle East Machine-to-Machine Services Industry Analysis, Insights and Forecast, 2019-2031
- 10.1. Market Analysis, Insights and Forecast - by Type
- 10.1.1. Managed Service
- 10.1.2. Professional Service
- 10.2. Market Analysis, Insights and Forecast - by End User
- 10.2.1. Retail
- 10.2.2. Banking and Financial Institution
- 10.2.3. Telecom and IT Industry
- 10.2.4. Healthcare
- 10.2.5. Automotive
- 10.2.6. Oil and Gas
- 10.2.7. Transportation
- 10.1. Market Analysis, Insights and Forecast - by Type
- 11. North America Machine-to-Machine Services Industry Analysis, Insights and Forecast, 2019-2031
- 11.1. Market Analysis, Insights and Forecast - By Country/Sub-region
- 11.1.1 United States
- 11.1.2 Canada
- 11.1.3 Mexico
- 12. Europe Machine-to-Machine Services Industry Analysis, Insights and Forecast, 2019-2031
- 12.1. Market Analysis, Insights and Forecast - By Country/Sub-region
- 12.1.1 Germany
- 12.1.2 United Kingdom
- 12.1.3 France
- 12.1.4 Spain
- 12.1.5 Italy
- 12.1.6 Spain
- 12.1.7 Belgium
- 12.1.8 Netherland
- 12.1.9 Nordics
- 12.1.10 Rest of Europe
- 13. Asia Pacific Machine-to-Machine Services Industry Analysis, Insights and Forecast, 2019-2031
- 13.1. Market Analysis, Insights and Forecast - By Country/Sub-region
- 13.1.1 China
- 13.1.2 Japan
- 13.1.3 India
- 13.1.4 South Korea
- 13.1.5 Southeast Asia
- 13.1.6 Australia
- 13.1.7 Indonesia
- 13.1.8 Phillipes
- 13.1.9 Singapore
- 13.1.10 Thailandc
- 13.1.11 Rest of Asia Pacific
- 14. South America Machine-to-Machine Services Industry Analysis, Insights and Forecast, 2019-2031
- 14.1. Market Analysis, Insights and Forecast - By Country/Sub-region
- 14.1.1 Brazil
- 14.1.2 Argentina
- 14.1.3 Peru
- 14.1.4 Chile
- 14.1.5 Colombia
- 14.1.6 Ecuador
- 14.1.7 Venezuela
- 14.1.8 Rest of South America
- 15. North America Machine-to-Machine Services Industry Analysis, Insights and Forecast, 2019-2031
- 15.1. Market Analysis, Insights and Forecast - By Country/Sub-region
- 15.1.1 United States
- 15.1.2 Canada
- 15.1.3 Mexico
- 16. MEA Machine-to-Machine Services Industry Analysis, Insights and Forecast, 2019-2031
- 16.1. Market Analysis, Insights and Forecast - By Country/Sub-region
- 16.1.1 United Arab Emirates
- 16.1.2 Saudi Arabia
- 16.1.3 South Africa
- 16.1.4 Rest of Middle East and Africa
- 17. Competitive Analysis
- 17.1. Global Market Share Analysis 2024
- 17.2. Company Profiles
- 17.2.1 Amdocs Inc
- 17.2.1.1. Overview
- 17.2.1.2. Products
- 17.2.1.3. SWOT Analysis
- 17.2.1.4. Recent Developments
- 17.2.1.5. Financials (Based on Availability)
- 17.2.2 Verizon Communications Inc*List Not Exhaustive
- 17.2.2.1. Overview
- 17.2.2.2. Products
- 17.2.2.3. SWOT Analysis
- 17.2.2.4. Recent Developments
- 17.2.2.5. Financials (Based on Availability)
- 17.2.3 Cstar Technologies Inc
- 17.2.3.1. Overview
- 17.2.3.2. Products
- 17.2.3.3. SWOT Analysis
- 17.2.3.4. Recent Developments
- 17.2.3.5. Financials (Based on Availability)
- 17.2.4 Comarch Inc
- 17.2.4.1. Overview
- 17.2.4.2. Products
- 17.2.4.3. SWOT Analysis
- 17.2.4.4. Recent Developments
- 17.2.4.5. Financials (Based on Availability)
- 17.2.5 Thales Group (Gemalto NV)
- 17.2.5.1. Overview
- 17.2.5.2. Products
- 17.2.5.3. SWOT Analysis
- 17.2.5.4. Recent Developments
- 17.2.5.5. Financials (Based on Availability)
- 17.2.6 Huawei Technologies Co Ltd
- 17.2.6.1. Overview
- 17.2.6.2. Products
- 17.2.6.3. SWOT Analysis
- 17.2.6.4. Recent Developments
- 17.2.6.5. Financials (Based on Availability)
- 17.2.7 Rogers Communications Inc
- 17.2.7.1. Overview
- 17.2.7.2. Products
- 17.2.7.3. SWOT Analysis
- 17.2.7.4. Recent Developments
- 17.2.7.5. Financials (Based on Availability)
- 17.2.8 Cisco System Inc
- 17.2.8.1. Overview
- 17.2.8.2. Products
- 17.2.8.3. SWOT Analysis
- 17.2.8.4. Recent Developments
- 17.2.8.5. Financials (Based on Availability)
- 17.2.9 International Business Machine Corporation
- 17.2.9.1. Overview
- 17.2.9.2. Products
- 17.2.9.3. SWOT Analysis
- 17.2.9.4. Recent Developments
- 17.2.9.5. Financials (Based on Availability)
- 17.2.10 Nokia Corp (Alcatel-Lucent S A )
- 17.2.10.1. Overview
- 17.2.10.2. Products
- 17.2.10.3. SWOT Analysis
- 17.2.10.4. Recent Developments
- 17.2.10.5. Financials (Based on Availability)
- 17.2.11 EE Ltd
- 17.2.11.1. Overview
- 17.2.11.2. Products
- 17.2.11.3. SWOT Analysis
- 17.2.11.4. Recent Developments
- 17.2.11.5. Financials (Based on Availability)
- 17.2.12 Intel Corporation
- 17.2.12.1. Overview
- 17.2.12.2. Products
- 17.2.12.3. SWOT Analysis
- 17.2.12.4. Recent Developments
- 17.2.12.5. Financials (Based on Availability)
- 17.2.1 Amdocs Inc
List of Figures
- Figure 1: Global Machine-to-Machine Services Industry Revenue Breakdown (Million, %) by Region 2024 & 2032
- Figure 2: North America Machine-to-Machine Services Industry Revenue (Million), by Country 2024 & 2032
- Figure 3: North America Machine-to-Machine Services Industry Revenue Share (%), by Country 2024 & 2032
- Figure 4: Europe Machine-to-Machine Services Industry Revenue (Million), by Country 2024 & 2032
- Figure 5: Europe Machine-to-Machine Services Industry Revenue Share (%), by Country 2024 & 2032
- Figure 6: Asia Pacific Machine-to-Machine Services Industry Revenue (Million), by Country 2024 & 2032
- Figure 7: Asia Pacific Machine-to-Machine Services Industry Revenue Share (%), by Country 2024 & 2032
- Figure 8: South America Machine-to-Machine Services Industry Revenue (Million), by Country 2024 & 2032
- Figure 9: South America Machine-to-Machine Services Industry Revenue Share (%), by Country 2024 & 2032
- Figure 10: North America Machine-to-Machine Services Industry Revenue (Million), by Country 2024 & 2032
- Figure 11: North America Machine-to-Machine Services Industry Revenue Share (%), by Country 2024 & 2032
- Figure 12: MEA Machine-to-Machine Services Industry Revenue (Million), by Country 2024 & 2032
- Figure 13: MEA Machine-to-Machine Services Industry Revenue Share (%), by Country 2024 & 2032
- Figure 14: North America Machine-to-Machine Services Industry Revenue (Million), by Type 2024 & 2032
- Figure 15: North America Machine-to-Machine Services Industry Revenue Share (%), by Type 2024 & 2032
- Figure 16: North America Machine-to-Machine Services Industry Revenue (Million), by End User 2024 & 2032
- Figure 17: North America Machine-to-Machine Services Industry Revenue Share (%), by End User 2024 & 2032
- Figure 18: North America Machine-to-Machine Services Industry Revenue (Million), by Country 2024 & 2032
- Figure 19: North America Machine-to-Machine Services Industry Revenue Share (%), by Country 2024 & 2032
- Figure 20: Europe Machine-to-Machine Services Industry Revenue (Million), by Type 2024 & 2032
- Figure 21: Europe Machine-to-Machine Services Industry Revenue Share (%), by Type 2024 & 2032
- Figure 22: Europe Machine-to-Machine Services Industry Revenue (Million), by End User 2024 & 2032
- Figure 23: Europe Machine-to-Machine Services Industry Revenue Share (%), by End User 2024 & 2032
- Figure 24: Europe Machine-to-Machine Services Industry Revenue (Million), by Country 2024 & 2032
- Figure 25: Europe Machine-to-Machine Services Industry Revenue Share (%), by Country 2024 & 2032
- Figure 26: Asia Pacific Machine-to-Machine Services Industry Revenue (Million), by Type 2024 & 2032
- Figure 27: Asia Pacific Machine-to-Machine Services Industry Revenue Share (%), by Type 2024 & 2032
- Figure 28: Asia Pacific Machine-to-Machine Services Industry Revenue (Million), by End User 2024 & 2032
- Figure 29: Asia Pacific Machine-to-Machine Services Industry Revenue Share (%), by End User 2024 & 2032
- Figure 30: Asia Pacific Machine-to-Machine Services Industry Revenue (Million), by Country 2024 & 2032
- Figure 31: Asia Pacific Machine-to-Machine Services Industry Revenue Share (%), by Country 2024 & 2032
- Figure 32: Latin America Machine-to-Machine Services Industry Revenue (Million), by Type 2024 & 2032
- Figure 33: Latin America Machine-to-Machine Services Industry Revenue Share (%), by Type 2024 & 2032
- Figure 34: Latin America Machine-to-Machine Services Industry Revenue (Million), by End User 2024 & 2032
- Figure 35: Latin America Machine-to-Machine Services Industry Revenue Share (%), by End User 2024 & 2032
- Figure 36: Latin America Machine-to-Machine Services Industry Revenue (Million), by Country 2024 & 2032
- Figure 37: Latin America Machine-to-Machine Services Industry Revenue Share (%), by Country 2024 & 2032
- Figure 38: Middle East Machine-to-Machine Services Industry Revenue (Million), by Type 2024 & 2032
- Figure 39: Middle East Machine-to-Machine Services Industry Revenue Share (%), by Type 2024 & 2032
- Figure 40: Middle East Machine-to-Machine Services Industry Revenue (Million), by End User 2024 & 2032
- Figure 41: Middle East Machine-to-Machine Services Industry Revenue Share (%), by End User 2024 & 2032
- Figure 42: Middle East Machine-to-Machine Services Industry Revenue (Million), by Country 2024 & 2032
- Figure 43: Middle East Machine-to-Machine Services Industry Revenue Share (%), by Country 2024 & 2032
List of Tables
- Table 1: Global Machine-to-Machine Services Industry Revenue Million Forecast, by Region 2019 & 2032
- Table 2: Global Machine-to-Machine Services Industry Revenue Million Forecast, by Type 2019 & 2032
- Table 3: Global Machine-to-Machine Services Industry Revenue Million Forecast, by End User 2019 & 2032
- Table 4: Global Machine-to-Machine Services Industry Revenue Million Forecast, by Region 2019 & 2032
- Table 5: Global Machine-to-Machine Services Industry Revenue Million Forecast, by Country 2019 & 2032
- Table 6: United States Machine-to-Machine Services Industry Revenue (Million) Forecast, by Application 2019 & 2032
- Table 7: Canada Machine-to-Machine Services Industry Revenue (Million) Forecast, by Application 2019 & 2032
- Table 8: Mexico Machine-to-Machine Services Industry Revenue (Million) Forecast, by Application 2019 & 2032
- Table 9: Global Machine-to-Machine Services Industry Revenue Million Forecast, by Country 2019 & 2032
- Table 10: Germany Machine-to-Machine Services Industry Revenue (Million) Forecast, by Application 2019 & 2032
- Table 11: United Kingdom Machine-to-Machine Services Industry Revenue (Million) Forecast, by Application 2019 & 2032
- Table 12: France Machine-to-Machine Services Industry Revenue (Million) Forecast, by Application 2019 & 2032
- Table 13: Spain Machine-to-Machine Services Industry Revenue (Million) Forecast, by Application 2019 & 2032
- Table 14: Italy Machine-to-Machine Services Industry Revenue (Million) Forecast, by Application 2019 & 2032
- Table 15: Spain Machine-to-Machine Services Industry Revenue (Million) Forecast, by Application 2019 & 2032
- Table 16: Belgium Machine-to-Machine Services Industry Revenue (Million) Forecast, by Application 2019 & 2032
- Table 17: Netherland Machine-to-Machine Services Industry Revenue (Million) Forecast, by Application 2019 & 2032
- Table 18: Nordics Machine-to-Machine Services Industry Revenue (Million) Forecast, by Application 2019 & 2032
- Table 19: Rest of Europe Machine-to-Machine Services Industry Revenue (Million) Forecast, by Application 2019 & 2032
- Table 20: Global Machine-to-Machine Services Industry Revenue Million Forecast, by Country 2019 & 2032
- Table 21: China Machine-to-Machine Services Industry Revenue (Million) Forecast, by Application 2019 & 2032
- Table 22: Japan Machine-to-Machine Services Industry Revenue (Million) Forecast, by Application 2019 & 2032
- Table 23: India Machine-to-Machine Services Industry Revenue (Million) Forecast, by Application 2019 & 2032
- Table 24: South Korea Machine-to-Machine Services Industry Revenue (Million) Forecast, by Application 2019 & 2032
- Table 25: Southeast Asia Machine-to-Machine Services Industry Revenue (Million) Forecast, by Application 2019 & 2032
- Table 26: Australia Machine-to-Machine Services Industry Revenue (Million) Forecast, by Application 2019 & 2032
- Table 27: Indonesia Machine-to-Machine Services Industry Revenue (Million) Forecast, by Application 2019 & 2032
- Table 28: Phillipes Machine-to-Machine Services Industry Revenue (Million) Forecast, by Application 2019 & 2032
- Table 29: Singapore Machine-to-Machine Services Industry Revenue (Million) Forecast, by Application 2019 & 2032
- Table 30: Thailandc Machine-to-Machine Services Industry Revenue (Million) Forecast, by Application 2019 & 2032
- Table 31: Rest of Asia Pacific Machine-to-Machine Services Industry Revenue (Million) Forecast, by Application 2019 & 2032
- Table 32: Global Machine-to-Machine Services Industry Revenue Million Forecast, by Country 2019 & 2032
- Table 33: Brazil Machine-to-Machine Services Industry Revenue (Million) Forecast, by Application 2019 & 2032
- Table 34: Argentina Machine-to-Machine Services Industry Revenue (Million) Forecast, by Application 2019 & 2032
- Table 35: Peru Machine-to-Machine Services Industry Revenue (Million) Forecast, by Application 2019 & 2032
- Table 36: Chile Machine-to-Machine Services Industry Revenue (Million) Forecast, by Application 2019 & 2032
- Table 37: Colombia Machine-to-Machine Services Industry Revenue (Million) Forecast, by Application 2019 & 2032
- Table 38: Ecuador Machine-to-Machine Services Industry Revenue (Million) Forecast, by Application 2019 & 2032
- Table 39: Venezuela Machine-to-Machine Services Industry Revenue (Million) Forecast, by Application 2019 & 2032
- Table 40: Rest of South America Machine-to-Machine Services Industry Revenue (Million) Forecast, by Application 2019 & 2032
- Table 41: Global Machine-to-Machine Services Industry Revenue Million Forecast, by Country 2019 & 2032
- Table 42: United States Machine-to-Machine Services Industry Revenue (Million) Forecast, by Application 2019 & 2032
- Table 43: Canada Machine-to-Machine Services Industry Revenue (Million) Forecast, by Application 2019 & 2032
- Table 44: Mexico Machine-to-Machine Services Industry Revenue (Million) Forecast, by Application 2019 & 2032
- Table 45: Global Machine-to-Machine Services Industry Revenue Million Forecast, by Country 2019 & 2032
- Table 46: United Arab Emirates Machine-to-Machine Services Industry Revenue (Million) Forecast, by Application 2019 & 2032
- Table 47: Saudi Arabia Machine-to-Machine Services Industry Revenue (Million) Forecast, by Application 2019 & 2032
- Table 48: South Africa Machine-to-Machine Services Industry Revenue (Million) Forecast, by Application 2019 & 2032
- Table 49: Rest of Middle East and Africa Machine-to-Machine Services Industry Revenue (Million) Forecast, by Application 2019 & 2032
- Table 50: Global Machine-to-Machine Services Industry Revenue Million Forecast, by Type 2019 & 2032
- Table 51: Global Machine-to-Machine Services Industry Revenue Million Forecast, by End User 2019 & 2032
- Table 52: Global Machine-to-Machine Services Industry Revenue Million Forecast, by Country 2019 & 2032
- Table 53: Global Machine-to-Machine Services Industry Revenue Million Forecast, by Type 2019 & 2032
- Table 54: Global Machine-to-Machine Services Industry Revenue Million Forecast, by End User 2019 & 2032
- Table 55: Global Machine-to-Machine Services Industry Revenue Million Forecast, by Country 2019 & 2032
- Table 56: Global Machine-to-Machine Services Industry Revenue Million Forecast, by Type 2019 & 2032
- Table 57: Global Machine-to-Machine Services Industry Revenue Million Forecast, by End User 2019 & 2032
- Table 58: Global Machine-to-Machine Services Industry Revenue Million Forecast, by Country 2019 & 2032
- Table 59: Global Machine-to-Machine Services Industry Revenue Million Forecast, by Type 2019 & 2032
- Table 60: Global Machine-to-Machine Services Industry Revenue Million Forecast, by End User 2019 & 2032
- Table 61: Global Machine-to-Machine Services Industry Revenue Million Forecast, by Country 2019 & 2032
- Table 62: Global Machine-to-Machine Services Industry Revenue Million Forecast, by Type 2019 & 2032
- Table 63: Global Machine-to-Machine Services Industry Revenue Million Forecast, by End User 2019 & 2032
- Table 64: Global Machine-to-Machine Services Industry Revenue Million Forecast, by Country 2019 & 2032
Frequently Asked Questions
1. What is the projected Compound Annual Growth Rate (CAGR) of the Machine-to-Machine Services Industry?
The projected CAGR is approximately 24.41%.
2. Which companies are prominent players in the Machine-to-Machine Services Industry?
Key companies in the market include Amdocs Inc, Verizon Communications Inc*List Not Exhaustive, Cstar Technologies Inc, Comarch Inc, Thales Group (Gemalto NV), Huawei Technologies Co Ltd, Rogers Communications Inc, Cisco System Inc, International Business Machine Corporation, Nokia Corp (Alcatel-Lucent S A ), EE Ltd, Intel Corporation.
3. What are the main segments of the Machine-to-Machine Services Industry?
The market segments include Type, End User.
4. Can you provide details about the market size?
The market size is estimated to be USD 84.20 Million as of 2022.
5. What are some drivers contributing to market growth?
Rapid Technological Advancements; Increasing Number of Connected Devices.
6. What are the notable trends driving market growth?
Telecom Industry to Witness Significant Growth Among Other End-user Verticals.
7. Are there any restraints impacting market growth?
Lack of Standardization; Huge Delivery Cost.
8. Can you provide examples of recent developments in the market?
November 2023 : Ericsson has launched an intelligent, cloud-native transport controller that uses artificial intelligence and machine learning to analyze and automate microwave, IP and optical networks, providing communications service providers (CSPs) with an advanced solution for maximizing mobile transport network efficiency.
9. What pricing options are available for accessing the report?
Pricing options include single-user, multi-user, and enterprise licenses priced at USD 4750, USD 5250, and USD 8750 respectively.
10. Is the market size provided in terms of value or volume?
The market size is provided in terms of value, measured in Million.
11. Are there any specific market keywords associated with the report?
Yes, the market keyword associated with the report is "Machine-to-Machine Services Industry," which aids in identifying and referencing the specific market segment covered.
12. How do I determine which pricing option suits my needs best?
The pricing options vary based on user requirements and access needs. Individual users may opt for single-user licenses, while businesses requiring broader access may choose multi-user or enterprise licenses for cost-effective access to the report.
13. Are there any additional resources or data provided in the Machine-to-Machine Services Industry report?
While the report offers comprehensive insights, it's advisable to review the specific contents or supplementary materials provided to ascertain if additional resources or data are available.
14. How can I stay updated on further developments or reports in the Machine-to-Machine Services Industry?
To stay informed about further developments, trends, and reports in the Machine-to-Machine Services Industry, consider subscribing to industry newsletters, following relevant companies and organizations, or regularly checking reputable industry news sources and publications.
Methodology
Step 1 - Identification of Relevant Samples Size from Population Database


Step 2 - Approaches for Defining Global Market Size (Value, Volume* & Price*)

Note*: In applicable scenarios
Step 3 - Data Sources
Primary Research
- Web Analytics
- Survey Reports
- Research Institute
- Latest Research Reports
- Opinion Leaders
Secondary Research
- Annual Reports
- White Paper
- Latest Press Release
- Industry Association
- Paid Database
- Investor Presentations

Step 4 - Data Triangulation
Involves using different sources of information in order to increase the validity of a study
These sources are likely to be stakeholders in a program - participants, other researchers, program staff, other community members, and so on.
Then we put all data in single framework & apply various statistical tools to find out the dynamic on the market.
During the analysis stage, feedback from the stakeholder groups would be compared to determine areas of agreement as well as areas of divergence


