
Key Insights
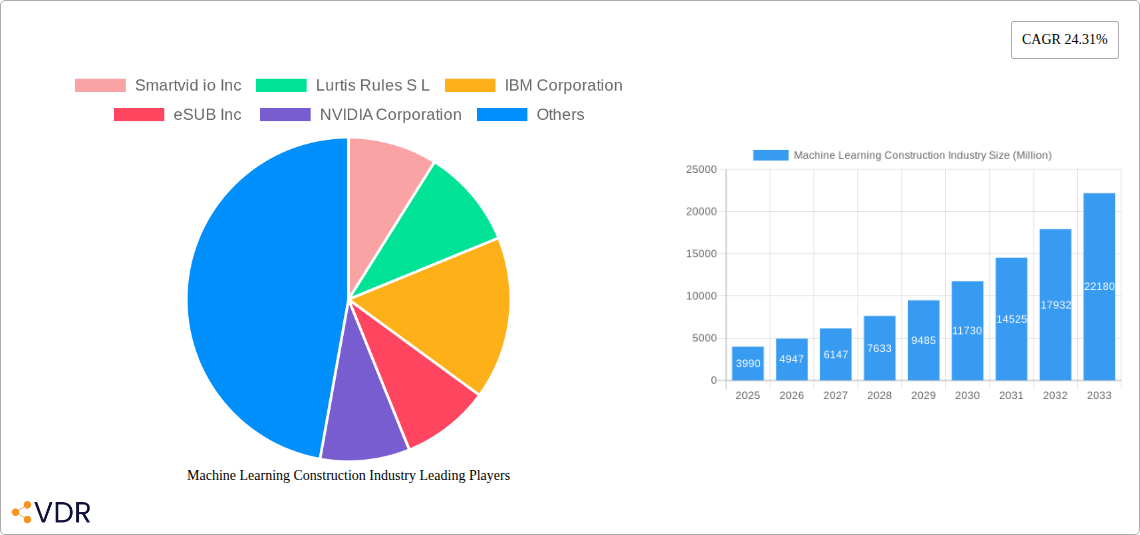
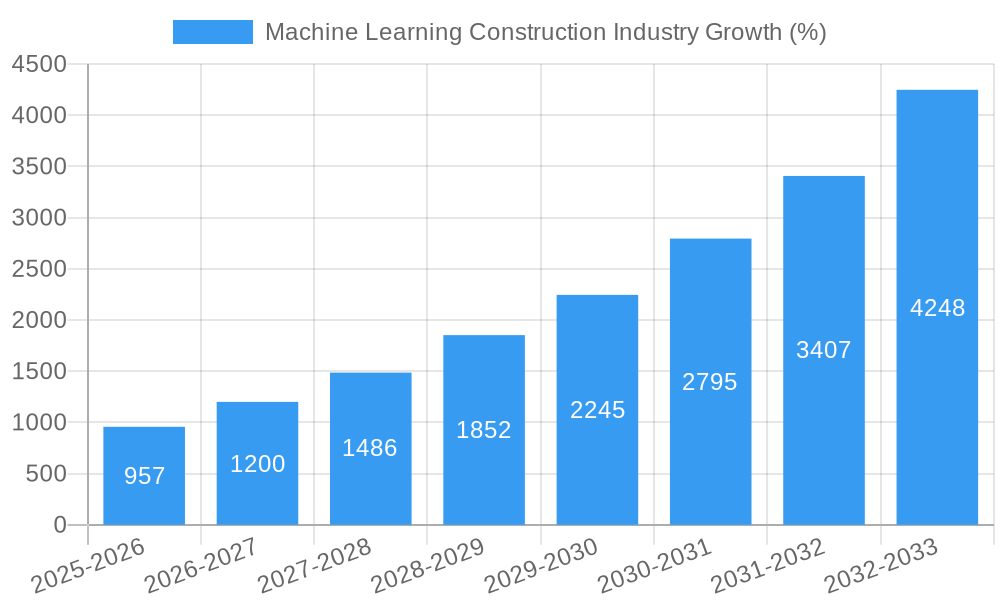
The Machine Learning (ML) Construction market is experiencing explosive growth, projected to reach \$3.99 billion in 2025 and expanding at a remarkable Compound Annual Growth Rate (CAGR) of 24.31% from 2025 to 2033. This surge is driven by several key factors. Firstly, the increasing complexity of construction projects necessitates more efficient planning, design, and risk management strategies. ML algorithms excel at analyzing vast datasets to optimize resource allocation, predict potential delays, and enhance safety protocols. Secondly, the rise of autonomous equipment and Building Information Modeling (BIM) integration creates a wealth of data ripe for ML analysis, enabling predictive maintenance, improved quality control, and reduced operational costs. The adoption of digital twins and advanced analytics further bolsters the market's expansion, allowing for real-time monitoring and proactive issue resolution. Finally, the growing awareness of the benefits of data-driven decision-making within the construction sector is propelling widespread adoption of ML solutions. Major players like IBM, Autodesk, and Microsoft are actively investing in this space, further fueling market growth.
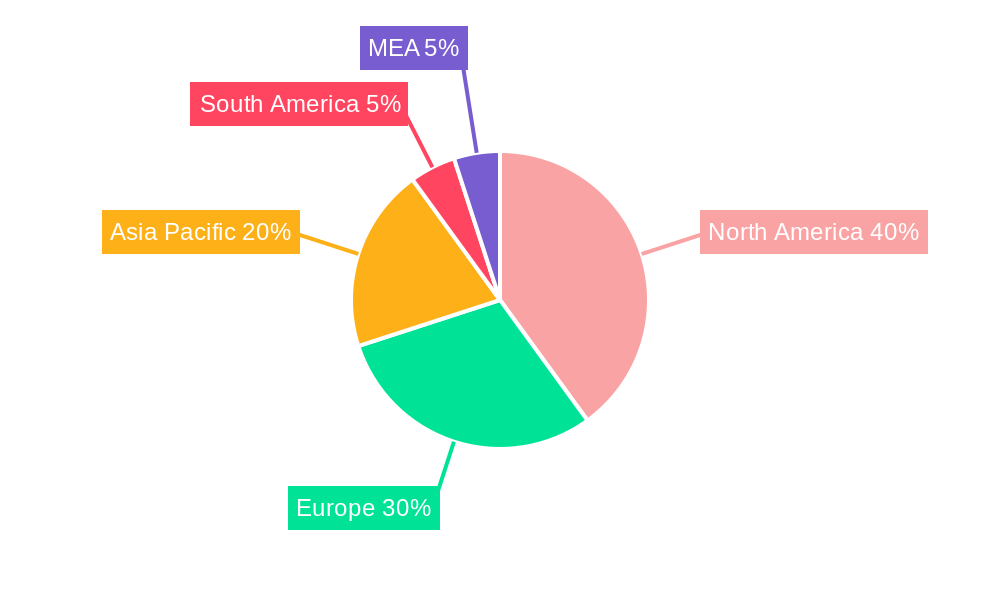
Market segmentation reveals significant opportunities across various applications. Planning and design benefit from ML's ability to optimize layouts, material selection, and scheduling. Safety applications leverage ML for risk assessment, incident prediction, and worker safety monitoring. Autonomous equipment relies heavily on ML for navigation, control, and operational efficiency. Finally, monitoring and maintenance see significant improvements through predictive analytics, reducing downtime and extending asset lifespan. Geographically, North America currently holds a leading market share, however, the Asia-Pacific region is poised for rapid growth due to increasing infrastructure development and the adoption of advanced technologies. While data security concerns and the need for skilled professionals pose some challenges, the overall market outlook remains exceptionally positive, driven by technological advancements and the inherent need for improved efficiency and productivity within the construction industry.
Machine Learning Construction Industry Market Report: 2019-2033
This comprehensive report delivers an in-depth analysis of the Machine Learning Construction Industry market, projecting significant growth from 2025 to 2033. It examines market dynamics, growth trends, regional dominance, product innovation, key challenges, emerging opportunities, and the leading players shaping this transformative sector. The report uses data from 2019-2024 as the historical period, 2025 as the base and estimated year, and projects the market until 2033. The parent market is the Construction Industry, while the child market is specifically the adoption of Machine Learning technologies within it.
Machine Learning Construction Industry Market Dynamics & Structure
The Machine Learning Construction Industry market is experiencing rapid expansion driven by technological advancements, increasing data availability, and the need for improved efficiency and safety within the construction sector. Market concentration is currently moderate, with several key players vying for market share, but the potential for consolidation through mergers and acquisitions (M&A) is significant. The market size in 2025 is estimated at $XX Million and is expected to reach $XX Million by 2033.
- Market Concentration: Moderate, with the top 5 players holding an estimated xx% market share in 2025.
- Technological Innovation Drivers: AI-powered project management tools, autonomous equipment, and predictive maintenance software.
- Regulatory Frameworks: Varying regulations across regions impacting adoption rates and data privacy.
- Competitive Product Substitutes: Traditional methods of construction management and limited adoption of alternatives.
- End-User Demographics: Large construction firms and government entities are early adopters; smaller firms lag behind.
- M&A Trends: Increasing M&A activity to expand capabilities and consolidate market share, with an estimated xx deals in 2024. Examples include Briq's acquisition of Swipez (September 2022).
Machine Learning Construction Industry Growth Trends & Insights
The Machine Learning Construction Industry is experiencing robust growth, driven by rising demand for efficient and sustainable construction practices. The market is witnessing high adoption rates among large construction companies seeking to enhance productivity and reduce costs. Technological disruptions, such as the development of advanced AI algorithms and the increasing availability of IoT devices, are further fueling market expansion. Consumer behavior is shifting toward the adoption of technology for project management, safety, and cost optimization.
- Market Size Evolution: The market value is projected to grow at a Compound Annual Growth Rate (CAGR) of xx% from 2025 to 2033.
- Adoption Rates: High adoption among larger firms, but lower penetration in smaller companies, limiting overall market size.
- Technological Disruptions: Continuous improvements in AI, machine learning, and computer vision technologies.
- Consumer Behavior Shifts: Demand for improved safety, efficiency, and reduced project costs are driving adoption.
Dominant Regions, Countries, or Segments in Machine Learning Construction Industry
North America currently holds the largest market share, primarily due to early adoption and high technological investments. However, Asia-Pacific is expected to experience the highest growth rate over the forecast period driven by substantial infrastructure development. Within application segments, Planning and Design is the largest segment with the highest adoption rate.
- Key Drivers:
- North America: High technology adoption rate and strong investments in infrastructure projects.
- Asia-Pacific: Rapid infrastructure development and government initiatives promoting technology adoption.
- Planning and Design: Increased demand for accurate project planning and efficient design optimization.
- Dominance Factors:
- North America: Established technology ecosystem and high disposable income.
- Asia-Pacific: High growth potential and government support for technological advancement.
- Planning and Design: High ROI and direct impact on project success and cost reduction.
Machine Learning Construction Industry Product Landscape
The market offers a diverse range of products, including AI-powered project management platforms, autonomous heavy equipment, and predictive maintenance software for construction. These solutions offer unique selling propositions (USPs) such as improved safety protocols, optimized resource allocation, and reduced operational costs. Recent technological advancements include the integration of 360° site scanning and sophisticated data analytics.
Key Drivers, Barriers & Challenges in Machine Learning Construction Industry
Key Drivers: Increased demand for improved efficiency, cost reduction, and enhanced safety; technological advancements driving innovation; government initiatives supporting technology adoption in construction.
Key Challenges: High initial investment costs; lack of skilled workforce; data security and privacy concerns; integration challenges with existing systems; resistance to change among some construction professionals. These challenges are estimated to impact market growth by approximately xx% in the next five years.
Emerging Opportunities in Machine Learning Construction Industry
Emerging opportunities include the application of machine learning in sustainable construction practices, the integration of blockchain technology for secure data management, and the development of AI-powered safety systems. Untapped markets include smaller construction firms and developing countries. Evolving consumer preferences are pushing for more sustainable, efficient, and technologically advanced construction methods.
Growth Accelerators in the Machine Learning Construction Industry Industry
The long-term growth of the industry will be fueled by advancements in AI and machine learning algorithms, strategic partnerships between technology providers and construction companies, expansion into emerging markets, and growing government support for technological innovation. The focus on sustainable construction and increasing adoption of Building Information Modeling (BIM) will further boost market growth.
Key Players Shaping the Machine Learning Construction Industry Market
- Smartvid.io Inc
- Lurtis Rules S L
- IBM Corporation
- eSUB Inc
- NVIDIA Corporation
- Alice Technologies Inc
- Microsoft Corporation
- Building System Planning Inc
- Dassault Systèmes SE
- PTC Inc
- Autodesk Inc
- Oracle Corporation
- Bentley Systems Inc
- Doxel Inc
Notable Milestones in Machine Learning Construction Industry Sector
- November 2022: Disperse.io launches Impulse, a new product integrating 360° site scan data for improved project management.
- September 2022: Briq acquires Swipez, automating billing and revenue collection in construction.
- June 2022: Agile Business Technology (ABT) partners with OpenSpace to launch a 360° capture and AI platform in South Africa.
In-Depth Machine Learning Construction Industry Market Outlook
The future of the Machine Learning Construction Industry is bright, with substantial growth potential driven by technological advancements, strategic partnerships, and increasing demand for efficient and sustainable construction practices. The market will continue to consolidate with larger players acquiring smaller ones. Strategic investments in AI and machine learning will be crucial for companies seeking to maintain a competitive edge. Further expansion into emerging markets, particularly in Asia-Pacific, presents significant growth opportunities.
Machine Learning Construction Industry Segmentation
-
1. Application
- 1.1. Planning and Design
- 1.2. Safety
- 1.3. Autonomous Equipment
- 1.4. Monitoring and Maintenance
Machine Learning Construction Industry Segmentation By Geography
- 1. North America
- 2. Europe
- 3. Asia
- 4. Australia and New Zealand
- 5. Latin America
Machine Learning Construction Industry REPORT HIGHLIGHTS
| Aspects | Details |
|---|---|
| Study Period | 2019-2033 |
| Base Year | 2024 |
| Estimated Year | 2025 |
| Forecast Period | 2025-2033 |
| Historical Period | 2019-2024 |
| Growth Rate | CAGR of 24.31% from 2019-2033 |
| Segmentation |
|
Table of Contents
- 1. Introduction
- 1.1. Research Scope
- 1.2. Market Segmentation
- 1.3. Research Methodology
- 1.4. Definitions and Assumptions
- 2. Executive Summary
- 2.1. Introduction
- 3. Market Dynamics
- 3.1. Introduction
- 3.2. Market Drivers
- 3.2.1. Increasing Need to Reduce Production Costs; Demand for More Safety Measures at Construction Sites
- 3.3. Market Restrains
- 3.3.1. Cost and Implementation Issues
- 3.4. Market Trends
- 3.4.1. Planning and Design Application Segment is Expected to Hold Significant Market Share
- 4. Market Factor Analysis
- 4.1. Porters Five Forces
- 4.2. Supply/Value Chain
- 4.3. PESTEL analysis
- 4.4. Market Entropy
- 4.5. Patent/Trademark Analysis
- 5. Global Machine Learning Construction Industry Analysis, Insights and Forecast, 2019-2031
- 5.1. Market Analysis, Insights and Forecast - by Application
- 5.1.1. Planning and Design
- 5.1.2. Safety
- 5.1.3. Autonomous Equipment
- 5.1.4. Monitoring and Maintenance
- 5.2. Market Analysis, Insights and Forecast - by Region
- 5.2.1. North America
- 5.2.2. Europe
- 5.2.3. Asia
- 5.2.4. Australia and New Zealand
- 5.2.5. Latin America
- 5.1. Market Analysis, Insights and Forecast - by Application
- 6. North America Machine Learning Construction Industry Analysis, Insights and Forecast, 2019-2031
- 6.1. Market Analysis, Insights and Forecast - by Application
- 6.1.1. Planning and Design
- 6.1.2. Safety
- 6.1.3. Autonomous Equipment
- 6.1.4. Monitoring and Maintenance
- 6.1. Market Analysis, Insights and Forecast - by Application
- 7. Europe Machine Learning Construction Industry Analysis, Insights and Forecast, 2019-2031
- 7.1. Market Analysis, Insights and Forecast - by Application
- 7.1.1. Planning and Design
- 7.1.2. Safety
- 7.1.3. Autonomous Equipment
- 7.1.4. Monitoring and Maintenance
- 7.1. Market Analysis, Insights and Forecast - by Application
- 8. Asia Machine Learning Construction Industry Analysis, Insights and Forecast, 2019-2031
- 8.1. Market Analysis, Insights and Forecast - by Application
- 8.1.1. Planning and Design
- 8.1.2. Safety
- 8.1.3. Autonomous Equipment
- 8.1.4. Monitoring and Maintenance
- 8.1. Market Analysis, Insights and Forecast - by Application
- 9. Australia and New Zealand Machine Learning Construction Industry Analysis, Insights and Forecast, 2019-2031
- 9.1. Market Analysis, Insights and Forecast - by Application
- 9.1.1. Planning and Design
- 9.1.2. Safety
- 9.1.3. Autonomous Equipment
- 9.1.4. Monitoring and Maintenance
- 9.1. Market Analysis, Insights and Forecast - by Application
- 10. Latin America Machine Learning Construction Industry Analysis, Insights and Forecast, 2019-2031
- 10.1. Market Analysis, Insights and Forecast - by Application
- 10.1.1. Planning and Design
- 10.1.2. Safety
- 10.1.3. Autonomous Equipment
- 10.1.4. Monitoring and Maintenance
- 10.1. Market Analysis, Insights and Forecast - by Application
- 11. North America Machine Learning Construction Industry Analysis, Insights and Forecast, 2019-2031
- 11.1. Market Analysis, Insights and Forecast - By Country/Sub-region
- 11.1.1 United States
- 11.1.2 Canada
- 11.1.3 Mexico
- 12. Europe Machine Learning Construction Industry Analysis, Insights and Forecast, 2019-2031
- 12.1. Market Analysis, Insights and Forecast - By Country/Sub-region
- 12.1.1 Germany
- 12.1.2 United Kingdom
- 12.1.3 France
- 12.1.4 Spain
- 12.1.5 Italy
- 12.1.6 Spain
- 12.1.7 Belgium
- 12.1.8 Netherland
- 12.1.9 Nordics
- 12.1.10 Rest of Europe
- 13. Asia Pacific Machine Learning Construction Industry Analysis, Insights and Forecast, 2019-2031
- 13.1. Market Analysis, Insights and Forecast - By Country/Sub-region
- 13.1.1 China
- 13.1.2 Japan
- 13.1.3 India
- 13.1.4 South Korea
- 13.1.5 Southeast Asia
- 13.1.6 Australia
- 13.1.7 Indonesia
- 13.1.8 Phillipes
- 13.1.9 Singapore
- 13.1.10 Thailandc
- 13.1.11 Rest of Asia Pacific
- 14. South America Machine Learning Construction Industry Analysis, Insights and Forecast, 2019-2031
- 14.1. Market Analysis, Insights and Forecast - By Country/Sub-region
- 14.1.1 Brazil
- 14.1.2 Argentina
- 14.1.3 Peru
- 14.1.4 Chile
- 14.1.5 Colombia
- 14.1.6 Ecuador
- 14.1.7 Venezuela
- 14.1.8 Rest of South America
- 15. North America Machine Learning Construction Industry Analysis, Insights and Forecast, 2019-2031
- 15.1. Market Analysis, Insights and Forecast - By Country/Sub-region
- 15.1.1 United States
- 15.1.2 Canada
- 15.1.3 Mexico
- 16. MEA Machine Learning Construction Industry Analysis, Insights and Forecast, 2019-2031
- 16.1. Market Analysis, Insights and Forecast - By Country/Sub-region
- 16.1.1 United Arab Emirates
- 16.1.2 Saudi Arabia
- 16.1.3 South Africa
- 16.1.4 Rest of Middle East and Africa
- 17. Competitive Analysis
- 17.1. Global Market Share Analysis 2024
- 17.2. Company Profiles
- 17.2.1 Smartvid io Inc
- 17.2.1.1. Overview
- 17.2.1.2. Products
- 17.2.1.3. SWOT Analysis
- 17.2.1.4. Recent Developments
- 17.2.1.5. Financials (Based on Availability)
- 17.2.2 Lurtis Rules S L
- 17.2.2.1. Overview
- 17.2.2.2. Products
- 17.2.2.3. SWOT Analysis
- 17.2.2.4. Recent Developments
- 17.2.2.5. Financials (Based on Availability)
- 17.2.3 IBM Corporation
- 17.2.3.1. Overview
- 17.2.3.2. Products
- 17.2.3.3. SWOT Analysis
- 17.2.3.4. Recent Developments
- 17.2.3.5. Financials (Based on Availability)
- 17.2.4 eSUB Inc
- 17.2.4.1. Overview
- 17.2.4.2. Products
- 17.2.4.3. SWOT Analysis
- 17.2.4.4. Recent Developments
- 17.2.4.5. Financials (Based on Availability)
- 17.2.5 NVIDIA Corporation
- 17.2.5.1. Overview
- 17.2.5.2. Products
- 17.2.5.3. SWOT Analysis
- 17.2.5.4. Recent Developments
- 17.2.5.5. Financials (Based on Availability)
- 17.2.6 Alice Technologies Inc
- 17.2.6.1. Overview
- 17.2.6.2. Products
- 17.2.6.3. SWOT Analysis
- 17.2.6.4. Recent Developments
- 17.2.6.5. Financials (Based on Availability)
- 17.2.7 Microsoft Corporation
- 17.2.7.1. Overview
- 17.2.7.2. Products
- 17.2.7.3. SWOT Analysis
- 17.2.7.4. Recent Developments
- 17.2.7.5. Financials (Based on Availability)
- 17.2.8 Building System Planning Inc
- 17.2.8.1. Overview
- 17.2.8.2. Products
- 17.2.8.3. SWOT Analysis
- 17.2.8.4. Recent Developments
- 17.2.8.5. Financials (Based on Availability)
- 17.2.9 Dassault Systems SE
- 17.2.9.1. Overview
- 17.2.9.2. Products
- 17.2.9.3. SWOT Analysis
- 17.2.9.4. Recent Developments
- 17.2.9.5. Financials (Based on Availability)
- 17.2.10 PTC Inc
- 17.2.10.1. Overview
- 17.2.10.2. Products
- 17.2.10.3. SWOT Analysis
- 17.2.10.4. Recent Developments
- 17.2.10.5. Financials (Based on Availability)
- 17.2.11 Autodesk Inc
- 17.2.11.1. Overview
- 17.2.11.2. Products
- 17.2.11.3. SWOT Analysis
- 17.2.11.4. Recent Developments
- 17.2.11.5. Financials (Based on Availability)
- 17.2.12 Oracle Corporation
- 17.2.12.1. Overview
- 17.2.12.2. Products
- 17.2.12.3. SWOT Analysis
- 17.2.12.4. Recent Developments
- 17.2.12.5. Financials (Based on Availability)
- 17.2.13 Bentley Systems Inc
- 17.2.13.1. Overview
- 17.2.13.2. Products
- 17.2.13.3. SWOT Analysis
- 17.2.13.4. Recent Developments
- 17.2.13.5. Financials (Based on Availability)
- 17.2.14 Doxel Inc
- 17.2.14.1. Overview
- 17.2.14.2. Products
- 17.2.14.3. SWOT Analysis
- 17.2.14.4. Recent Developments
- 17.2.14.5. Financials (Based on Availability)
- 17.2.1 Smartvid io Inc
List of Figures
- Figure 1: Global Machine Learning Construction Industry Revenue Breakdown (Million, %) by Region 2024 & 2032
- Figure 2: Global Machine Learning Construction Industry Volume Breakdown (K Unit, %) by Region 2024 & 2032
- Figure 3: North America Machine Learning Construction Industry Revenue (Million), by Country 2024 & 2032
- Figure 4: North America Machine Learning Construction Industry Volume (K Unit), by Country 2024 & 2032
- Figure 5: North America Machine Learning Construction Industry Revenue Share (%), by Country 2024 & 2032
- Figure 6: North America Machine Learning Construction Industry Volume Share (%), by Country 2024 & 2032
- Figure 7: Europe Machine Learning Construction Industry Revenue (Million), by Country 2024 & 2032
- Figure 8: Europe Machine Learning Construction Industry Volume (K Unit), by Country 2024 & 2032
- Figure 9: Europe Machine Learning Construction Industry Revenue Share (%), by Country 2024 & 2032
- Figure 10: Europe Machine Learning Construction Industry Volume Share (%), by Country 2024 & 2032
- Figure 11: Asia Pacific Machine Learning Construction Industry Revenue (Million), by Country 2024 & 2032
- Figure 12: Asia Pacific Machine Learning Construction Industry Volume (K Unit), by Country 2024 & 2032
- Figure 13: Asia Pacific Machine Learning Construction Industry Revenue Share (%), by Country 2024 & 2032
- Figure 14: Asia Pacific Machine Learning Construction Industry Volume Share (%), by Country 2024 & 2032
- Figure 15: South America Machine Learning Construction Industry Revenue (Million), by Country 2024 & 2032
- Figure 16: South America Machine Learning Construction Industry Volume (K Unit), by Country 2024 & 2032
- Figure 17: South America Machine Learning Construction Industry Revenue Share (%), by Country 2024 & 2032
- Figure 18: South America Machine Learning Construction Industry Volume Share (%), by Country 2024 & 2032
- Figure 19: North America Machine Learning Construction Industry Revenue (Million), by Country 2024 & 2032
- Figure 20: North America Machine Learning Construction Industry Volume (K Unit), by Country 2024 & 2032
- Figure 21: North America Machine Learning Construction Industry Revenue Share (%), by Country 2024 & 2032
- Figure 22: North America Machine Learning Construction Industry Volume Share (%), by Country 2024 & 2032
- Figure 23: MEA Machine Learning Construction Industry Revenue (Million), by Country 2024 & 2032
- Figure 24: MEA Machine Learning Construction Industry Volume (K Unit), by Country 2024 & 2032
- Figure 25: MEA Machine Learning Construction Industry Revenue Share (%), by Country 2024 & 2032
- Figure 26: MEA Machine Learning Construction Industry Volume Share (%), by Country 2024 & 2032
- Figure 27: North America Machine Learning Construction Industry Revenue (Million), by Application 2024 & 2032
- Figure 28: North America Machine Learning Construction Industry Volume (K Unit), by Application 2024 & 2032
- Figure 29: North America Machine Learning Construction Industry Revenue Share (%), by Application 2024 & 2032
- Figure 30: North America Machine Learning Construction Industry Volume Share (%), by Application 2024 & 2032
- Figure 31: North America Machine Learning Construction Industry Revenue (Million), by Country 2024 & 2032
- Figure 32: North America Machine Learning Construction Industry Volume (K Unit), by Country 2024 & 2032
- Figure 33: North America Machine Learning Construction Industry Revenue Share (%), by Country 2024 & 2032
- Figure 34: North America Machine Learning Construction Industry Volume Share (%), by Country 2024 & 2032
- Figure 35: Europe Machine Learning Construction Industry Revenue (Million), by Application 2024 & 2032
- Figure 36: Europe Machine Learning Construction Industry Volume (K Unit), by Application 2024 & 2032
- Figure 37: Europe Machine Learning Construction Industry Revenue Share (%), by Application 2024 & 2032
- Figure 38: Europe Machine Learning Construction Industry Volume Share (%), by Application 2024 & 2032
- Figure 39: Europe Machine Learning Construction Industry Revenue (Million), by Country 2024 & 2032
- Figure 40: Europe Machine Learning Construction Industry Volume (K Unit), by Country 2024 & 2032
- Figure 41: Europe Machine Learning Construction Industry Revenue Share (%), by Country 2024 & 2032
- Figure 42: Europe Machine Learning Construction Industry Volume Share (%), by Country 2024 & 2032
- Figure 43: Asia Machine Learning Construction Industry Revenue (Million), by Application 2024 & 2032
- Figure 44: Asia Machine Learning Construction Industry Volume (K Unit), by Application 2024 & 2032
- Figure 45: Asia Machine Learning Construction Industry Revenue Share (%), by Application 2024 & 2032
- Figure 46: Asia Machine Learning Construction Industry Volume Share (%), by Application 2024 & 2032
- Figure 47: Asia Machine Learning Construction Industry Revenue (Million), by Country 2024 & 2032
- Figure 48: Asia Machine Learning Construction Industry Volume (K Unit), by Country 2024 & 2032
- Figure 49: Asia Machine Learning Construction Industry Revenue Share (%), by Country 2024 & 2032
- Figure 50: Asia Machine Learning Construction Industry Volume Share (%), by Country 2024 & 2032
- Figure 51: Australia and New Zealand Machine Learning Construction Industry Revenue (Million), by Application 2024 & 2032
- Figure 52: Australia and New Zealand Machine Learning Construction Industry Volume (K Unit), by Application 2024 & 2032
- Figure 53: Australia and New Zealand Machine Learning Construction Industry Revenue Share (%), by Application 2024 & 2032
- Figure 54: Australia and New Zealand Machine Learning Construction Industry Volume Share (%), by Application 2024 & 2032
- Figure 55: Australia and New Zealand Machine Learning Construction Industry Revenue (Million), by Country 2024 & 2032
- Figure 56: Australia and New Zealand Machine Learning Construction Industry Volume (K Unit), by Country 2024 & 2032
- Figure 57: Australia and New Zealand Machine Learning Construction Industry Revenue Share (%), by Country 2024 & 2032
- Figure 58: Australia and New Zealand Machine Learning Construction Industry Volume Share (%), by Country 2024 & 2032
- Figure 59: Latin America Machine Learning Construction Industry Revenue (Million), by Application 2024 & 2032
- Figure 60: Latin America Machine Learning Construction Industry Volume (K Unit), by Application 2024 & 2032
- Figure 61: Latin America Machine Learning Construction Industry Revenue Share (%), by Application 2024 & 2032
- Figure 62: Latin America Machine Learning Construction Industry Volume Share (%), by Application 2024 & 2032
- Figure 63: Latin America Machine Learning Construction Industry Revenue (Million), by Country 2024 & 2032
- Figure 64: Latin America Machine Learning Construction Industry Volume (K Unit), by Country 2024 & 2032
- Figure 65: Latin America Machine Learning Construction Industry Revenue Share (%), by Country 2024 & 2032
- Figure 66: Latin America Machine Learning Construction Industry Volume Share (%), by Country 2024 & 2032
List of Tables
- Table 1: Global Machine Learning Construction Industry Revenue Million Forecast, by Region 2019 & 2032
- Table 2: Global Machine Learning Construction Industry Volume K Unit Forecast, by Region 2019 & 2032
- Table 3: Global Machine Learning Construction Industry Revenue Million Forecast, by Application 2019 & 2032
- Table 4: Global Machine Learning Construction Industry Volume K Unit Forecast, by Application 2019 & 2032
- Table 5: Global Machine Learning Construction Industry Revenue Million Forecast, by Region 2019 & 2032
- Table 6: Global Machine Learning Construction Industry Volume K Unit Forecast, by Region 2019 & 2032
- Table 7: Global Machine Learning Construction Industry Revenue Million Forecast, by Country 2019 & 2032
- Table 8: Global Machine Learning Construction Industry Volume K Unit Forecast, by Country 2019 & 2032
- Table 9: United States Machine Learning Construction Industry Revenue (Million) Forecast, by Application 2019 & 2032
- Table 10: United States Machine Learning Construction Industry Volume (K Unit) Forecast, by Application 2019 & 2032
- Table 11: Canada Machine Learning Construction Industry Revenue (Million) Forecast, by Application 2019 & 2032
- Table 12: Canada Machine Learning Construction Industry Volume (K Unit) Forecast, by Application 2019 & 2032
- Table 13: Mexico Machine Learning Construction Industry Revenue (Million) Forecast, by Application 2019 & 2032
- Table 14: Mexico Machine Learning Construction Industry Volume (K Unit) Forecast, by Application 2019 & 2032
- Table 15: Global Machine Learning Construction Industry Revenue Million Forecast, by Country 2019 & 2032
- Table 16: Global Machine Learning Construction Industry Volume K Unit Forecast, by Country 2019 & 2032
- Table 17: Germany Machine Learning Construction Industry Revenue (Million) Forecast, by Application 2019 & 2032
- Table 18: Germany Machine Learning Construction Industry Volume (K Unit) Forecast, by Application 2019 & 2032
- Table 19: United Kingdom Machine Learning Construction Industry Revenue (Million) Forecast, by Application 2019 & 2032
- Table 20: United Kingdom Machine Learning Construction Industry Volume (K Unit) Forecast, by Application 2019 & 2032
- Table 21: France Machine Learning Construction Industry Revenue (Million) Forecast, by Application 2019 & 2032
- Table 22: France Machine Learning Construction Industry Volume (K Unit) Forecast, by Application 2019 & 2032
- Table 23: Spain Machine Learning Construction Industry Revenue (Million) Forecast, by Application 2019 & 2032
- Table 24: Spain Machine Learning Construction Industry Volume (K Unit) Forecast, by Application 2019 & 2032
- Table 25: Italy Machine Learning Construction Industry Revenue (Million) Forecast, by Application 2019 & 2032
- Table 26: Italy Machine Learning Construction Industry Volume (K Unit) Forecast, by Application 2019 & 2032
- Table 27: Spain Machine Learning Construction Industry Revenue (Million) Forecast, by Application 2019 & 2032
- Table 28: Spain Machine Learning Construction Industry Volume (K Unit) Forecast, by Application 2019 & 2032
- Table 29: Belgium Machine Learning Construction Industry Revenue (Million) Forecast, by Application 2019 & 2032
- Table 30: Belgium Machine Learning Construction Industry Volume (K Unit) Forecast, by Application 2019 & 2032
- Table 31: Netherland Machine Learning Construction Industry Revenue (Million) Forecast, by Application 2019 & 2032
- Table 32: Netherland Machine Learning Construction Industry Volume (K Unit) Forecast, by Application 2019 & 2032
- Table 33: Nordics Machine Learning Construction Industry Revenue (Million) Forecast, by Application 2019 & 2032
- Table 34: Nordics Machine Learning Construction Industry Volume (K Unit) Forecast, by Application 2019 & 2032
- Table 35: Rest of Europe Machine Learning Construction Industry Revenue (Million) Forecast, by Application 2019 & 2032
- Table 36: Rest of Europe Machine Learning Construction Industry Volume (K Unit) Forecast, by Application 2019 & 2032
- Table 37: Global Machine Learning Construction Industry Revenue Million Forecast, by Country 2019 & 2032
- Table 38: Global Machine Learning Construction Industry Volume K Unit Forecast, by Country 2019 & 2032
- Table 39: China Machine Learning Construction Industry Revenue (Million) Forecast, by Application 2019 & 2032
- Table 40: China Machine Learning Construction Industry Volume (K Unit) Forecast, by Application 2019 & 2032
- Table 41: Japan Machine Learning Construction Industry Revenue (Million) Forecast, by Application 2019 & 2032
- Table 42: Japan Machine Learning Construction Industry Volume (K Unit) Forecast, by Application 2019 & 2032
- Table 43: India Machine Learning Construction Industry Revenue (Million) Forecast, by Application 2019 & 2032
- Table 44: India Machine Learning Construction Industry Volume (K Unit) Forecast, by Application 2019 & 2032
- Table 45: South Korea Machine Learning Construction Industry Revenue (Million) Forecast, by Application 2019 & 2032
- Table 46: South Korea Machine Learning Construction Industry Volume (K Unit) Forecast, by Application 2019 & 2032
- Table 47: Southeast Asia Machine Learning Construction Industry Revenue (Million) Forecast, by Application 2019 & 2032
- Table 48: Southeast Asia Machine Learning Construction Industry Volume (K Unit) Forecast, by Application 2019 & 2032
- Table 49: Australia Machine Learning Construction Industry Revenue (Million) Forecast, by Application 2019 & 2032
- Table 50: Australia Machine Learning Construction Industry Volume (K Unit) Forecast, by Application 2019 & 2032
- Table 51: Indonesia Machine Learning Construction Industry Revenue (Million) Forecast, by Application 2019 & 2032
- Table 52: Indonesia Machine Learning Construction Industry Volume (K Unit) Forecast, by Application 2019 & 2032
- Table 53: Phillipes Machine Learning Construction Industry Revenue (Million) Forecast, by Application 2019 & 2032
- Table 54: Phillipes Machine Learning Construction Industry Volume (K Unit) Forecast, by Application 2019 & 2032
- Table 55: Singapore Machine Learning Construction Industry Revenue (Million) Forecast, by Application 2019 & 2032
- Table 56: Singapore Machine Learning Construction Industry Volume (K Unit) Forecast, by Application 2019 & 2032
- Table 57: Thailandc Machine Learning Construction Industry Revenue (Million) Forecast, by Application 2019 & 2032
- Table 58: Thailandc Machine Learning Construction Industry Volume (K Unit) Forecast, by Application 2019 & 2032
- Table 59: Rest of Asia Pacific Machine Learning Construction Industry Revenue (Million) Forecast, by Application 2019 & 2032
- Table 60: Rest of Asia Pacific Machine Learning Construction Industry Volume (K Unit) Forecast, by Application 2019 & 2032
- Table 61: Global Machine Learning Construction Industry Revenue Million Forecast, by Country 2019 & 2032
- Table 62: Global Machine Learning Construction Industry Volume K Unit Forecast, by Country 2019 & 2032
- Table 63: Brazil Machine Learning Construction Industry Revenue (Million) Forecast, by Application 2019 & 2032
- Table 64: Brazil Machine Learning Construction Industry Volume (K Unit) Forecast, by Application 2019 & 2032
- Table 65: Argentina Machine Learning Construction Industry Revenue (Million) Forecast, by Application 2019 & 2032
- Table 66: Argentina Machine Learning Construction Industry Volume (K Unit) Forecast, by Application 2019 & 2032
- Table 67: Peru Machine Learning Construction Industry Revenue (Million) Forecast, by Application 2019 & 2032
- Table 68: Peru Machine Learning Construction Industry Volume (K Unit) Forecast, by Application 2019 & 2032
- Table 69: Chile Machine Learning Construction Industry Revenue (Million) Forecast, by Application 2019 & 2032
- Table 70: Chile Machine Learning Construction Industry Volume (K Unit) Forecast, by Application 2019 & 2032
- Table 71: Colombia Machine Learning Construction Industry Revenue (Million) Forecast, by Application 2019 & 2032
- Table 72: Colombia Machine Learning Construction Industry Volume (K Unit) Forecast, by Application 2019 & 2032
- Table 73: Ecuador Machine Learning Construction Industry Revenue (Million) Forecast, by Application 2019 & 2032
- Table 74: Ecuador Machine Learning Construction Industry Volume (K Unit) Forecast, by Application 2019 & 2032
- Table 75: Venezuela Machine Learning Construction Industry Revenue (Million) Forecast, by Application 2019 & 2032
- Table 76: Venezuela Machine Learning Construction Industry Volume (K Unit) Forecast, by Application 2019 & 2032
- Table 77: Rest of South America Machine Learning Construction Industry Revenue (Million) Forecast, by Application 2019 & 2032
- Table 78: Rest of South America Machine Learning Construction Industry Volume (K Unit) Forecast, by Application 2019 & 2032
- Table 79: Global Machine Learning Construction Industry Revenue Million Forecast, by Country 2019 & 2032
- Table 80: Global Machine Learning Construction Industry Volume K Unit Forecast, by Country 2019 & 2032
- Table 81: United States Machine Learning Construction Industry Revenue (Million) Forecast, by Application 2019 & 2032
- Table 82: United States Machine Learning Construction Industry Volume (K Unit) Forecast, by Application 2019 & 2032
- Table 83: Canada Machine Learning Construction Industry Revenue (Million) Forecast, by Application 2019 & 2032
- Table 84: Canada Machine Learning Construction Industry Volume (K Unit) Forecast, by Application 2019 & 2032
- Table 85: Mexico Machine Learning Construction Industry Revenue (Million) Forecast, by Application 2019 & 2032
- Table 86: Mexico Machine Learning Construction Industry Volume (K Unit) Forecast, by Application 2019 & 2032
- Table 87: Global Machine Learning Construction Industry Revenue Million Forecast, by Country 2019 & 2032
- Table 88: Global Machine Learning Construction Industry Volume K Unit Forecast, by Country 2019 & 2032
- Table 89: United Arab Emirates Machine Learning Construction Industry Revenue (Million) Forecast, by Application 2019 & 2032
- Table 90: United Arab Emirates Machine Learning Construction Industry Volume (K Unit) Forecast, by Application 2019 & 2032
- Table 91: Saudi Arabia Machine Learning Construction Industry Revenue (Million) Forecast, by Application 2019 & 2032
- Table 92: Saudi Arabia Machine Learning Construction Industry Volume (K Unit) Forecast, by Application 2019 & 2032
- Table 93: South Africa Machine Learning Construction Industry Revenue (Million) Forecast, by Application 2019 & 2032
- Table 94: South Africa Machine Learning Construction Industry Volume (K Unit) Forecast, by Application 2019 & 2032
- Table 95: Rest of Middle East and Africa Machine Learning Construction Industry Revenue (Million) Forecast, by Application 2019 & 2032
- Table 96: Rest of Middle East and Africa Machine Learning Construction Industry Volume (K Unit) Forecast, by Application 2019 & 2032
- Table 97: Global Machine Learning Construction Industry Revenue Million Forecast, by Application 2019 & 2032
- Table 98: Global Machine Learning Construction Industry Volume K Unit Forecast, by Application 2019 & 2032
- Table 99: Global Machine Learning Construction Industry Revenue Million Forecast, by Country 2019 & 2032
- Table 100: Global Machine Learning Construction Industry Volume K Unit Forecast, by Country 2019 & 2032
- Table 101: Global Machine Learning Construction Industry Revenue Million Forecast, by Application 2019 & 2032
- Table 102: Global Machine Learning Construction Industry Volume K Unit Forecast, by Application 2019 & 2032
- Table 103: Global Machine Learning Construction Industry Revenue Million Forecast, by Country 2019 & 2032
- Table 104: Global Machine Learning Construction Industry Volume K Unit Forecast, by Country 2019 & 2032
- Table 105: Global Machine Learning Construction Industry Revenue Million Forecast, by Application 2019 & 2032
- Table 106: Global Machine Learning Construction Industry Volume K Unit Forecast, by Application 2019 & 2032
- Table 107: Global Machine Learning Construction Industry Revenue Million Forecast, by Country 2019 & 2032
- Table 108: Global Machine Learning Construction Industry Volume K Unit Forecast, by Country 2019 & 2032
- Table 109: Global Machine Learning Construction Industry Revenue Million Forecast, by Application 2019 & 2032
- Table 110: Global Machine Learning Construction Industry Volume K Unit Forecast, by Application 2019 & 2032
- Table 111: Global Machine Learning Construction Industry Revenue Million Forecast, by Country 2019 & 2032
- Table 112: Global Machine Learning Construction Industry Volume K Unit Forecast, by Country 2019 & 2032
- Table 113: Global Machine Learning Construction Industry Revenue Million Forecast, by Application 2019 & 2032
- Table 114: Global Machine Learning Construction Industry Volume K Unit Forecast, by Application 2019 & 2032
- Table 115: Global Machine Learning Construction Industry Revenue Million Forecast, by Country 2019 & 2032
- Table 116: Global Machine Learning Construction Industry Volume K Unit Forecast, by Country 2019 & 2032
Frequently Asked Questions
1. What is the projected Compound Annual Growth Rate (CAGR) of the Machine Learning Construction Industry?
The projected CAGR is approximately 24.31%.
2. Which companies are prominent players in the Machine Learning Construction Industry?
Key companies in the market include Smartvid io Inc, Lurtis Rules S L, IBM Corporation, eSUB Inc , NVIDIA Corporation, Alice Technologies Inc, Microsoft Corporation, Building System Planning Inc, Dassault Systems SE, PTC Inc, Autodesk Inc, Oracle Corporation, Bentley Systems Inc, Doxel Inc.
3. What are the main segments of the Machine Learning Construction Industry?
The market segments include Application.
4. Can you provide details about the market size?
The market size is estimated to be USD 3.99 Million as of 2022.
5. What are some drivers contributing to market growth?
Increasing Need to Reduce Production Costs; Demand for More Safety Measures at Construction Sites.
6. What are the notable trends driving market growth?
Planning and Design Application Segment is Expected to Hold Significant Market Share.
7. Are there any restraints impacting market growth?
Cost and Implementation Issues.
8. Can you provide examples of recent developments in the market?
November 2022: Disperse.io, a UK-based construction technology company with a platform that used AI to help project managers track work, capture data from building sites, and make better project decisions, launched a new product, Impulse, that highlights issues gleaned from 360° site scans captured in its platform. This solution integrated performance insights into building elevations and presents problems to project managers.
9. What pricing options are available for accessing the report?
Pricing options include single-user, multi-user, and enterprise licenses priced at USD 4750, USD 5250, and USD 8750 respectively.
10. Is the market size provided in terms of value or volume?
The market size is provided in terms of value, measured in Million and volume, measured in K Unit.
11. Are there any specific market keywords associated with the report?
Yes, the market keyword associated with the report is "Machine Learning Construction Industry," which aids in identifying and referencing the specific market segment covered.
12. How do I determine which pricing option suits my needs best?
The pricing options vary based on user requirements and access needs. Individual users may opt for single-user licenses, while businesses requiring broader access may choose multi-user or enterprise licenses for cost-effective access to the report.
13. Are there any additional resources or data provided in the Machine Learning Construction Industry report?
While the report offers comprehensive insights, it's advisable to review the specific contents or supplementary materials provided to ascertain if additional resources or data are available.
14. How can I stay updated on further developments or reports in the Machine Learning Construction Industry?
To stay informed about further developments, trends, and reports in the Machine Learning Construction Industry, consider subscribing to industry newsletters, following relevant companies and organizations, or regularly checking reputable industry news sources and publications.
Methodology
Step 1 - Identification of Relevant Samples Size from Population Database


Step 2 - Approaches for Defining Global Market Size (Value, Volume* & Price*)

Note*: In applicable scenarios
Step 3 - Data Sources
Primary Research
- Web Analytics
- Survey Reports
- Research Institute
- Latest Research Reports
- Opinion Leaders
Secondary Research
- Annual Reports
- White Paper
- Latest Press Release
- Industry Association
- Paid Database
- Investor Presentations

Step 4 - Data Triangulation
Involves using different sources of information in order to increase the validity of a study
These sources are likely to be stakeholders in a program - participants, other researchers, program staff, other community members, and so on.
Then we put all data in single framework & apply various statistical tools to find out the dynamic on the market.
During the analysis stage, feedback from the stakeholder groups would be compared to determine areas of agreement as well as areas of divergence


