
Key Insights
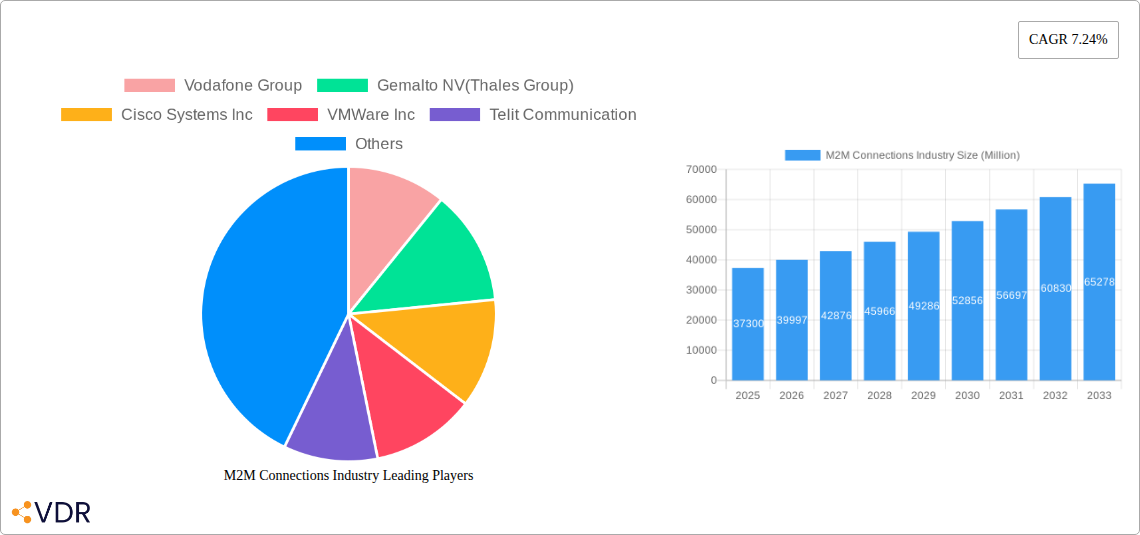
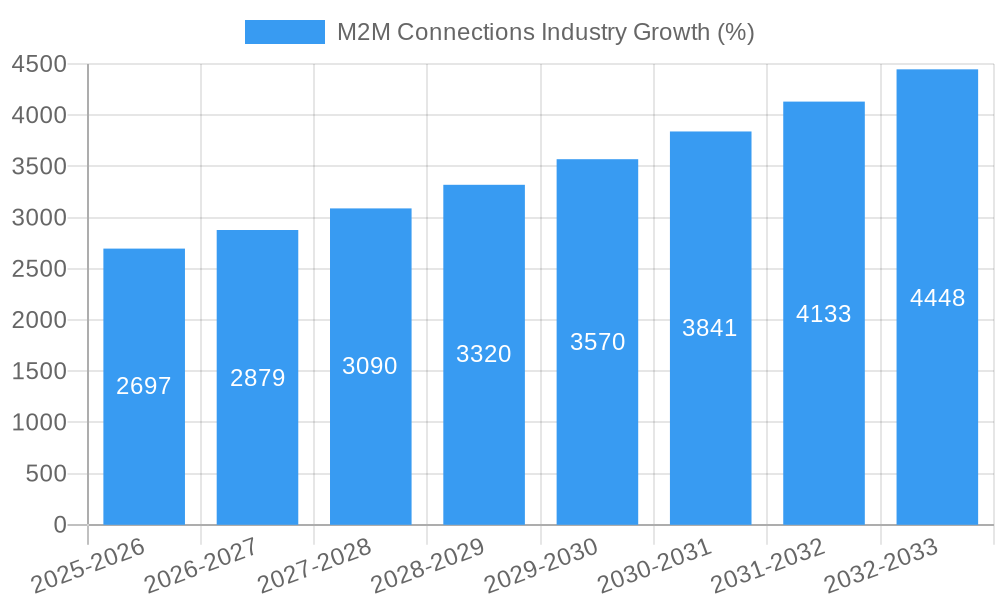
The global Machine-to-Machine (M2M) Connections market, valued at $37.30 billion in 2025, is projected to experience robust growth, driven by the increasing adoption of IoT devices across various sectors. A Compound Annual Growth Rate (CAGR) of 7.24% from 2025 to 2033 indicates a significant expansion, fueled by several key factors. The proliferation of smart devices in retail, banking, and healthcare is a primary driver, enabling real-time data collection and improved operational efficiency. Furthermore, advancements in cellular connectivity, LPWA technologies, and the development of robust security protocols are paving the way for wider M2M adoption. The automotive and industrial automation sectors are also significant contributors, with connected vehicles and smart factories driving demand for reliable and secure M2M connections. While challenges remain, such as managing data security and addressing interoperability issues across different technologies, the overall market trajectory points toward substantial growth. The market segmentation reveals a diverse landscape, with wireless connections dominating due to their flexibility and scalability.
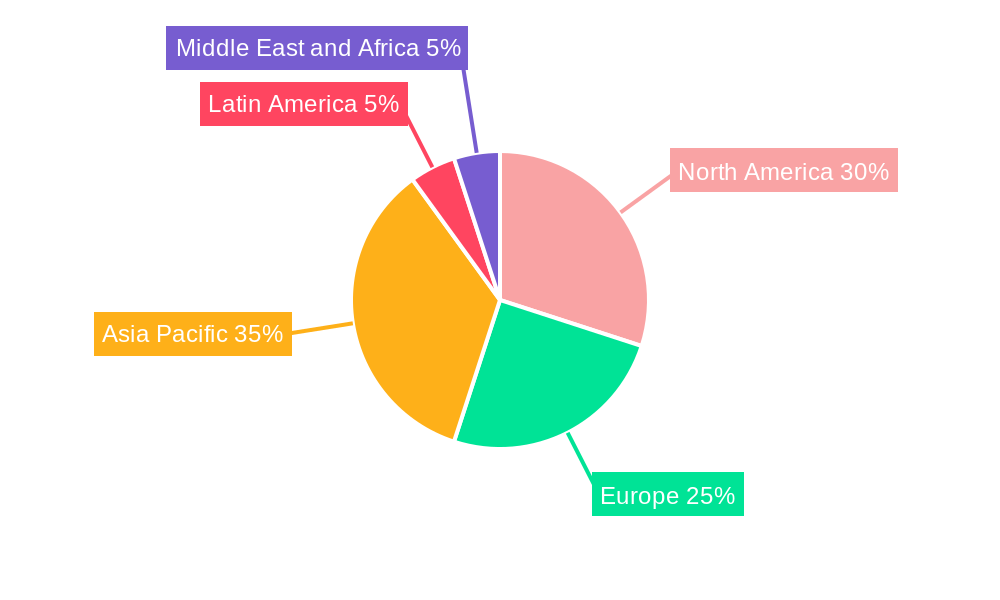
Looking ahead, the M2M market will be shaped by emerging technologies such as 5G and advancements in edge computing. These technological advancements will not only enhance the speed and reliability of M2M communication but will also improve data processing capabilities at the network edge, leading to improved responsiveness and reduced latency. Furthermore, the increasing emphasis on data analytics and AI will enable businesses to derive greater insights from M2M data, leading to more effective decision-making and operational optimization. Growth will likely be geographically diverse, with regions like Asia Pacific expected to witness faster growth due to the rapid expansion of digital infrastructure and increasing adoption of IoT in developing economies. The competitive landscape is characterized by a mix of established telecommunication giants and specialized M2M solution providers, creating a dynamic environment ripe for innovation and growth.
M2M Connections Industry Market Report: 2019-2033
This comprehensive report provides a detailed analysis of the M2M Connections industry, encompassing market dynamics, growth trends, regional dominance, product landscape, key challenges, emerging opportunities, and key players. The study period covers 2019-2033, with 2025 as the base and estimated year. The forecast period spans 2025-2033, and the historical period covers 2019-2024. The report offers invaluable insights for industry professionals, investors, and strategic decision-makers seeking to navigate this rapidly evolving market. The market is valued at xx Million units in 2025 and is projected to reach xx Million units by 2033.
M2M Connections Industry Market Dynamics & Structure
The M2M connections market is characterized by a moderately concentrated landscape, with key players like Vodafone Group, Cisco Systems, and Huawei holding significant market share. Technological innovation, particularly in LPWA and 5G, is a major driver, while regulatory frameworks concerning data privacy and security play a crucial role. The market witnesses continuous M&A activity, with xx deals recorded in the past five years, indicating consolidation and expansion strategies. Competitive substitutes, such as traditional wired connections, still exist, but the wireless segment's dominance is expanding. End-user demographics are diversifying, with increasing adoption across various sectors.
- Market Concentration: Moderately concentrated, with top 5 players holding approximately xx% market share in 2025.
- Technological Innovation: 5G, LPWA, and advancements in short-range technologies are key drivers.
- Regulatory Frameworks: Data privacy regulations (GDPR, CCPA) influence market dynamics.
- Competitive Substitutes: Wired connections face competition from wireless alternatives.
- M&A Activity: xx M&A deals in the past five years, indicating industry consolidation.
- End-User Demographics: Diversification across retail, banking, healthcare, and industrial sectors.
M2M Connections Industry Growth Trends & Insights
The M2M connections market exhibits robust growth, driven by the increasing adoption of IoT devices across diverse sectors. The market size grew from xx Million units in 2019 to xx Million units in 2024, exhibiting a CAGR of xx%. Technological disruptions, such as the widespread deployment of 5G networks, significantly impact adoption rates. Consumer behavior shifts towards connected devices and smart solutions further propel market expansion. Market penetration is expected to reach xx% by 2033. The transition to more efficient and cost-effective LPWA technologies contributes significantly to this expansion.
Dominant Regions, Countries, or Segments in M2M Connections Industry
North America and Europe currently dominate the M2M connections market, driven by strong technological infrastructure and high adoption rates in sectors such as automotive and healthcare. Within technology segments, Cellular Connections holds the largest market share, while the LPWA segment displays the highest growth potential due to its cost-effectiveness and suitability for various applications. In terms of end-user industries, the automotive sector, with its increasing reliance on connected vehicles, demonstrates significant growth.
- Leading Regions: North America and Europe.
- Dominant Technology Segment: Cellular Connections (xx% market share in 2025)
- Fastest-Growing Technology Segment: LPWA (xx% CAGR projected 2025-2033)
- Key End-User Industry: Automotive, driven by connected car technology.
- Dominant Connection Type: Wireless
M2M Connections Industry Product Landscape
The M2M connections market offers a diverse range of products, encompassing cellular modems, LPWA modules, short-range communication devices, and satellite communication systems. Product innovations focus on enhancing connectivity speed, power efficiency, security features, and data management capabilities. Key selling propositions include seamless integration, enhanced security, cost-effectiveness, and scalability to meet evolving business needs. The advancements in 5G technology are pushing the boundaries of data transmission speed and reliability.
Key Drivers, Barriers & Challenges in M2M Connections Industry
Key Drivers:
- Widespread IoT adoption across various sectors.
- Advancements in 5G and LPWA technologies.
- Government initiatives promoting digitalization and smart infrastructure.
Challenges and Restraints:
- Data security and privacy concerns.
- Interoperability issues across different technologies.
- High initial investment costs for infrastructure deployment. This leads to a xx% reduction in market growth annually.
Emerging Opportunities in M2M Connections Industry
- Expansion into untapped markets in developing economies.
- Integration of M2M connections into smart city initiatives.
- Development of innovative applications in areas like precision agriculture and environmental monitoring.
Growth Accelerators in the M2M Connections Industry
Strategic partnerships between technology providers and end-user industries are accelerating growth. Technological breakthroughs like improved battery life for IoT devices and the evolution of edge computing are also key contributors. Expansion into new and underserved geographical markets offers significant opportunities for market players.
Key Players Shaping the M2M Connections Industry Market
- Vodafone Group
- Gemalto NV (Thales Group)
- Cisco Systems Inc
- VMWare Inc
- Telit Communication
- Huawei Technologies Co Ltd
- Texas Instruments Incorporated
- Duetsche Telecom AG
- Siera Wireless
- AT&T Inc
- China Mobile Ltd
- Intel Corporation
- Telefonica SA
Notable Milestones in M2M Connections Industry Sector
- October 2023: O2 Telefónica and Transatel partner to expand 5G-based IoT and M2M solutions in Germany, particularly for the automotive sector.
- October 2023: M2M Services merges with Alula to create enhanced smart security solutions.
In-Depth M2M Connections Industry Market Outlook
The M2M connections market is poised for continued strong growth, driven by technological advancements and increasing demand across various sectors. Strategic partnerships, expansion into new markets, and the development of innovative applications will play a crucial role in shaping future market dynamics. The potential for growth is substantial, particularly in regions with developing infrastructure and emerging IoT applications.
M2M Connections Industry Segmentation
-
1. Connection Type
- 1.1. Wired
- 1.2. Wireless
-
2. Technology
- 2.1. Cellular Connections
- 2.2. Low Power Wide Area (LPWA)
- 2.3. Short Range
- 2.4. MAN
- 2.5. Wide Area Fixed
- 2.6. Satellite
-
3. End User Industry
- 3.1. Retail Sector
- 3.2. Banking and Financial Institution
- 3.3. Telecom and IT Industry
- 3.4. Healthcare
- 3.5. Automotive
- 3.6. Oil & Gas
- 3.7. Transportation
- 3.8. Other End User Industries
M2M Connections Industry Segmentation By Geography
- 1. North America
- 2. Europe
- 3. Asia Pacific
- 4. Latin America
- 5. Middle East and Africa
M2M Connections Industry REPORT HIGHLIGHTS
| Aspects | Details |
|---|---|
| Study Period | 2019-2033 |
| Base Year | 2024 |
| Estimated Year | 2025 |
| Forecast Period | 2025-2033 |
| Historical Period | 2019-2024 |
| Growth Rate | CAGR of 7.24% from 2019-2033 |
| Segmentation |
|
Table of Contents
- 1. Introduction
- 1.1. Research Scope
- 1.2. Market Segmentation
- 1.3. Research Methodology
- 1.4. Definitions and Assumptions
- 2. Executive Summary
- 2.1. Introduction
- 3. Market Dynamics
- 3.1. Introduction
- 3.2. Market Drivers
- 3.2.1. Augmenting Applications Telematics; Growing Usage of Internet; Increasing Number of Mobile Connections
- 3.3. Market Restrains
- 3.3.1. Privacy and Security Issues; Lack of Standardization
- 3.4. Market Trends
- 3.4.1. Growing Usage of Internet is Expected to Drive the Market Growth
- 4. Market Factor Analysis
- 4.1. Porters Five Forces
- 4.2. Supply/Value Chain
- 4.3. PESTEL analysis
- 4.4. Market Entropy
- 4.5. Patent/Trademark Analysis
- 5. Global M2M Connections Industry Analysis, Insights and Forecast, 2019-2031
- 5.1. Market Analysis, Insights and Forecast - by Connection Type
- 5.1.1. Wired
- 5.1.2. Wireless
- 5.2. Market Analysis, Insights and Forecast - by Technology
- 5.2.1. Cellular Connections
- 5.2.2. Low Power Wide Area (LPWA)
- 5.2.3. Short Range
- 5.2.4. MAN
- 5.2.5. Wide Area Fixed
- 5.2.6. Satellite
- 5.3. Market Analysis, Insights and Forecast - by End User Industry
- 5.3.1. Retail Sector
- 5.3.2. Banking and Financial Institution
- 5.3.3. Telecom and IT Industry
- 5.3.4. Healthcare
- 5.3.5. Automotive
- 5.3.6. Oil & Gas
- 5.3.7. Transportation
- 5.3.8. Other End User Industries
- 5.4. Market Analysis, Insights and Forecast - by Region
- 5.4.1. North America
- 5.4.2. Europe
- 5.4.3. Asia Pacific
- 5.4.4. Latin America
- 5.4.5. Middle East and Africa
- 5.1. Market Analysis, Insights and Forecast - by Connection Type
- 6. North America M2M Connections Industry Analysis, Insights and Forecast, 2019-2031
- 6.1. Market Analysis, Insights and Forecast - by Connection Type
- 6.1.1. Wired
- 6.1.2. Wireless
- 6.2. Market Analysis, Insights and Forecast - by Technology
- 6.2.1. Cellular Connections
- 6.2.2. Low Power Wide Area (LPWA)
- 6.2.3. Short Range
- 6.2.4. MAN
- 6.2.5. Wide Area Fixed
- 6.2.6. Satellite
- 6.3. Market Analysis, Insights and Forecast - by End User Industry
- 6.3.1. Retail Sector
- 6.3.2. Banking and Financial Institution
- 6.3.3. Telecom and IT Industry
- 6.3.4. Healthcare
- 6.3.5. Automotive
- 6.3.6. Oil & Gas
- 6.3.7. Transportation
- 6.3.8. Other End User Industries
- 6.1. Market Analysis, Insights and Forecast - by Connection Type
- 7. Europe M2M Connections Industry Analysis, Insights and Forecast, 2019-2031
- 7.1. Market Analysis, Insights and Forecast - by Connection Type
- 7.1.1. Wired
- 7.1.2. Wireless
- 7.2. Market Analysis, Insights and Forecast - by Technology
- 7.2.1. Cellular Connections
- 7.2.2. Low Power Wide Area (LPWA)
- 7.2.3. Short Range
- 7.2.4. MAN
- 7.2.5. Wide Area Fixed
- 7.2.6. Satellite
- 7.3. Market Analysis, Insights and Forecast - by End User Industry
- 7.3.1. Retail Sector
- 7.3.2. Banking and Financial Institution
- 7.3.3. Telecom and IT Industry
- 7.3.4. Healthcare
- 7.3.5. Automotive
- 7.3.6. Oil & Gas
- 7.3.7. Transportation
- 7.3.8. Other End User Industries
- 7.1. Market Analysis, Insights and Forecast - by Connection Type
- 8. Asia Pacific M2M Connections Industry Analysis, Insights and Forecast, 2019-2031
- 8.1. Market Analysis, Insights and Forecast - by Connection Type
- 8.1.1. Wired
- 8.1.2. Wireless
- 8.2. Market Analysis, Insights and Forecast - by Technology
- 8.2.1. Cellular Connections
- 8.2.2. Low Power Wide Area (LPWA)
- 8.2.3. Short Range
- 8.2.4. MAN
- 8.2.5. Wide Area Fixed
- 8.2.6. Satellite
- 8.3. Market Analysis, Insights and Forecast - by End User Industry
- 8.3.1. Retail Sector
- 8.3.2. Banking and Financial Institution
- 8.3.3. Telecom and IT Industry
- 8.3.4. Healthcare
- 8.3.5. Automotive
- 8.3.6. Oil & Gas
- 8.3.7. Transportation
- 8.3.8. Other End User Industries
- 8.1. Market Analysis, Insights and Forecast - by Connection Type
- 9. Latin America M2M Connections Industry Analysis, Insights and Forecast, 2019-2031
- 9.1. Market Analysis, Insights and Forecast - by Connection Type
- 9.1.1. Wired
- 9.1.2. Wireless
- 9.2. Market Analysis, Insights and Forecast - by Technology
- 9.2.1. Cellular Connections
- 9.2.2. Low Power Wide Area (LPWA)
- 9.2.3. Short Range
- 9.2.4. MAN
- 9.2.5. Wide Area Fixed
- 9.2.6. Satellite
- 9.3. Market Analysis, Insights and Forecast - by End User Industry
- 9.3.1. Retail Sector
- 9.3.2. Banking and Financial Institution
- 9.3.3. Telecom and IT Industry
- 9.3.4. Healthcare
- 9.3.5. Automotive
- 9.3.6. Oil & Gas
- 9.3.7. Transportation
- 9.3.8. Other End User Industries
- 9.1. Market Analysis, Insights and Forecast - by Connection Type
- 10. Middle East and Africa M2M Connections Industry Analysis, Insights and Forecast, 2019-2031
- 10.1. Market Analysis, Insights and Forecast - by Connection Type
- 10.1.1. Wired
- 10.1.2. Wireless
- 10.2. Market Analysis, Insights and Forecast - by Technology
- 10.2.1. Cellular Connections
- 10.2.2. Low Power Wide Area (LPWA)
- 10.2.3. Short Range
- 10.2.4. MAN
- 10.2.5. Wide Area Fixed
- 10.2.6. Satellite
- 10.3. Market Analysis, Insights and Forecast - by End User Industry
- 10.3.1. Retail Sector
- 10.3.2. Banking and Financial Institution
- 10.3.3. Telecom and IT Industry
- 10.3.4. Healthcare
- 10.3.5. Automotive
- 10.3.6. Oil & Gas
- 10.3.7. Transportation
- 10.3.8. Other End User Industries
- 10.1. Market Analysis, Insights and Forecast - by Connection Type
- 11. North America M2M Connections Industry Analysis, Insights and Forecast, 2019-2031
- 11.1. Market Analysis, Insights and Forecast - By Country/Sub-region
- 11.1.1.
- 12. Europe M2M Connections Industry Analysis, Insights and Forecast, 2019-2031
- 12.1. Market Analysis, Insights and Forecast - By Country/Sub-region
- 12.1.1.
- 13. Asia Pacific M2M Connections Industry Analysis, Insights and Forecast, 2019-2031
- 13.1. Market Analysis, Insights and Forecast - By Country/Sub-region
- 13.1.1.
- 14. Latin America M2M Connections Industry Analysis, Insights and Forecast, 2019-2031
- 14.1. Market Analysis, Insights and Forecast - By Country/Sub-region
- 14.1.1.
- 15. Middle East and Africa M2M Connections Industry Analysis, Insights and Forecast, 2019-2031
- 15.1. Market Analysis, Insights and Forecast - By Country/Sub-region
- 15.1.1.
- 16. Competitive Analysis
- 16.1. Global Market Share Analysis 2024
- 16.2. Company Profiles
- 16.2.1 Vodafone Group
- 16.2.1.1. Overview
- 16.2.1.2. Products
- 16.2.1.3. SWOT Analysis
- 16.2.1.4. Recent Developments
- 16.2.1.5. Financials (Based on Availability)
- 16.2.2 Gemalto NV(Thales Group)
- 16.2.2.1. Overview
- 16.2.2.2. Products
- 16.2.2.3. SWOT Analysis
- 16.2.2.4. Recent Developments
- 16.2.2.5. Financials (Based on Availability)
- 16.2.3 Cisco Systems Inc
- 16.2.3.1. Overview
- 16.2.3.2. Products
- 16.2.3.3. SWOT Analysis
- 16.2.3.4. Recent Developments
- 16.2.3.5. Financials (Based on Availability)
- 16.2.4 VMWare Inc
- 16.2.4.1. Overview
- 16.2.4.2. Products
- 16.2.4.3. SWOT Analysis
- 16.2.4.4. Recent Developments
- 16.2.4.5. Financials (Based on Availability)
- 16.2.5 Telit Communication
- 16.2.5.1. Overview
- 16.2.5.2. Products
- 16.2.5.3. SWOT Analysis
- 16.2.5.4. Recent Developments
- 16.2.5.5. Financials (Based on Availability)
- 16.2.6 Huawei Technologies Co Ltd
- 16.2.6.1. Overview
- 16.2.6.2. Products
- 16.2.6.3. SWOT Analysis
- 16.2.6.4. Recent Developments
- 16.2.6.5. Financials (Based on Availability)
- 16.2.7 Texas Instruments Incorporated
- 16.2.7.1. Overview
- 16.2.7.2. Products
- 16.2.7.3. SWOT Analysis
- 16.2.7.4. Recent Developments
- 16.2.7.5. Financials (Based on Availability)
- 16.2.8 Duetsche Telecom AG
- 16.2.8.1. Overview
- 16.2.8.2. Products
- 16.2.8.3. SWOT Analysis
- 16.2.8.4. Recent Developments
- 16.2.8.5. Financials (Based on Availability)
- 16.2.9 Siera Wireless
- 16.2.9.1. Overview
- 16.2.9.2. Products
- 16.2.9.3. SWOT Analysis
- 16.2.9.4. Recent Developments
- 16.2.9.5. Financials (Based on Availability)
- 16.2.10 AT&T Inc
- 16.2.10.1. Overview
- 16.2.10.2. Products
- 16.2.10.3. SWOT Analysis
- 16.2.10.4. Recent Developments
- 16.2.10.5. Financials (Based on Availability)
- 16.2.11 China Mobile Ltd
- 16.2.11.1. Overview
- 16.2.11.2. Products
- 16.2.11.3. SWOT Analysis
- 16.2.11.4. Recent Developments
- 16.2.11.5. Financials (Based on Availability)
- 16.2.12 Intel Corporation
- 16.2.12.1. Overview
- 16.2.12.2. Products
- 16.2.12.3. SWOT Analysis
- 16.2.12.4. Recent Developments
- 16.2.12.5. Financials (Based on Availability)
- 16.2.13 Telefonica SA
- 16.2.13.1. Overview
- 16.2.13.2. Products
- 16.2.13.3. SWOT Analysis
- 16.2.13.4. Recent Developments
- 16.2.13.5. Financials (Based on Availability)
- 16.2.1 Vodafone Group
List of Figures
- Figure 1: Global M2M Connections Industry Revenue Breakdown (Million, %) by Region 2024 & 2032
- Figure 2: North America M2M Connections Industry Revenue (Million), by Country 2024 & 2032
- Figure 3: North America M2M Connections Industry Revenue Share (%), by Country 2024 & 2032
- Figure 4: Europe M2M Connections Industry Revenue (Million), by Country 2024 & 2032
- Figure 5: Europe M2M Connections Industry Revenue Share (%), by Country 2024 & 2032
- Figure 6: Asia Pacific M2M Connections Industry Revenue (Million), by Country 2024 & 2032
- Figure 7: Asia Pacific M2M Connections Industry Revenue Share (%), by Country 2024 & 2032
- Figure 8: Latin America M2M Connections Industry Revenue (Million), by Country 2024 & 2032
- Figure 9: Latin America M2M Connections Industry Revenue Share (%), by Country 2024 & 2032
- Figure 10: Middle East and Africa M2M Connections Industry Revenue (Million), by Country 2024 & 2032
- Figure 11: Middle East and Africa M2M Connections Industry Revenue Share (%), by Country 2024 & 2032
- Figure 12: North America M2M Connections Industry Revenue (Million), by Connection Type 2024 & 2032
- Figure 13: North America M2M Connections Industry Revenue Share (%), by Connection Type 2024 & 2032
- Figure 14: North America M2M Connections Industry Revenue (Million), by Technology 2024 & 2032
- Figure 15: North America M2M Connections Industry Revenue Share (%), by Technology 2024 & 2032
- Figure 16: North America M2M Connections Industry Revenue (Million), by End User Industry 2024 & 2032
- Figure 17: North America M2M Connections Industry Revenue Share (%), by End User Industry 2024 & 2032
- Figure 18: North America M2M Connections Industry Revenue (Million), by Country 2024 & 2032
- Figure 19: North America M2M Connections Industry Revenue Share (%), by Country 2024 & 2032
- Figure 20: Europe M2M Connections Industry Revenue (Million), by Connection Type 2024 & 2032
- Figure 21: Europe M2M Connections Industry Revenue Share (%), by Connection Type 2024 & 2032
- Figure 22: Europe M2M Connections Industry Revenue (Million), by Technology 2024 & 2032
- Figure 23: Europe M2M Connections Industry Revenue Share (%), by Technology 2024 & 2032
- Figure 24: Europe M2M Connections Industry Revenue (Million), by End User Industry 2024 & 2032
- Figure 25: Europe M2M Connections Industry Revenue Share (%), by End User Industry 2024 & 2032
- Figure 26: Europe M2M Connections Industry Revenue (Million), by Country 2024 & 2032
- Figure 27: Europe M2M Connections Industry Revenue Share (%), by Country 2024 & 2032
- Figure 28: Asia Pacific M2M Connections Industry Revenue (Million), by Connection Type 2024 & 2032
- Figure 29: Asia Pacific M2M Connections Industry Revenue Share (%), by Connection Type 2024 & 2032
- Figure 30: Asia Pacific M2M Connections Industry Revenue (Million), by Technology 2024 & 2032
- Figure 31: Asia Pacific M2M Connections Industry Revenue Share (%), by Technology 2024 & 2032
- Figure 32: Asia Pacific M2M Connections Industry Revenue (Million), by End User Industry 2024 & 2032
- Figure 33: Asia Pacific M2M Connections Industry Revenue Share (%), by End User Industry 2024 & 2032
- Figure 34: Asia Pacific M2M Connections Industry Revenue (Million), by Country 2024 & 2032
- Figure 35: Asia Pacific M2M Connections Industry Revenue Share (%), by Country 2024 & 2032
- Figure 36: Latin America M2M Connections Industry Revenue (Million), by Connection Type 2024 & 2032
- Figure 37: Latin America M2M Connections Industry Revenue Share (%), by Connection Type 2024 & 2032
- Figure 38: Latin America M2M Connections Industry Revenue (Million), by Technology 2024 & 2032
- Figure 39: Latin America M2M Connections Industry Revenue Share (%), by Technology 2024 & 2032
- Figure 40: Latin America M2M Connections Industry Revenue (Million), by End User Industry 2024 & 2032
- Figure 41: Latin America M2M Connections Industry Revenue Share (%), by End User Industry 2024 & 2032
- Figure 42: Latin America M2M Connections Industry Revenue (Million), by Country 2024 & 2032
- Figure 43: Latin America M2M Connections Industry Revenue Share (%), by Country 2024 & 2032
- Figure 44: Middle East and Africa M2M Connections Industry Revenue (Million), by Connection Type 2024 & 2032
- Figure 45: Middle East and Africa M2M Connections Industry Revenue Share (%), by Connection Type 2024 & 2032
- Figure 46: Middle East and Africa M2M Connections Industry Revenue (Million), by Technology 2024 & 2032
- Figure 47: Middle East and Africa M2M Connections Industry Revenue Share (%), by Technology 2024 & 2032
- Figure 48: Middle East and Africa M2M Connections Industry Revenue (Million), by End User Industry 2024 & 2032
- Figure 49: Middle East and Africa M2M Connections Industry Revenue Share (%), by End User Industry 2024 & 2032
- Figure 50: Middle East and Africa M2M Connections Industry Revenue (Million), by Country 2024 & 2032
- Figure 51: Middle East and Africa M2M Connections Industry Revenue Share (%), by Country 2024 & 2032
List of Tables
- Table 1: Global M2M Connections Industry Revenue Million Forecast, by Region 2019 & 2032
- Table 2: Global M2M Connections Industry Revenue Million Forecast, by Connection Type 2019 & 2032
- Table 3: Global M2M Connections Industry Revenue Million Forecast, by Technology 2019 & 2032
- Table 4: Global M2M Connections Industry Revenue Million Forecast, by End User Industry 2019 & 2032
- Table 5: Global M2M Connections Industry Revenue Million Forecast, by Region 2019 & 2032
- Table 6: Global M2M Connections Industry Revenue Million Forecast, by Country 2019 & 2032
- Table 7: M2M Connections Industry Revenue (Million) Forecast, by Application 2019 & 2032
- Table 8: Global M2M Connections Industry Revenue Million Forecast, by Country 2019 & 2032
- Table 9: M2M Connections Industry Revenue (Million) Forecast, by Application 2019 & 2032
- Table 10: Global M2M Connections Industry Revenue Million Forecast, by Country 2019 & 2032
- Table 11: M2M Connections Industry Revenue (Million) Forecast, by Application 2019 & 2032
- Table 12: Global M2M Connections Industry Revenue Million Forecast, by Country 2019 & 2032
- Table 13: M2M Connections Industry Revenue (Million) Forecast, by Application 2019 & 2032
- Table 14: Global M2M Connections Industry Revenue Million Forecast, by Country 2019 & 2032
- Table 15: M2M Connections Industry Revenue (Million) Forecast, by Application 2019 & 2032
- Table 16: Global M2M Connections Industry Revenue Million Forecast, by Connection Type 2019 & 2032
- Table 17: Global M2M Connections Industry Revenue Million Forecast, by Technology 2019 & 2032
- Table 18: Global M2M Connections Industry Revenue Million Forecast, by End User Industry 2019 & 2032
- Table 19: Global M2M Connections Industry Revenue Million Forecast, by Country 2019 & 2032
- Table 20: Global M2M Connections Industry Revenue Million Forecast, by Connection Type 2019 & 2032
- Table 21: Global M2M Connections Industry Revenue Million Forecast, by Technology 2019 & 2032
- Table 22: Global M2M Connections Industry Revenue Million Forecast, by End User Industry 2019 & 2032
- Table 23: Global M2M Connections Industry Revenue Million Forecast, by Country 2019 & 2032
- Table 24: Global M2M Connections Industry Revenue Million Forecast, by Connection Type 2019 & 2032
- Table 25: Global M2M Connections Industry Revenue Million Forecast, by Technology 2019 & 2032
- Table 26: Global M2M Connections Industry Revenue Million Forecast, by End User Industry 2019 & 2032
- Table 27: Global M2M Connections Industry Revenue Million Forecast, by Country 2019 & 2032
- Table 28: Global M2M Connections Industry Revenue Million Forecast, by Connection Type 2019 & 2032
- Table 29: Global M2M Connections Industry Revenue Million Forecast, by Technology 2019 & 2032
- Table 30: Global M2M Connections Industry Revenue Million Forecast, by End User Industry 2019 & 2032
- Table 31: Global M2M Connections Industry Revenue Million Forecast, by Country 2019 & 2032
- Table 32: Global M2M Connections Industry Revenue Million Forecast, by Connection Type 2019 & 2032
- Table 33: Global M2M Connections Industry Revenue Million Forecast, by Technology 2019 & 2032
- Table 34: Global M2M Connections Industry Revenue Million Forecast, by End User Industry 2019 & 2032
- Table 35: Global M2M Connections Industry Revenue Million Forecast, by Country 2019 & 2032
Frequently Asked Questions
1. What is the projected Compound Annual Growth Rate (CAGR) of the M2M Connections Industry?
The projected CAGR is approximately 7.24%.
2. Which companies are prominent players in the M2M Connections Industry?
Key companies in the market include Vodafone Group, Gemalto NV(Thales Group), Cisco Systems Inc, VMWare Inc, Telit Communication, Huawei Technologies Co Ltd, Texas Instruments Incorporated, Duetsche Telecom AG, Siera Wireless, AT&T Inc, China Mobile Ltd, Intel Corporation, Telefonica SA.
3. What are the main segments of the M2M Connections Industry?
The market segments include Connection Type, Technology, End User Industry.
4. Can you provide details about the market size?
The market size is estimated to be USD 37.30 Million as of 2022.
5. What are some drivers contributing to market growth?
Augmenting Applications Telematics; Growing Usage of Internet; Increasing Number of Mobile Connections.
6. What are the notable trends driving market growth?
Growing Usage of Internet is Expected to Drive the Market Growth.
7. Are there any restraints impacting market growth?
Privacy and Security Issues; Lack of Standardization.
8. Can you provide examples of recent developments in the market?
October 2023 - O2 Telefónica and the European mobile communications provider Transatel would work closely in Germany in the future. The two companies signed an agreement incl. mid-term access to O2 Telefónica's strong 5G network. They together, expanded the range of connectivity solutions in the German market, e.g., for the automotive sector. Transatel, a subsidiary of NTT Group, will offer Internet-of-Things (IoT) and machine-to-machine (M2M) applications for industrial companies via the O2 Telefónica mobile network. Transatel also offers a data roaming service for residential and business customers under the Ubigi brand.
9. What pricing options are available for accessing the report?
Pricing options include single-user, multi-user, and enterprise licenses priced at USD 4750, USD 5250, and USD 8750 respectively.
10. Is the market size provided in terms of value or volume?
The market size is provided in terms of value, measured in Million.
11. Are there any specific market keywords associated with the report?
Yes, the market keyword associated with the report is "M2M Connections Industry," which aids in identifying and referencing the specific market segment covered.
12. How do I determine which pricing option suits my needs best?
The pricing options vary based on user requirements and access needs. Individual users may opt for single-user licenses, while businesses requiring broader access may choose multi-user or enterprise licenses for cost-effective access to the report.
13. Are there any additional resources or data provided in the M2M Connections Industry report?
While the report offers comprehensive insights, it's advisable to review the specific contents or supplementary materials provided to ascertain if additional resources or data are available.
14. How can I stay updated on further developments or reports in the M2M Connections Industry?
To stay informed about further developments, trends, and reports in the M2M Connections Industry, consider subscribing to industry newsletters, following relevant companies and organizations, or regularly checking reputable industry news sources and publications.
Methodology
Step 1 - Identification of Relevant Samples Size from Population Database


Step 2 - Approaches for Defining Global Market Size (Value, Volume* & Price*)

Note*: In applicable scenarios
Step 3 - Data Sources
Primary Research
- Web Analytics
- Survey Reports
- Research Institute
- Latest Research Reports
- Opinion Leaders
Secondary Research
- Annual Reports
- White Paper
- Latest Press Release
- Industry Association
- Paid Database
- Investor Presentations

Step 4 - Data Triangulation
Involves using different sources of information in order to increase the validity of a study
These sources are likely to be stakeholders in a program - participants, other researchers, program staff, other community members, and so on.
Then we put all data in single framework & apply various statistical tools to find out the dynamic on the market.
During the analysis stage, feedback from the stakeholder groups would be compared to determine areas of agreement as well as areas of divergence


