
Key Insights
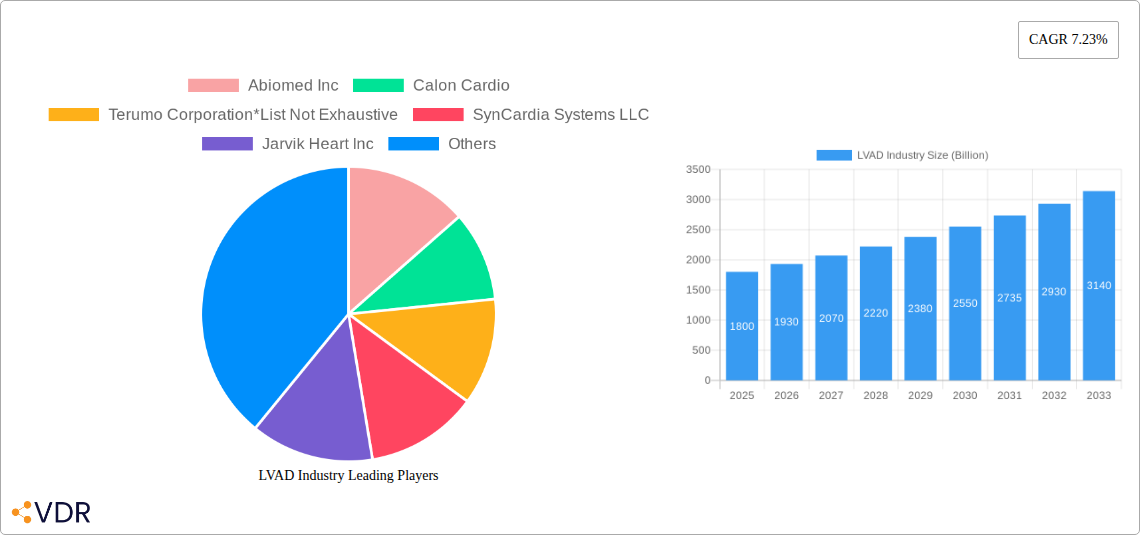
The global Left Ventricular Assist Device (LVAD) market, a crucial segment within the broader ventricular assist device market, is experiencing robust growth, projected to reach a value of $1.8 billion in 2025 and maintain a Compound Annual Growth Rate (CAGR) of 7.23% from 2025 to 2033. This expansion is fueled by several key factors. The increasing prevalence of heart failure, particularly in aging populations across North America and Europe, creates significant demand for LVADs as a life-sustaining therapy. Technological advancements leading to smaller, more durable, and less invasive devices are improving patient outcomes and expanding the addressable market. Furthermore, the growing adoption of destination therapy (DT), where LVADs serve as a long-term solution rather than a bridge to transplant, is a major driver of market growth. This shift reflects increased confidence in the technology's long-term efficacy and improved quality of life for patients. While the high cost of LVADs and potential complications remain as restraints, ongoing research and development focused on improving device longevity and reducing complications are mitigating these challenges. The competitive landscape is characterized by a mix of established players like Abiomed, Medtronic, and Abbott Laboratories, alongside innovative companies like BiVACOR, constantly striving to improve device performance and expand their market share.
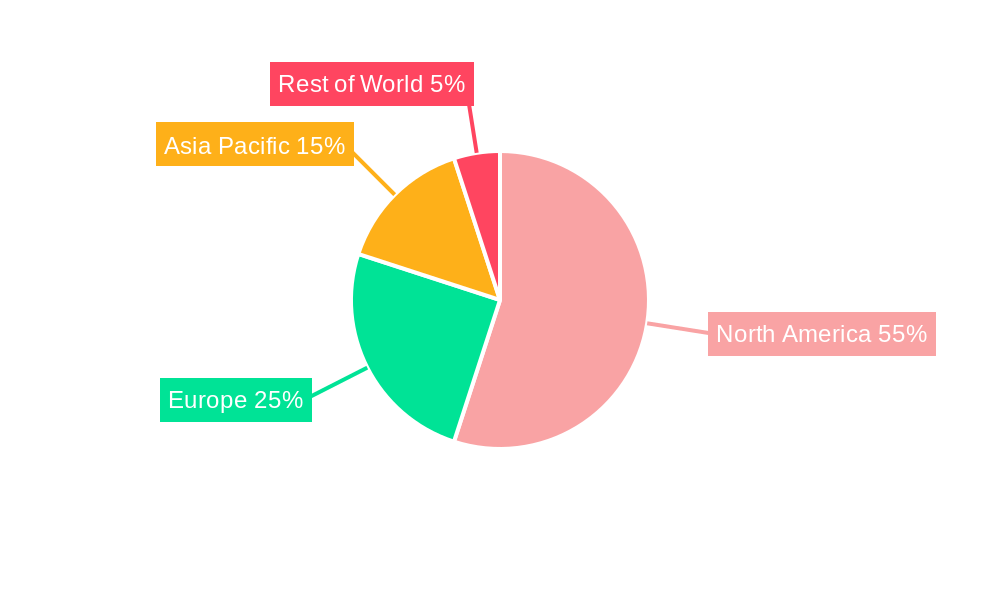
The market's geographical distribution shows a strong concentration in North America, driven by high healthcare expenditure and advanced medical infrastructure. Europe represents another significant market, though with potentially slower growth compared to the Asia-Pacific region. The Asia-Pacific market is poised for considerable expansion driven by rising healthcare awareness, increasing disposable incomes in key countries like China and India, and growing adoption of advanced medical technologies. However, regulatory hurdles and the need for improved healthcare infrastructure in certain parts of the region present challenges. Growth in other regions such as South America and the Middle East will likely be moderate, driven by a combination of factors including economic development, technological advancements and government health policies. The overall market projection suggests a substantial and sustained increase in LVAD adoption over the forecast period. The continued innovation in device technology and expanding indications for LVAD therapy will be key factors influencing future market performance.
This comprehensive report provides an in-depth analysis of the Left Ventricular Assist Device (LVAD) industry, encompassing market dynamics, growth trends, competitive landscape, and future outlook. With a focus on the parent market of Cardiovascular Devices and the child market of Mechanical Circulatory Support (MCS) systems, this report is essential for industry professionals, investors, and researchers seeking a clear understanding of this vital sector. The study period covers 2019-2033, with 2025 as the base and estimated year.
LVAD Industry Market Dynamics & Structure
The LVAD market, valued at xx Billion in 2024, is characterized by moderate concentration with key players holding significant market share. Technological innovation, particularly in miniaturization and improved durability, is a primary growth driver. Stringent regulatory frameworks, including FDA approvals in the US and CE marking in Europe, influence market entry and product development. Competitive substitutes, such as heart transplants and other less invasive procedures, pose challenges. The end-user demographic is primarily comprised of patients with advanced heart failure. M&A activity has been relatively low in recent years (xx deals in the last 5 years), though strategic partnerships are increasingly common.
- Market Concentration: Moderately concentrated, with top 5 players holding xx% market share.
- Technological Innovation: Focus on miniaturization, improved biocompatibility, and enhanced power sources.
- Regulatory Landscape: Stringent approvals (FDA, CE Mark) impacting time-to-market.
- Competitive Substitutes: Heart transplants, other less invasive therapies.
- End-User Demographics: Patients with advanced heart failure (age, disease severity).
- M&A Activity: Low volume but strategic partnerships are growing.
LVAD Industry Growth Trends & Insights
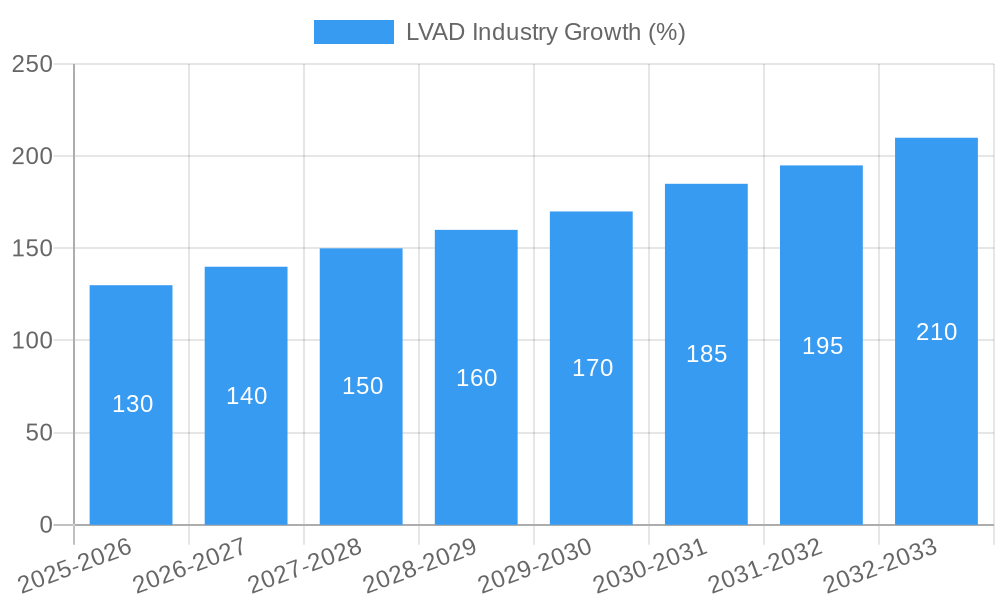
The LVAD market is projected to experience significant growth, reaching xx Billion by 2033, exhibiting a CAGR of xx% during the forecast period (2025-2033). This growth is driven by increasing prevalence of heart failure, technological advancements leading to improved device efficacy and safety, and rising adoption of destination therapy. The market penetration of LVADs remains relatively low (xx% in 2024) offering significant untapped potential for expansion. Technological disruptions, such as the development of fully implantable devices and improved power management systems, are further accelerating growth. Changing consumer behavior, including increased patient awareness and demand for improved quality of life, also contributes to market expansion. The historical period (2019-2024) witnessed a steady growth trajectory, laying the foundation for the projected surge in the forecast period.
Dominant Regions, Countries, or Segments in LVAD Industry
North America currently dominates the LVAD market, holding the largest market share (xx%) due to high healthcare expenditure, advanced medical infrastructure, and early adoption of new technologies. Within North America, the United States holds the leading position. Europe follows as the second largest market, driven by increasing prevalence of heart failure and growing awareness among patients and healthcare providers. The LVAD segment showing strongest growth is Left Ventricular Assist Devices (LVADs) for Bridge-to-transplant (BTT) therapy.
Key Regional Drivers:
- North America: High healthcare spending, advanced infrastructure, early adoption.
- Europe: Increasing prevalence of heart failure, growing awareness.
- Asia-Pacific: Rising disposable incomes, increasing healthcare expenditure.
Dominant Segments:
- Type of Ventricular Device: LVAD (xx% market share) due to the high incidence of left-sided heart failure.
- Application: Bridge-to-transplant (BTT) Therapy (xx% market share) because of high demand for temporary life support.
LVAD Industry Product Landscape
The LVAD product landscape is characterized by continuous innovation, with manufacturers focusing on improving device longevity, reducing complications, and enhancing patient quality of life. This involves advancements in materials science, miniaturization techniques, and the integration of advanced sensors and data analytics. Unique selling propositions (USPs) include features like improved blood flow dynamics, reduced thrombogenicity, and enhanced power efficiency. These advancements are driving greater market adoption and improved patient outcomes.
Key Drivers, Barriers & Challenges in LVAD Industry
Key Drivers:
- Increasing prevalence of heart failure.
- Technological advancements resulting in improved device performance and safety.
- Rising adoption of destination therapy.
- Growing awareness among patients and healthcare providers.
Key Challenges:
- High cost of devices and implantation procedures.
- Risk of complications, including bleeding, infection, and thromboembolic events.
- Stringent regulatory requirements.
- Limited reimbursement policies in some regions.
- Supply chain disruptions can impact availability and cost of components. The impact is estimated at xx% increase in device costs during peak disruption periods.
Emerging Opportunities in LVAD Industry
- Development of fully implantable devices.
- Expansion into emerging markets with high prevalence of heart failure.
- Integration of artificial intelligence and machine learning for improved patient monitoring and treatment.
- Development of novel therapies combining LVADs with other cardiovascular interventions.
Growth Accelerators in the LVAD Industry
Technological breakthroughs, particularly in biomaterials, power sources, and control systems, are key accelerators of LVAD market growth. Strategic partnerships between device manufacturers and healthcare providers facilitate market access and improve patient outcomes. Expansion into untapped markets, particularly in developing economies, presents significant growth opportunities. The ongoing research and development in miniaturization, biocompatibility, and power sources create a constantly evolving product landscape, fueling continued market expansion.
Key Players Shaping the LVAD Industry Market
- Abiomed Inc
- Calon Cardio
- Terumo Corporation
- SynCardia Systems LLC
- Jarvik Heart Inc
- Medtronic PLC
- Abbott Laboratories (St Jude Medical Inc)
- BiVACOR Inc
- Berlin Heart GmbH
Notable Milestones in LVAD Industry Sector
- June 2021: Abbott announced increased capacity to meet growing demand for MCS devices following Medtronic's withdrawal of the HeartWare HVAD.
- January 2022: IIT Kanpur launched Hridyantra, a program to develop an advanced LVAD.
In-Depth LVAD Industry Market Outlook
The LVAD market is poised for sustained growth, driven by ongoing technological advancements, increasing prevalence of heart failure, and expanding adoption of destination therapy. Strategic partnerships, coupled with expansion into new markets, will further fuel market expansion. Innovation in miniaturization and biocompatibility will improve patient outcomes, leading to increased market penetration and overall market value. The future outlook is positive, with significant opportunities for growth and innovation within the LVAD sector.
LVAD Industry Segmentation
-
1. Type of Ventricular Device
- 1.1. Left Ventricular Assist Device (LVAD)
- 1.2. Right Ventricular Assist Device (RVAD)
- 1.3. Biventricular Assist Device (BIVAD)
-
2. Application
- 2.1. Bridge-to-transplant (BTT) Therapy
- 2.2. Destination Therapy
- 2.3. Other Therapies
LVAD Industry Segmentation By Geography
-
1. North America
- 1.1. United States
- 1.2. Canada
- 1.3. Mexico
-
2. Europe
- 2.1. Germany
- 2.2. United Kingdom
- 2.3. France
- 2.4. Italy
- 2.5. Spain
- 2.6. Rest of Europe
-
3. Asia Pacific
- 3.1. China
- 3.2. Japan
- 3.3. India
- 3.4. Australia
- 3.5. South Korea
- 3.6. Rest of Asia Pacific
- 4. Middle East
-
5. GCC
- 5.1. South Africa
- 5.2. Rest of Middle East
-
6. South America
- 6.1. Brazil
- 6.2. Argentina
- 6.3. Rest of South America
LVAD Industry REPORT HIGHLIGHTS
| Aspects | Details |
|---|---|
| Study Period | 2019-2033 |
| Base Year | 2024 |
| Estimated Year | 2025 |
| Forecast Period | 2025-2033 |
| Historical Period | 2019-2024 |
| Growth Rate | CAGR of 7.23% from 2019-2033 |
| Segmentation |
|
Table of Contents
- 1. Introduction
- 1.1. Research Scope
- 1.2. Market Segmentation
- 1.3. Research Methodology
- 1.4. Definitions and Assumptions
- 2. Executive Summary
- 2.1. Introduction
- 3. Market Dynamics
- 3.1. Introduction
- 3.2. Market Drivers
- 3.2.1. Growing Burden of Cardiac Diseases and Heart Failure; Technological Advancement of Devices for Cardiac Diseases Management; Growing Initiatives and Awareness Regarding Cardiovascular Diseases
- 3.3. Market Restrains
- 3.3.1. High Cost of Devices and Procedures; Several Risks Associated to VAD Implant
- 3.4. Market Trends
- 3.4.1. Left Ventricular Assist Device (LVAD) is Expected to Hold the Major Share in the Type of Ventricular Device Segment
- 4. Market Factor Analysis
- 4.1. Porters Five Forces
- 4.2. Supply/Value Chain
- 4.3. PESTEL analysis
- 4.4. Market Entropy
- 4.5. Patent/Trademark Analysis
- 5. Global LVAD Industry Analysis, Insights and Forecast, 2019-2031
- 5.1. Market Analysis, Insights and Forecast - by Type of Ventricular Device
- 5.1.1. Left Ventricular Assist Device (LVAD)
- 5.1.2. Right Ventricular Assist Device (RVAD)
- 5.1.3. Biventricular Assist Device (BIVAD)
- 5.2. Market Analysis, Insights and Forecast - by Application
- 5.2.1. Bridge-to-transplant (BTT) Therapy
- 5.2.2. Destination Therapy
- 5.2.3. Other Therapies
- 5.3. Market Analysis, Insights and Forecast - by Region
- 5.3.1. North America
- 5.3.2. Europe
- 5.3.3. Asia Pacific
- 5.3.4. Middle East
- 5.3.5. GCC
- 5.3.6. South America
- 5.1. Market Analysis, Insights and Forecast - by Type of Ventricular Device
- 6. North America LVAD Industry Analysis, Insights and Forecast, 2019-2031
- 6.1. Market Analysis, Insights and Forecast - by Type of Ventricular Device
- 6.1.1. Left Ventricular Assist Device (LVAD)
- 6.1.2. Right Ventricular Assist Device (RVAD)
- 6.1.3. Biventricular Assist Device (BIVAD)
- 6.2. Market Analysis, Insights and Forecast - by Application
- 6.2.1. Bridge-to-transplant (BTT) Therapy
- 6.2.2. Destination Therapy
- 6.2.3. Other Therapies
- 6.1. Market Analysis, Insights and Forecast - by Type of Ventricular Device
- 7. Europe LVAD Industry Analysis, Insights and Forecast, 2019-2031
- 7.1. Market Analysis, Insights and Forecast - by Type of Ventricular Device
- 7.1.1. Left Ventricular Assist Device (LVAD)
- 7.1.2. Right Ventricular Assist Device (RVAD)
- 7.1.3. Biventricular Assist Device (BIVAD)
- 7.2. Market Analysis, Insights and Forecast - by Application
- 7.2.1. Bridge-to-transplant (BTT) Therapy
- 7.2.2. Destination Therapy
- 7.2.3. Other Therapies
- 7.1. Market Analysis, Insights and Forecast - by Type of Ventricular Device
- 8. Asia Pacific LVAD Industry Analysis, Insights and Forecast, 2019-2031
- 8.1. Market Analysis, Insights and Forecast - by Type of Ventricular Device
- 8.1.1. Left Ventricular Assist Device (LVAD)
- 8.1.2. Right Ventricular Assist Device (RVAD)
- 8.1.3. Biventricular Assist Device (BIVAD)
- 8.2. Market Analysis, Insights and Forecast - by Application
- 8.2.1. Bridge-to-transplant (BTT) Therapy
- 8.2.2. Destination Therapy
- 8.2.3. Other Therapies
- 8.1. Market Analysis, Insights and Forecast - by Type of Ventricular Device
- 9. Middle East LVAD Industry Analysis, Insights and Forecast, 2019-2031
- 9.1. Market Analysis, Insights and Forecast - by Type of Ventricular Device
- 9.1.1. Left Ventricular Assist Device (LVAD)
- 9.1.2. Right Ventricular Assist Device (RVAD)
- 9.1.3. Biventricular Assist Device (BIVAD)
- 9.2. Market Analysis, Insights and Forecast - by Application
- 9.2.1. Bridge-to-transplant (BTT) Therapy
- 9.2.2. Destination Therapy
- 9.2.3. Other Therapies
- 9.1. Market Analysis, Insights and Forecast - by Type of Ventricular Device
- 10. GCC LVAD Industry Analysis, Insights and Forecast, 2019-2031
- 10.1. Market Analysis, Insights and Forecast - by Type of Ventricular Device
- 10.1.1. Left Ventricular Assist Device (LVAD)
- 10.1.2. Right Ventricular Assist Device (RVAD)
- 10.1.3. Biventricular Assist Device (BIVAD)
- 10.2. Market Analysis, Insights and Forecast - by Application
- 10.2.1. Bridge-to-transplant (BTT) Therapy
- 10.2.2. Destination Therapy
- 10.2.3. Other Therapies
- 10.1. Market Analysis, Insights and Forecast - by Type of Ventricular Device
- 11. South America LVAD Industry Analysis, Insights and Forecast, 2019-2031
- 11.1. Market Analysis, Insights and Forecast - by Type of Ventricular Device
- 11.1.1. Left Ventricular Assist Device (LVAD)
- 11.1.2. Right Ventricular Assist Device (RVAD)
- 11.1.3. Biventricular Assist Device (BIVAD)
- 11.2. Market Analysis, Insights and Forecast - by Application
- 11.2.1. Bridge-to-transplant (BTT) Therapy
- 11.2.2. Destination Therapy
- 11.2.3. Other Therapies
- 11.1. Market Analysis, Insights and Forecast - by Type of Ventricular Device
- 12. North America LVAD Industry Analysis, Insights and Forecast, 2019-2031
- 12.1. Market Analysis, Insights and Forecast - By Country/Sub-region
- 12.1.1 United States
- 12.1.2 Canada
- 12.1.3 Mexico
- 13. Europe LVAD Industry Analysis, Insights and Forecast, 2019-2031
- 13.1. Market Analysis, Insights and Forecast - By Country/Sub-region
- 13.1.1 Germany
- 13.1.2 United Kingdom
- 13.1.3 France
- 13.1.4 Italy
- 13.1.5 Spain
- 13.1.6 Rest of Europe
- 14. Asia Pacific LVAD Industry Analysis, Insights and Forecast, 2019-2031
- 14.1. Market Analysis, Insights and Forecast - By Country/Sub-region
- 14.1.1 China
- 14.1.2 Japan
- 14.1.3 India
- 14.1.4 Australia
- 14.1.5 South Korea
- 14.1.6 Rest of Asia Pacific
- 15. Middle East LVAD Industry Analysis, Insights and Forecast, 2019-2031
- 15.1. Market Analysis, Insights and Forecast - By Country/Sub-region
- 15.1.1.
- 16. GCC LVAD Industry Analysis, Insights and Forecast, 2019-2031
- 16.1. Market Analysis, Insights and Forecast - By Country/Sub-region
- 16.1.1 South Africa
- 16.1.2 Rest of Middle East
- 17. South America LVAD Industry Analysis, Insights and Forecast, 2019-2031
- 17.1. Market Analysis, Insights and Forecast - By Country/Sub-region
- 17.1.1 Brazil
- 17.1.2 Argentina
- 17.1.3 Rest of South America
- 18. Competitive Analysis
- 18.1. Global Market Share Analysis 2024
- 18.2. Company Profiles
- 18.2.1 Abiomed Inc
- 18.2.1.1. Overview
- 18.2.1.2. Products
- 18.2.1.3. SWOT Analysis
- 18.2.1.4. Recent Developments
- 18.2.1.5. Financials (Based on Availability)
- 18.2.2 Calon Cardio
- 18.2.2.1. Overview
- 18.2.2.2. Products
- 18.2.2.3. SWOT Analysis
- 18.2.2.4. Recent Developments
- 18.2.2.5. Financials (Based on Availability)
- 18.2.3 Terumo Corporation*List Not Exhaustive
- 18.2.3.1. Overview
- 18.2.3.2. Products
- 18.2.3.3. SWOT Analysis
- 18.2.3.4. Recent Developments
- 18.2.3.5. Financials (Based on Availability)
- 18.2.4 SynCardia Systems LLC
- 18.2.4.1. Overview
- 18.2.4.2. Products
- 18.2.4.3. SWOT Analysis
- 18.2.4.4. Recent Developments
- 18.2.4.5. Financials (Based on Availability)
- 18.2.5 Jarvik Heart Inc
- 18.2.5.1. Overview
- 18.2.5.2. Products
- 18.2.5.3. SWOT Analysis
- 18.2.5.4. Recent Developments
- 18.2.5.5. Financials (Based on Availability)
- 18.2.6 Medtronic PLC
- 18.2.6.1. Overview
- 18.2.6.2. Products
- 18.2.6.3. SWOT Analysis
- 18.2.6.4. Recent Developments
- 18.2.6.5. Financials (Based on Availability)
- 18.2.7 Abbott Laboratories (St Jude Medical Inc )
- 18.2.7.1. Overview
- 18.2.7.2. Products
- 18.2.7.3. SWOT Analysis
- 18.2.7.4. Recent Developments
- 18.2.7.5. Financials (Based on Availability)
- 18.2.8 BiVACOR Inc
- 18.2.8.1. Overview
- 18.2.8.2. Products
- 18.2.8.3. SWOT Analysis
- 18.2.8.4. Recent Developments
- 18.2.8.5. Financials (Based on Availability)
- 18.2.9 Berlin Heart GmbH
- 18.2.9.1. Overview
- 18.2.9.2. Products
- 18.2.9.3. SWOT Analysis
- 18.2.9.4. Recent Developments
- 18.2.9.5. Financials (Based on Availability)
- 18.2.1 Abiomed Inc
List of Figures
- Figure 1: Global LVAD Industry Revenue Breakdown (Billion, %) by Region 2024 & 2032
- Figure 2: Global LVAD Industry Volume Breakdown (Piece, %) by Region 2024 & 2032
- Figure 3: North America LVAD Industry Revenue (Billion), by Country 2024 & 2032
- Figure 4: North America LVAD Industry Volume (Piece), by Country 2024 & 2032
- Figure 5: North America LVAD Industry Revenue Share (%), by Country 2024 & 2032
- Figure 6: North America LVAD Industry Volume Share (%), by Country 2024 & 2032
- Figure 7: Europe LVAD Industry Revenue (Billion), by Country 2024 & 2032
- Figure 8: Europe LVAD Industry Volume (Piece), by Country 2024 & 2032
- Figure 9: Europe LVAD Industry Revenue Share (%), by Country 2024 & 2032
- Figure 10: Europe LVAD Industry Volume Share (%), by Country 2024 & 2032
- Figure 11: Asia Pacific LVAD Industry Revenue (Billion), by Country 2024 & 2032
- Figure 12: Asia Pacific LVAD Industry Volume (Piece), by Country 2024 & 2032
- Figure 13: Asia Pacific LVAD Industry Revenue Share (%), by Country 2024 & 2032
- Figure 14: Asia Pacific LVAD Industry Volume Share (%), by Country 2024 & 2032
- Figure 15: Middle East LVAD Industry Revenue (Billion), by Country 2024 & 2032
- Figure 16: Middle East LVAD Industry Volume (Piece), by Country 2024 & 2032
- Figure 17: Middle East LVAD Industry Revenue Share (%), by Country 2024 & 2032
- Figure 18: Middle East LVAD Industry Volume Share (%), by Country 2024 & 2032
- Figure 19: GCC LVAD Industry Revenue (Billion), by Country 2024 & 2032
- Figure 20: GCC LVAD Industry Volume (Piece), by Country 2024 & 2032
- Figure 21: GCC LVAD Industry Revenue Share (%), by Country 2024 & 2032
- Figure 22: GCC LVAD Industry Volume Share (%), by Country 2024 & 2032
- Figure 23: South America LVAD Industry Revenue (Billion), by Country 2024 & 2032
- Figure 24: South America LVAD Industry Volume (Piece), by Country 2024 & 2032
- Figure 25: South America LVAD Industry Revenue Share (%), by Country 2024 & 2032
- Figure 26: South America LVAD Industry Volume Share (%), by Country 2024 & 2032
- Figure 27: North America LVAD Industry Revenue (Billion), by Type of Ventricular Device 2024 & 2032
- Figure 28: North America LVAD Industry Volume (Piece), by Type of Ventricular Device 2024 & 2032
- Figure 29: North America LVAD Industry Revenue Share (%), by Type of Ventricular Device 2024 & 2032
- Figure 30: North America LVAD Industry Volume Share (%), by Type of Ventricular Device 2024 & 2032
- Figure 31: North America LVAD Industry Revenue (Billion), by Application 2024 & 2032
- Figure 32: North America LVAD Industry Volume (Piece), by Application 2024 & 2032
- Figure 33: North America LVAD Industry Revenue Share (%), by Application 2024 & 2032
- Figure 34: North America LVAD Industry Volume Share (%), by Application 2024 & 2032
- Figure 35: North America LVAD Industry Revenue (Billion), by Country 2024 & 2032
- Figure 36: North America LVAD Industry Volume (Piece), by Country 2024 & 2032
- Figure 37: North America LVAD Industry Revenue Share (%), by Country 2024 & 2032
- Figure 38: North America LVAD Industry Volume Share (%), by Country 2024 & 2032
- Figure 39: Europe LVAD Industry Revenue (Billion), by Type of Ventricular Device 2024 & 2032
- Figure 40: Europe LVAD Industry Volume (Piece), by Type of Ventricular Device 2024 & 2032
- Figure 41: Europe LVAD Industry Revenue Share (%), by Type of Ventricular Device 2024 & 2032
- Figure 42: Europe LVAD Industry Volume Share (%), by Type of Ventricular Device 2024 & 2032
- Figure 43: Europe LVAD Industry Revenue (Billion), by Application 2024 & 2032
- Figure 44: Europe LVAD Industry Volume (Piece), by Application 2024 & 2032
- Figure 45: Europe LVAD Industry Revenue Share (%), by Application 2024 & 2032
- Figure 46: Europe LVAD Industry Volume Share (%), by Application 2024 & 2032
- Figure 47: Europe LVAD Industry Revenue (Billion), by Country 2024 & 2032
- Figure 48: Europe LVAD Industry Volume (Piece), by Country 2024 & 2032
- Figure 49: Europe LVAD Industry Revenue Share (%), by Country 2024 & 2032
- Figure 50: Europe LVAD Industry Volume Share (%), by Country 2024 & 2032
- Figure 51: Asia Pacific LVAD Industry Revenue (Billion), by Type of Ventricular Device 2024 & 2032
- Figure 52: Asia Pacific LVAD Industry Volume (Piece), by Type of Ventricular Device 2024 & 2032
- Figure 53: Asia Pacific LVAD Industry Revenue Share (%), by Type of Ventricular Device 2024 & 2032
- Figure 54: Asia Pacific LVAD Industry Volume Share (%), by Type of Ventricular Device 2024 & 2032
- Figure 55: Asia Pacific LVAD Industry Revenue (Billion), by Application 2024 & 2032
- Figure 56: Asia Pacific LVAD Industry Volume (Piece), by Application 2024 & 2032
- Figure 57: Asia Pacific LVAD Industry Revenue Share (%), by Application 2024 & 2032
- Figure 58: Asia Pacific LVAD Industry Volume Share (%), by Application 2024 & 2032
- Figure 59: Asia Pacific LVAD Industry Revenue (Billion), by Country 2024 & 2032
- Figure 60: Asia Pacific LVAD Industry Volume (Piece), by Country 2024 & 2032
- Figure 61: Asia Pacific LVAD Industry Revenue Share (%), by Country 2024 & 2032
- Figure 62: Asia Pacific LVAD Industry Volume Share (%), by Country 2024 & 2032
- Figure 63: Middle East LVAD Industry Revenue (Billion), by Type of Ventricular Device 2024 & 2032
- Figure 64: Middle East LVAD Industry Volume (Piece), by Type of Ventricular Device 2024 & 2032
- Figure 65: Middle East LVAD Industry Revenue Share (%), by Type of Ventricular Device 2024 & 2032
- Figure 66: Middle East LVAD Industry Volume Share (%), by Type of Ventricular Device 2024 & 2032
- Figure 67: Middle East LVAD Industry Revenue (Billion), by Application 2024 & 2032
- Figure 68: Middle East LVAD Industry Volume (Piece), by Application 2024 & 2032
- Figure 69: Middle East LVAD Industry Revenue Share (%), by Application 2024 & 2032
- Figure 70: Middle East LVAD Industry Volume Share (%), by Application 2024 & 2032
- Figure 71: Middle East LVAD Industry Revenue (Billion), by Country 2024 & 2032
- Figure 72: Middle East LVAD Industry Volume (Piece), by Country 2024 & 2032
- Figure 73: Middle East LVAD Industry Revenue Share (%), by Country 2024 & 2032
- Figure 74: Middle East LVAD Industry Volume Share (%), by Country 2024 & 2032
- Figure 75: GCC LVAD Industry Revenue (Billion), by Type of Ventricular Device 2024 & 2032
- Figure 76: GCC LVAD Industry Volume (Piece), by Type of Ventricular Device 2024 & 2032
- Figure 77: GCC LVAD Industry Revenue Share (%), by Type of Ventricular Device 2024 & 2032
- Figure 78: GCC LVAD Industry Volume Share (%), by Type of Ventricular Device 2024 & 2032
- Figure 79: GCC LVAD Industry Revenue (Billion), by Application 2024 & 2032
- Figure 80: GCC LVAD Industry Volume (Piece), by Application 2024 & 2032
- Figure 81: GCC LVAD Industry Revenue Share (%), by Application 2024 & 2032
- Figure 82: GCC LVAD Industry Volume Share (%), by Application 2024 & 2032
- Figure 83: GCC LVAD Industry Revenue (Billion), by Country 2024 & 2032
- Figure 84: GCC LVAD Industry Volume (Piece), by Country 2024 & 2032
- Figure 85: GCC LVAD Industry Revenue Share (%), by Country 2024 & 2032
- Figure 86: GCC LVAD Industry Volume Share (%), by Country 2024 & 2032
- Figure 87: South America LVAD Industry Revenue (Billion), by Type of Ventricular Device 2024 & 2032
- Figure 88: South America LVAD Industry Volume (Piece), by Type of Ventricular Device 2024 & 2032
- Figure 89: South America LVAD Industry Revenue Share (%), by Type of Ventricular Device 2024 & 2032
- Figure 90: South America LVAD Industry Volume Share (%), by Type of Ventricular Device 2024 & 2032
- Figure 91: South America LVAD Industry Revenue (Billion), by Application 2024 & 2032
- Figure 92: South America LVAD Industry Volume (Piece), by Application 2024 & 2032
- Figure 93: South America LVAD Industry Revenue Share (%), by Application 2024 & 2032
- Figure 94: South America LVAD Industry Volume Share (%), by Application 2024 & 2032
- Figure 95: South America LVAD Industry Revenue (Billion), by Country 2024 & 2032
- Figure 96: South America LVAD Industry Volume (Piece), by Country 2024 & 2032
- Figure 97: South America LVAD Industry Revenue Share (%), by Country 2024 & 2032
- Figure 98: South America LVAD Industry Volume Share (%), by Country 2024 & 2032
List of Tables
- Table 1: Global LVAD Industry Revenue Billion Forecast, by Region 2019 & 2032
- Table 2: Global LVAD Industry Volume Piece Forecast, by Region 2019 & 2032
- Table 3: Global LVAD Industry Revenue Billion Forecast, by Type of Ventricular Device 2019 & 2032
- Table 4: Global LVAD Industry Volume Piece Forecast, by Type of Ventricular Device 2019 & 2032
- Table 5: Global LVAD Industry Revenue Billion Forecast, by Application 2019 & 2032
- Table 6: Global LVAD Industry Volume Piece Forecast, by Application 2019 & 2032
- Table 7: Global LVAD Industry Revenue Billion Forecast, by Region 2019 & 2032
- Table 8: Global LVAD Industry Volume Piece Forecast, by Region 2019 & 2032
- Table 9: Global LVAD Industry Revenue Billion Forecast, by Country 2019 & 2032
- Table 10: Global LVAD Industry Volume Piece Forecast, by Country 2019 & 2032
- Table 11: United States LVAD Industry Revenue (Billion) Forecast, by Application 2019 & 2032
- Table 12: United States LVAD Industry Volume (Piece) Forecast, by Application 2019 & 2032
- Table 13: Canada LVAD Industry Revenue (Billion) Forecast, by Application 2019 & 2032
- Table 14: Canada LVAD Industry Volume (Piece) Forecast, by Application 2019 & 2032
- Table 15: Mexico LVAD Industry Revenue (Billion) Forecast, by Application 2019 & 2032
- Table 16: Mexico LVAD Industry Volume (Piece) Forecast, by Application 2019 & 2032
- Table 17: Global LVAD Industry Revenue Billion Forecast, by Country 2019 & 2032
- Table 18: Global LVAD Industry Volume Piece Forecast, by Country 2019 & 2032
- Table 19: Germany LVAD Industry Revenue (Billion) Forecast, by Application 2019 & 2032
- Table 20: Germany LVAD Industry Volume (Piece) Forecast, by Application 2019 & 2032
- Table 21: United Kingdom LVAD Industry Revenue (Billion) Forecast, by Application 2019 & 2032
- Table 22: United Kingdom LVAD Industry Volume (Piece) Forecast, by Application 2019 & 2032
- Table 23: France LVAD Industry Revenue (Billion) Forecast, by Application 2019 & 2032
- Table 24: France LVAD Industry Volume (Piece) Forecast, by Application 2019 & 2032
- Table 25: Italy LVAD Industry Revenue (Billion) Forecast, by Application 2019 & 2032
- Table 26: Italy LVAD Industry Volume (Piece) Forecast, by Application 2019 & 2032
- Table 27: Spain LVAD Industry Revenue (Billion) Forecast, by Application 2019 & 2032
- Table 28: Spain LVAD Industry Volume (Piece) Forecast, by Application 2019 & 2032
- Table 29: Rest of Europe LVAD Industry Revenue (Billion) Forecast, by Application 2019 & 2032
- Table 30: Rest of Europe LVAD Industry Volume (Piece) Forecast, by Application 2019 & 2032
- Table 31: Global LVAD Industry Revenue Billion Forecast, by Country 2019 & 2032
- Table 32: Global LVAD Industry Volume Piece Forecast, by Country 2019 & 2032
- Table 33: China LVAD Industry Revenue (Billion) Forecast, by Application 2019 & 2032
- Table 34: China LVAD Industry Volume (Piece) Forecast, by Application 2019 & 2032
- Table 35: Japan LVAD Industry Revenue (Billion) Forecast, by Application 2019 & 2032
- Table 36: Japan LVAD Industry Volume (Piece) Forecast, by Application 2019 & 2032
- Table 37: India LVAD Industry Revenue (Billion) Forecast, by Application 2019 & 2032
- Table 38: India LVAD Industry Volume (Piece) Forecast, by Application 2019 & 2032
- Table 39: Australia LVAD Industry Revenue (Billion) Forecast, by Application 2019 & 2032
- Table 40: Australia LVAD Industry Volume (Piece) Forecast, by Application 2019 & 2032
- Table 41: South Korea LVAD Industry Revenue (Billion) Forecast, by Application 2019 & 2032
- Table 42: South Korea LVAD Industry Volume (Piece) Forecast, by Application 2019 & 2032
- Table 43: Rest of Asia Pacific LVAD Industry Revenue (Billion) Forecast, by Application 2019 & 2032
- Table 44: Rest of Asia Pacific LVAD Industry Volume (Piece) Forecast, by Application 2019 & 2032
- Table 45: Global LVAD Industry Revenue Billion Forecast, by Country 2019 & 2032
- Table 46: Global LVAD Industry Volume Piece Forecast, by Country 2019 & 2032
- Table 47: LVAD Industry Revenue (Billion) Forecast, by Application 2019 & 2032
- Table 48: LVAD Industry Volume (Piece) Forecast, by Application 2019 & 2032
- Table 49: Global LVAD Industry Revenue Billion Forecast, by Country 2019 & 2032
- Table 50: Global LVAD Industry Volume Piece Forecast, by Country 2019 & 2032
- Table 51: South Africa LVAD Industry Revenue (Billion) Forecast, by Application 2019 & 2032
- Table 52: South Africa LVAD Industry Volume (Piece) Forecast, by Application 2019 & 2032
- Table 53: Rest of Middle East LVAD Industry Revenue (Billion) Forecast, by Application 2019 & 2032
- Table 54: Rest of Middle East LVAD Industry Volume (Piece) Forecast, by Application 2019 & 2032
- Table 55: Global LVAD Industry Revenue Billion Forecast, by Country 2019 & 2032
- Table 56: Global LVAD Industry Volume Piece Forecast, by Country 2019 & 2032
- Table 57: Brazil LVAD Industry Revenue (Billion) Forecast, by Application 2019 & 2032
- Table 58: Brazil LVAD Industry Volume (Piece) Forecast, by Application 2019 & 2032
- Table 59: Argentina LVAD Industry Revenue (Billion) Forecast, by Application 2019 & 2032
- Table 60: Argentina LVAD Industry Volume (Piece) Forecast, by Application 2019 & 2032
- Table 61: Rest of South America LVAD Industry Revenue (Billion) Forecast, by Application 2019 & 2032
- Table 62: Rest of South America LVAD Industry Volume (Piece) Forecast, by Application 2019 & 2032
- Table 63: Global LVAD Industry Revenue Billion Forecast, by Type of Ventricular Device 2019 & 2032
- Table 64: Global LVAD Industry Volume Piece Forecast, by Type of Ventricular Device 2019 & 2032
- Table 65: Global LVAD Industry Revenue Billion Forecast, by Application 2019 & 2032
- Table 66: Global LVAD Industry Volume Piece Forecast, by Application 2019 & 2032
- Table 67: Global LVAD Industry Revenue Billion Forecast, by Country 2019 & 2032
- Table 68: Global LVAD Industry Volume Piece Forecast, by Country 2019 & 2032
- Table 69: United States LVAD Industry Revenue (Billion) Forecast, by Application 2019 & 2032
- Table 70: United States LVAD Industry Volume (Piece) Forecast, by Application 2019 & 2032
- Table 71: Canada LVAD Industry Revenue (Billion) Forecast, by Application 2019 & 2032
- Table 72: Canada LVAD Industry Volume (Piece) Forecast, by Application 2019 & 2032
- Table 73: Mexico LVAD Industry Revenue (Billion) Forecast, by Application 2019 & 2032
- Table 74: Mexico LVAD Industry Volume (Piece) Forecast, by Application 2019 & 2032
- Table 75: Global LVAD Industry Revenue Billion Forecast, by Type of Ventricular Device 2019 & 2032
- Table 76: Global LVAD Industry Volume Piece Forecast, by Type of Ventricular Device 2019 & 2032
- Table 77: Global LVAD Industry Revenue Billion Forecast, by Application 2019 & 2032
- Table 78: Global LVAD Industry Volume Piece Forecast, by Application 2019 & 2032
- Table 79: Global LVAD Industry Revenue Billion Forecast, by Country 2019 & 2032
- Table 80: Global LVAD Industry Volume Piece Forecast, by Country 2019 & 2032
- Table 81: Germany LVAD Industry Revenue (Billion) Forecast, by Application 2019 & 2032
- Table 82: Germany LVAD Industry Volume (Piece) Forecast, by Application 2019 & 2032
- Table 83: United Kingdom LVAD Industry Revenue (Billion) Forecast, by Application 2019 & 2032
- Table 84: United Kingdom LVAD Industry Volume (Piece) Forecast, by Application 2019 & 2032
- Table 85: France LVAD Industry Revenue (Billion) Forecast, by Application 2019 & 2032
- Table 86: France LVAD Industry Volume (Piece) Forecast, by Application 2019 & 2032
- Table 87: Italy LVAD Industry Revenue (Billion) Forecast, by Application 2019 & 2032
- Table 88: Italy LVAD Industry Volume (Piece) Forecast, by Application 2019 & 2032
- Table 89: Spain LVAD Industry Revenue (Billion) Forecast, by Application 2019 & 2032
- Table 90: Spain LVAD Industry Volume (Piece) Forecast, by Application 2019 & 2032
- Table 91: Rest of Europe LVAD Industry Revenue (Billion) Forecast, by Application 2019 & 2032
- Table 92: Rest of Europe LVAD Industry Volume (Piece) Forecast, by Application 2019 & 2032
- Table 93: Global LVAD Industry Revenue Billion Forecast, by Type of Ventricular Device 2019 & 2032
- Table 94: Global LVAD Industry Volume Piece Forecast, by Type of Ventricular Device 2019 & 2032
- Table 95: Global LVAD Industry Revenue Billion Forecast, by Application 2019 & 2032
- Table 96: Global LVAD Industry Volume Piece Forecast, by Application 2019 & 2032
- Table 97: Global LVAD Industry Revenue Billion Forecast, by Country 2019 & 2032
- Table 98: Global LVAD Industry Volume Piece Forecast, by Country 2019 & 2032
- Table 99: China LVAD Industry Revenue (Billion) Forecast, by Application 2019 & 2032
- Table 100: China LVAD Industry Volume (Piece) Forecast, by Application 2019 & 2032
- Table 101: Japan LVAD Industry Revenue (Billion) Forecast, by Application 2019 & 2032
- Table 102: Japan LVAD Industry Volume (Piece) Forecast, by Application 2019 & 2032
- Table 103: India LVAD Industry Revenue (Billion) Forecast, by Application 2019 & 2032
- Table 104: India LVAD Industry Volume (Piece) Forecast, by Application 2019 & 2032
- Table 105: Australia LVAD Industry Revenue (Billion) Forecast, by Application 2019 & 2032
- Table 106: Australia LVAD Industry Volume (Piece) Forecast, by Application 2019 & 2032
- Table 107: South Korea LVAD Industry Revenue (Billion) Forecast, by Application 2019 & 2032
- Table 108: South Korea LVAD Industry Volume (Piece) Forecast, by Application 2019 & 2032
- Table 109: Rest of Asia Pacific LVAD Industry Revenue (Billion) Forecast, by Application 2019 & 2032
- Table 110: Rest of Asia Pacific LVAD Industry Volume (Piece) Forecast, by Application 2019 & 2032
- Table 111: Global LVAD Industry Revenue Billion Forecast, by Type of Ventricular Device 2019 & 2032
- Table 112: Global LVAD Industry Volume Piece Forecast, by Type of Ventricular Device 2019 & 2032
- Table 113: Global LVAD Industry Revenue Billion Forecast, by Application 2019 & 2032
- Table 114: Global LVAD Industry Volume Piece Forecast, by Application 2019 & 2032
- Table 115: Global LVAD Industry Revenue Billion Forecast, by Country 2019 & 2032
- Table 116: Global LVAD Industry Volume Piece Forecast, by Country 2019 & 2032
- Table 117: Global LVAD Industry Revenue Billion Forecast, by Type of Ventricular Device 2019 & 2032
- Table 118: Global LVAD Industry Volume Piece Forecast, by Type of Ventricular Device 2019 & 2032
- Table 119: Global LVAD Industry Revenue Billion Forecast, by Application 2019 & 2032
- Table 120: Global LVAD Industry Volume Piece Forecast, by Application 2019 & 2032
- Table 121: Global LVAD Industry Revenue Billion Forecast, by Country 2019 & 2032
- Table 122: Global LVAD Industry Volume Piece Forecast, by Country 2019 & 2032
- Table 123: South Africa LVAD Industry Revenue (Billion) Forecast, by Application 2019 & 2032
- Table 124: South Africa LVAD Industry Volume (Piece) Forecast, by Application 2019 & 2032
- Table 125: Rest of Middle East LVAD Industry Revenue (Billion) Forecast, by Application 2019 & 2032
- Table 126: Rest of Middle East LVAD Industry Volume (Piece) Forecast, by Application 2019 & 2032
- Table 127: Global LVAD Industry Revenue Billion Forecast, by Type of Ventricular Device 2019 & 2032
- Table 128: Global LVAD Industry Volume Piece Forecast, by Type of Ventricular Device 2019 & 2032
- Table 129: Global LVAD Industry Revenue Billion Forecast, by Application 2019 & 2032
- Table 130: Global LVAD Industry Volume Piece Forecast, by Application 2019 & 2032
- Table 131: Global LVAD Industry Revenue Billion Forecast, by Country 2019 & 2032
- Table 132: Global LVAD Industry Volume Piece Forecast, by Country 2019 & 2032
- Table 133: Brazil LVAD Industry Revenue (Billion) Forecast, by Application 2019 & 2032
- Table 134: Brazil LVAD Industry Volume (Piece) Forecast, by Application 2019 & 2032
- Table 135: Argentina LVAD Industry Revenue (Billion) Forecast, by Application 2019 & 2032
- Table 136: Argentina LVAD Industry Volume (Piece) Forecast, by Application 2019 & 2032
- Table 137: Rest of South America LVAD Industry Revenue (Billion) Forecast, by Application 2019 & 2032
- Table 138: Rest of South America LVAD Industry Volume (Piece) Forecast, by Application 2019 & 2032
Frequently Asked Questions
1. What is the projected Compound Annual Growth Rate (CAGR) of the LVAD Industry?
The projected CAGR is approximately 7.23%.
2. Which companies are prominent players in the LVAD Industry?
Key companies in the market include Abiomed Inc, Calon Cardio, Terumo Corporation*List Not Exhaustive, SynCardia Systems LLC, Jarvik Heart Inc, Medtronic PLC, Abbott Laboratories (St Jude Medical Inc ), BiVACOR Inc, Berlin Heart GmbH.
3. What are the main segments of the LVAD Industry?
The market segments include Type of Ventricular Device, Application.
4. Can you provide details about the market size?
The market size is estimated to be USD 1.8 Billion as of 2022.
5. What are some drivers contributing to market growth?
Growing Burden of Cardiac Diseases and Heart Failure; Technological Advancement of Devices for Cardiac Diseases Management; Growing Initiatives and Awareness Regarding Cardiovascular Diseases.
6. What are the notable trends driving market growth?
Left Ventricular Assist Device (LVAD) is Expected to Hold the Major Share in the Type of Ventricular Device Segment.
7. Are there any restraints impacting market growth?
High Cost of Devices and Procedures; Several Risks Associated to VAD Implant.
8. Can you provide examples of recent developments in the market?
In January 2022, the School of Medical Research and Technology (SMRT) of IIT Kanpur has launched Hridyantra, a challenge-based program to develop an advanced artificial heart also called Left Ventricular Assist device (LVAD) for patients with end-stage heart failure.
9. What pricing options are available for accessing the report?
Pricing options include single-user, multi-user, and enterprise licenses priced at USD 4750, USD 5250, and USD 8750 respectively.
10. Is the market size provided in terms of value or volume?
The market size is provided in terms of value, measured in Billion and volume, measured in Piece.
11. Are there any specific market keywords associated with the report?
Yes, the market keyword associated with the report is "LVAD Industry," which aids in identifying and referencing the specific market segment covered.
12. How do I determine which pricing option suits my needs best?
The pricing options vary based on user requirements and access needs. Individual users may opt for single-user licenses, while businesses requiring broader access may choose multi-user or enterprise licenses for cost-effective access to the report.
13. Are there any additional resources or data provided in the LVAD Industry report?
While the report offers comprehensive insights, it's advisable to review the specific contents or supplementary materials provided to ascertain if additional resources or data are available.
14. How can I stay updated on further developments or reports in the LVAD Industry?
To stay informed about further developments, trends, and reports in the LVAD Industry, consider subscribing to industry newsletters, following relevant companies and organizations, or regularly checking reputable industry news sources and publications.
Methodology
Step 1 - Identification of Relevant Samples Size from Population Database


Step 2 - Approaches for Defining Global Market Size (Value, Volume* & Price*)

Note*: In applicable scenarios
Step 3 - Data Sources
Primary Research
- Web Analytics
- Survey Reports
- Research Institute
- Latest Research Reports
- Opinion Leaders
Secondary Research
- Annual Reports
- White Paper
- Latest Press Release
- Industry Association
- Paid Database
- Investor Presentations

Step 4 - Data Triangulation
Involves using different sources of information in order to increase the validity of a study
These sources are likely to be stakeholders in a program - participants, other researchers, program staff, other community members, and so on.
Then we put all data in single framework & apply various statistical tools to find out the dynamic on the market.
During the analysis stage, feedback from the stakeholder groups would be compared to determine areas of agreement as well as areas of divergence


