
Key Insights
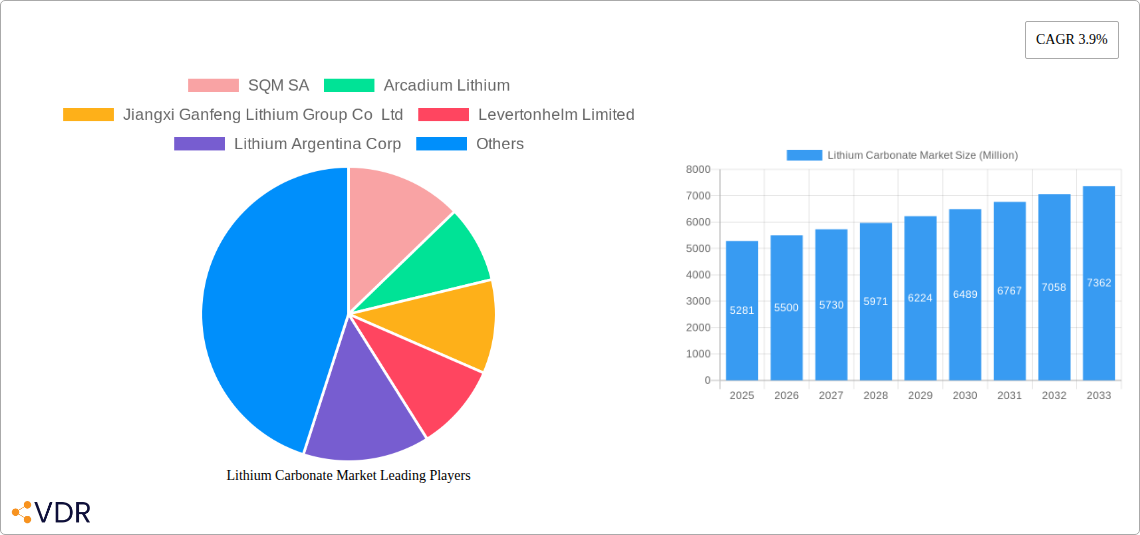
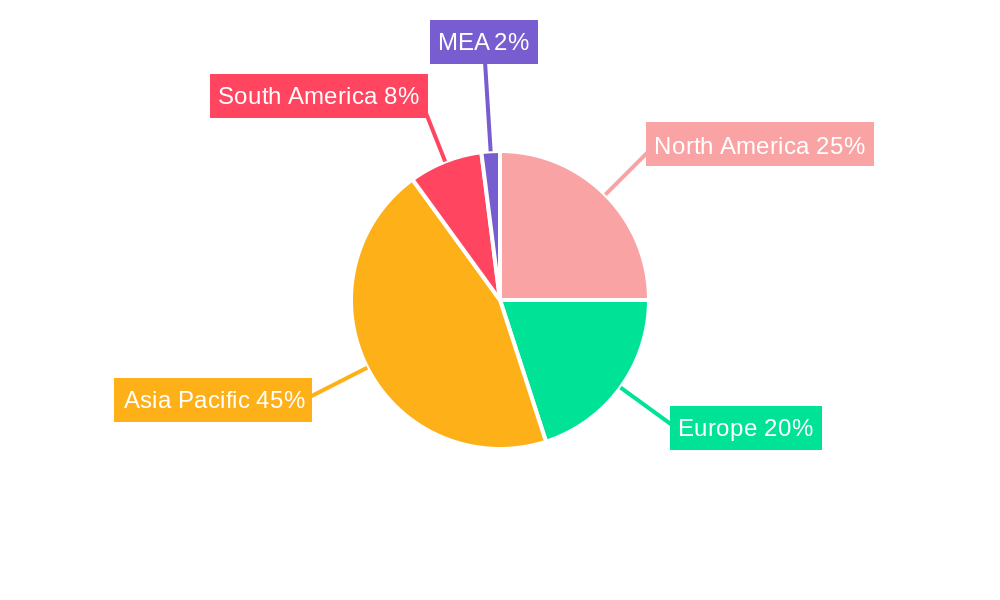
The lithium carbonate market, valued at $5,281 million in 2025, is projected to experience robust growth, driven primarily by the burgeoning electric vehicle (EV) sector's insatiable demand for lithium-ion batteries. The 3.9% CAGR indicates a steady expansion, although this rate might fluctuate based on factors such as raw material availability, geopolitical stability, and technological advancements in battery technology. Significant growth drivers include the increasing adoption of renewable energy sources, stringent government regulations promoting electric mobility, and the expanding global demand for portable electronic devices. The market is segmented by grade (technical, battery, industrial) and application (Li-ion batteries, pharmaceuticals, glass & ceramics, aluminum production, cement, others), with Li-ion batteries dominating the application segment due to their crucial role in EVs and energy storage systems. Competition is fierce, with major players like Albemarle Corporation, SQM SA, and Tianqi Lithium Industry Co Ltd vying for market share through strategic partnerships, capacity expansions, and technological innovations. Regional distribution sees Asia-Pacific, particularly China, as the leading consumer, fueled by its massive EV market and manufacturing capabilities, followed by North America and Europe. Challenges include price volatility linked to supply chain disruptions and the environmental concerns associated with lithium extraction. However, ongoing research into sustainable lithium extraction methods and recycling initiatives are expected to mitigate some of these concerns.
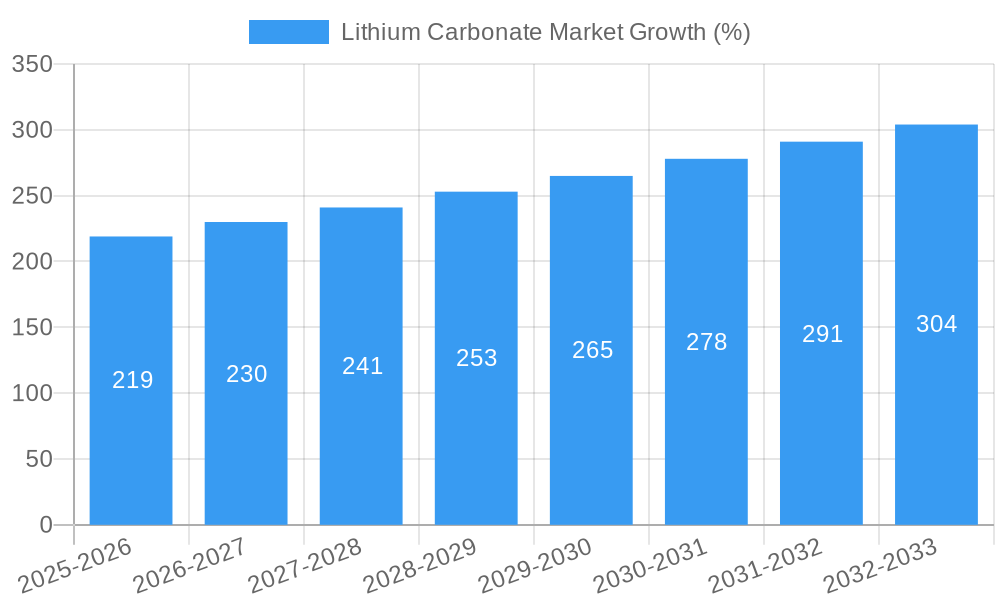
The forecast period (2025-2033) anticipates continued market expansion, albeit with potential variations based on economic fluctuations and advancements in alternative battery technologies. The industrial grade segment is expected to see steady growth driven by its use in various industrial processes, while the battery grade will experience the most significant growth, mirroring the explosive growth of the EV industry. Companies are actively investing in upstream and downstream operations to secure supply chains and improve their market positions. Geographic diversification is also a key strategy, with companies expanding their operations into regions with abundant lithium resources to lessen dependence on specific sources and manage geopolitical risks. Overall, the lithium carbonate market presents a dynamic and lucrative landscape characterized by both significant opportunities and substantial challenges for industry participants.
Lithium Carbonate Market Report: 2019-2033 Forecast
This comprehensive report provides an in-depth analysis of the global Lithium Carbonate market, encompassing market dynamics, growth trends, regional dominance, product landscape, key players, and future outlook. The study period covers 2019-2033, with a base year of 2025 and a forecast period of 2025-2033. This report is crucial for industry professionals, investors, and stakeholders seeking a clear understanding of this rapidly evolving market. The report is segmented by grade (Technical Grade, Battery Grade, Industrial Grade) and application (Li-ion Battery, Pharmaceuticals and Dental, Glass and Ceramics, Aluminum Production, Cement Industry, Other Applications).
Lithium Carbonate Market Dynamics & Structure
The lithium carbonate market is characterized by moderate concentration, with several key players dominating the landscape. Technological innovation, particularly in battery technology, is a major driver, while stringent environmental regulations and the availability of substitute materials influence market dynamics. Mergers and acquisitions (M&A) activity is significant, reflecting industry consolidation and the pursuit of scale.
- Market Concentration: The top 5 players hold approximately xx% of the global market share (2024).
- Technological Innovation: Advancements in battery technology, particularly for electric vehicles (EVs), are fueling demand for high-purity battery-grade lithium carbonate. Innovation barriers include high capital expenditures for new production facilities and the complexity of lithium extraction processes.
- Regulatory Frameworks: Government policies promoting EV adoption and renewable energy are driving demand, while environmental regulations impact production methods and costs.
- Competitive Product Substitutes: Alternatives to lithium-ion batteries are under development, posing a potential long-term threat, although their current market penetration is limited.
- End-User Demographics: The automotive industry is the largest end-user, followed by the ceramics and glass industries. Shifting consumer preferences towards EVs are significantly impacting demand.
- M&A Trends: The recent merger of Allkem and Livent to form Arcadium Lithium highlights the ongoing consolidation in the industry, aimed at achieving economies of scale and securing raw material supply. The number of M&A deals in the sector totalled xx in 2024.
Lithium Carbonate Market Growth Trends & Insights
The global lithium carbonate market experienced significant growth during the historical period (2019-2024), driven primarily by the rising demand from the electric vehicle (EV) industry. The market size reached xx million units in 2024 and is projected to reach xx million units by 2033, exhibiting a CAGR of xx% during the forecast period (2025-2033). This growth is attributed to several factors, including the increasing adoption of EVs globally, technological advancements leading to improved battery performance, and supportive government policies promoting renewable energy. The market penetration of lithium-ion batteries in various applications continues to increase, further bolstering demand. Technological disruptions, like the development of solid-state batteries, could significantly alter the market landscape in the long term, although their mass adoption remains some years away. Consumer behavior shifts towards sustainable transportation and energy solutions are also supporting market expansion.
Dominant Regions, Countries, or Segments in Lithium Carbonate Market
The Asia-Pacific region is currently the dominant market for lithium carbonate, driven by strong demand from China, Japan, and South Korea, primarily due to the large-scale manufacturing of EVs and batteries in these countries. However, North America and Europe are experiencing rapid growth, fuelled by government incentives and increasing EV adoption.
- By Grade: The battery-grade segment holds the largest market share, followed by technical grade and industrial grade. The battery grade segment is expected to maintain its dominance owing to the robust growth of the EV industry.
- By Application: The lithium-ion battery segment constitutes the major share of the market due to its widespread use in portable electronics, electric vehicles, and energy storage systems. The pharmaceutical and dental application segment also shows promising growth.
- Key Drivers:
- Robust growth of the EV industry.
- Increasing demand for energy storage solutions.
- Government initiatives and policies promoting renewable energy.
- Expanding infrastructure for lithium mining and processing.
- Dominance Factors: Abundant lithium resources, established manufacturing infrastructure, and supportive government policies contribute to the dominance of specific regions and segments.
Lithium Carbonate Market Product Landscape
Lithium carbonate products are categorized by purity and grade, with battery-grade lithium carbonate commanding a premium due to its higher purity and suitability for high-performance batteries. Technological advancements focus on improving extraction methods to enhance purity and reduce costs, while also exploring sustainable and environmentally friendly production techniques. The unique selling propositions of various lithium carbonate products include high purity, consistent quality, and tailored specifications for different applications.
Key Drivers, Barriers & Challenges in Lithium Carbonate Market
Key Drivers: The electric vehicle revolution, increasing demand for energy storage systems, and government incentives for renewable energy are the primary growth drivers. Technological advancements leading to more efficient battery technologies further amplify this trend.
Key Challenges & Restraints: Supply chain disruptions, geopolitical uncertainties impacting raw material availability, and fluctuating lithium prices pose significant challenges. Stringent environmental regulations and potential social resistance against lithium mining activities also hinder growth. Competitive pressures from emerging technologies and substitutes create further obstacles. The impact of these challenges can be quantified through reduced profitability and project delays.
Emerging Opportunities in Lithium Carbonate Market
Untapped markets in developing economies, particularly in Southeast Asia and Africa, present significant growth opportunities. Innovative applications of lithium carbonate in advanced battery technologies (solid-state batteries) and other emerging sectors hold immense potential. Evolving consumer preferences for sustainable products and technologies further create favorable market conditions.
Growth Accelerators in the Lithium Carbonate Market Industry
Technological breakthroughs in lithium extraction and processing, coupled with strategic partnerships between lithium producers and battery manufacturers, are accelerating market growth. Market expansion into new geographical regions and diversification into new applications are also significant catalysts.
Key Players Shaping the Lithium Carbonate Market Market
- SQM SA
- Arcadium Lithium
- Jiangxi Ganfeng Lithium Group Co Ltd
- Levertonhelm Limited
- Lithium Argentina Corp
- Shandong Ruifu Lithium Co Ltd
- Lithium Americas Corp
- Albemarle Corporation
- Tianqi Lithium Industry Co Ltd
Notable Milestones in Lithium Carbonate Market Sector
- May 2023: SQM SA and Ford Motor Company announced a long-term strategic agreement to supply battery-grade lithium carbonate.
- October 2023: General Motors invested USD 329.85 million in Lithium Americas, securing exclusive rights to Thacker Pass lithium production.
- January 2024: Allkem and Livent merged to form Arcadium Lithium, expanding production capacity.
In-Depth Lithium Carbonate Market Market Outlook
The lithium carbonate market is poised for sustained growth, driven by the ongoing expansion of the EV industry and the increasing demand for energy storage solutions. Strategic investments in new production capacity, technological advancements, and strategic partnerships will shape future market dynamics. Companies focusing on sustainable and efficient production methods will gain a competitive edge. The market presents significant opportunities for companies capable of navigating the challenges related to supply chain stability and environmental regulations.
Lithium Carbonate Market Segmentation
-
1. Grade
- 1.1. Technical Grade
- 1.2. Battery Grade
- 1.3. Industrial Grade
-
2. Application
- 2.1. Li-ion Battery
- 2.2. Pharmaceuticals and Dental
- 2.3. Glass and Ceramics
- 2.4. Aluminum Production
- 2.5. Cement Industry
- 2.6. Other Applications
Lithium Carbonate Market Segmentation By Geography
-
1. Asia Pacific
- 1.1. China
- 1.2. India
- 1.3. Japan
- 1.4. South Korea
- 1.5. Rest of Asia Pacific
-
2. North America
- 2.1. United States
- 2.2. Canada
- 2.3. Mexico
-
3. Europe
- 3.1. Germany
- 3.2. United Kingdom
- 3.3. France
- 3.4. Italy
- 3.5. Rest of Europe
-
4. South America
- 4.1. Brazil
- 4.2. Argentina
- 4.3. Rest of South America
-
5. Middle East and Africa
- 5.1. Saudi Arabia
- 5.2. South Africa
- 5.3. Rest of Middle East and Africa
Lithium Carbonate Market REPORT HIGHLIGHTS
| Aspects | Details |
|---|---|
| Study Period | 2019-2033 |
| Base Year | 2024 |
| Estimated Year | 2025 |
| Forecast Period | 2025-2033 |
| Historical Period | 2019-2024 |
| Growth Rate | CAGR of 3.9% from 2019-2033 |
| Segmentation |
|
Table of Contents
- 1. Introduction
- 1.1. Research Scope
- 1.2. Market Segmentation
- 1.3. Research Methodology
- 1.4. Definitions and Assumptions
- 2. Executive Summary
- 2.1. Introduction
- 3. Market Dynamics
- 3.1. Introduction
- 3.2. Market Drivers
- 3.2.1. Growing Demand From Lithium-ion Batteries; Increasing Investments in the Glass and Ceramics Industry
- 3.3. Market Restrains
- 3.3.1. Constraints in Lithium Extraction and Geographical Restriction of Lithium Mines
- 3.4. Market Trends
- 3.4.1. Li-Ion Battery Applications Expected to Drive Growth
- 4. Market Factor Analysis
- 4.1. Porters Five Forces
- 4.2. Supply/Value Chain
- 4.3. PESTEL analysis
- 4.4. Market Entropy
- 4.5. Patent/Trademark Analysis
- 5. Global Lithium Carbonate Market Analysis, Insights and Forecast, 2019-2031
- 5.1. Market Analysis, Insights and Forecast - by Grade
- 5.1.1. Technical Grade
- 5.1.2. Battery Grade
- 5.1.3. Industrial Grade
- 5.2. Market Analysis, Insights and Forecast - by Application
- 5.2.1. Li-ion Battery
- 5.2.2. Pharmaceuticals and Dental
- 5.2.3. Glass and Ceramics
- 5.2.4. Aluminum Production
- 5.2.5. Cement Industry
- 5.2.6. Other Applications
- 5.3. Market Analysis, Insights and Forecast - by Region
- 5.3.1. Asia Pacific
- 5.3.2. North America
- 5.3.3. Europe
- 5.3.4. South America
- 5.3.5. Middle East and Africa
- 5.1. Market Analysis, Insights and Forecast - by Grade
- 6. Asia Pacific Lithium Carbonate Market Analysis, Insights and Forecast, 2019-2031
- 6.1. Market Analysis, Insights and Forecast - by Grade
- 6.1.1. Technical Grade
- 6.1.2. Battery Grade
- 6.1.3. Industrial Grade
- 6.2. Market Analysis, Insights and Forecast - by Application
- 6.2.1. Li-ion Battery
- 6.2.2. Pharmaceuticals and Dental
- 6.2.3. Glass and Ceramics
- 6.2.4. Aluminum Production
- 6.2.5. Cement Industry
- 6.2.6. Other Applications
- 6.1. Market Analysis, Insights and Forecast - by Grade
- 7. North America Lithium Carbonate Market Analysis, Insights and Forecast, 2019-2031
- 7.1. Market Analysis, Insights and Forecast - by Grade
- 7.1.1. Technical Grade
- 7.1.2. Battery Grade
- 7.1.3. Industrial Grade
- 7.2. Market Analysis, Insights and Forecast - by Application
- 7.2.1. Li-ion Battery
- 7.2.2. Pharmaceuticals and Dental
- 7.2.3. Glass and Ceramics
- 7.2.4. Aluminum Production
- 7.2.5. Cement Industry
- 7.2.6. Other Applications
- 7.1. Market Analysis, Insights and Forecast - by Grade
- 8. Europe Lithium Carbonate Market Analysis, Insights and Forecast, 2019-2031
- 8.1. Market Analysis, Insights and Forecast - by Grade
- 8.1.1. Technical Grade
- 8.1.2. Battery Grade
- 8.1.3. Industrial Grade
- 8.2. Market Analysis, Insights and Forecast - by Application
- 8.2.1. Li-ion Battery
- 8.2.2. Pharmaceuticals and Dental
- 8.2.3. Glass and Ceramics
- 8.2.4. Aluminum Production
- 8.2.5. Cement Industry
- 8.2.6. Other Applications
- 8.1. Market Analysis, Insights and Forecast - by Grade
- 9. South America Lithium Carbonate Market Analysis, Insights and Forecast, 2019-2031
- 9.1. Market Analysis, Insights and Forecast - by Grade
- 9.1.1. Technical Grade
- 9.1.2. Battery Grade
- 9.1.3. Industrial Grade
- 9.2. Market Analysis, Insights and Forecast - by Application
- 9.2.1. Li-ion Battery
- 9.2.2. Pharmaceuticals and Dental
- 9.2.3. Glass and Ceramics
- 9.2.4. Aluminum Production
- 9.2.5. Cement Industry
- 9.2.6. Other Applications
- 9.1. Market Analysis, Insights and Forecast - by Grade
- 10. Middle East and Africa Lithium Carbonate Market Analysis, Insights and Forecast, 2019-2031
- 10.1. Market Analysis, Insights and Forecast - by Grade
- 10.1.1. Technical Grade
- 10.1.2. Battery Grade
- 10.1.3. Industrial Grade
- 10.2. Market Analysis, Insights and Forecast - by Application
- 10.2.1. Li-ion Battery
- 10.2.2. Pharmaceuticals and Dental
- 10.2.3. Glass and Ceramics
- 10.2.4. Aluminum Production
- 10.2.5. Cement Industry
- 10.2.6. Other Applications
- 10.1. Market Analysis, Insights and Forecast - by Grade
- 11. North America Lithium Carbonate Market Analysis, Insights and Forecast, 2019-2031
- 11.1. Market Analysis, Insights and Forecast - By Country/Sub-region
- 11.1.1 United States
- 11.1.2 Canada
- 11.1.3 Mexico
- 12. Europe Lithium Carbonate Market Analysis, Insights and Forecast, 2019-2031
- 12.1. Market Analysis, Insights and Forecast - By Country/Sub-region
- 12.1.1 Germany
- 12.1.2 France
- 12.1.3 Italy
- 12.1.4 United Kingdom
- 12.1.5 Netherlands
- 12.1.6 Rest of Europe
- 13. Asia Pacific Lithium Carbonate Market Analysis, Insights and Forecast, 2019-2031
- 13.1. Market Analysis, Insights and Forecast - By Country/Sub-region
- 13.1.1 China
- 13.1.2 Japan
- 13.1.3 India
- 13.1.4 South Korea
- 13.1.5 Taiwan
- 13.1.6 Australia
- 13.1.7 Rest of Asia-Pacific
- 14. South America Lithium Carbonate Market Analysis, Insights and Forecast, 2019-2031
- 14.1. Market Analysis, Insights and Forecast - By Country/Sub-region
- 14.1.1 Brazil
- 14.1.2 Argentina
- 14.1.3 Rest of South America
- 15. MEA Lithium Carbonate Market Analysis, Insights and Forecast, 2019-2031
- 15.1. Market Analysis, Insights and Forecast - By Country/Sub-region
- 15.1.1 Middle East
- 15.1.2 Africa
- 16. Competitive Analysis
- 16.1. Global Market Share Analysis 2024
- 16.2. Company Profiles
- 16.2.1 SQM SA
- 16.2.1.1. Overview
- 16.2.1.2. Products
- 16.2.1.3. SWOT Analysis
- 16.2.1.4. Recent Developments
- 16.2.1.5. Financials (Based on Availability)
- 16.2.2 Arcadium Lithium
- 16.2.2.1. Overview
- 16.2.2.2. Products
- 16.2.2.3. SWOT Analysis
- 16.2.2.4. Recent Developments
- 16.2.2.5. Financials (Based on Availability)
- 16.2.3 Jiangxi Ganfeng Lithium Group Co Ltd
- 16.2.3.1. Overview
- 16.2.3.2. Products
- 16.2.3.3. SWOT Analysis
- 16.2.3.4. Recent Developments
- 16.2.3.5. Financials (Based on Availability)
- 16.2.4 Levertonhelm Limited
- 16.2.4.1. Overview
- 16.2.4.2. Products
- 16.2.4.3. SWOT Analysis
- 16.2.4.4. Recent Developments
- 16.2.4.5. Financials (Based on Availability)
- 16.2.5 Lithium Argentina Corp
- 16.2.5.1. Overview
- 16.2.5.2. Products
- 16.2.5.3. SWOT Analysis
- 16.2.5.4. Recent Developments
- 16.2.5.5. Financials (Based on Availability)
- 16.2.6 Shandong Ruifu Lithium Co Ltd
- 16.2.6.1. Overview
- 16.2.6.2. Products
- 16.2.6.3. SWOT Analysis
- 16.2.6.4. Recent Developments
- 16.2.6.5. Financials (Based on Availability)
- 16.2.7 Lithium Americas Corp
- 16.2.7.1. Overview
- 16.2.7.2. Products
- 16.2.7.3. SWOT Analysis
- 16.2.7.4. Recent Developments
- 16.2.7.5. Financials (Based on Availability)
- 16.2.8 Albemarle Corporation
- 16.2.8.1. Overview
- 16.2.8.2. Products
- 16.2.8.3. SWOT Analysis
- 16.2.8.4. Recent Developments
- 16.2.8.5. Financials (Based on Availability)
- 16.2.9 Tianqi Lithium Industry Co Ltd
- 16.2.9.1. Overview
- 16.2.9.2. Products
- 16.2.9.3. SWOT Analysis
- 16.2.9.4. Recent Developments
- 16.2.9.5. Financials (Based on Availability)
- 16.2.1 SQM SA
List of Figures
- Figure 1: Global Lithium Carbonate Market Revenue Breakdown (Million, %) by Region 2024 & 2032
- Figure 2: Global Lithium Carbonate Market Volume Breakdown (K Tons, %) by Region 2024 & 2032
- Figure 3: North America Lithium Carbonate Market Revenue (Million), by Country 2024 & 2032
- Figure 4: North America Lithium Carbonate Market Volume (K Tons), by Country 2024 & 2032
- Figure 5: North America Lithium Carbonate Market Revenue Share (%), by Country 2024 & 2032
- Figure 6: North America Lithium Carbonate Market Volume Share (%), by Country 2024 & 2032
- Figure 7: Europe Lithium Carbonate Market Revenue (Million), by Country 2024 & 2032
- Figure 8: Europe Lithium Carbonate Market Volume (K Tons), by Country 2024 & 2032
- Figure 9: Europe Lithium Carbonate Market Revenue Share (%), by Country 2024 & 2032
- Figure 10: Europe Lithium Carbonate Market Volume Share (%), by Country 2024 & 2032
- Figure 11: Asia Pacific Lithium Carbonate Market Revenue (Million), by Country 2024 & 2032
- Figure 12: Asia Pacific Lithium Carbonate Market Volume (K Tons), by Country 2024 & 2032
- Figure 13: Asia Pacific Lithium Carbonate Market Revenue Share (%), by Country 2024 & 2032
- Figure 14: Asia Pacific Lithium Carbonate Market Volume Share (%), by Country 2024 & 2032
- Figure 15: South America Lithium Carbonate Market Revenue (Million), by Country 2024 & 2032
- Figure 16: South America Lithium Carbonate Market Volume (K Tons), by Country 2024 & 2032
- Figure 17: South America Lithium Carbonate Market Revenue Share (%), by Country 2024 & 2032
- Figure 18: South America Lithium Carbonate Market Volume Share (%), by Country 2024 & 2032
- Figure 19: MEA Lithium Carbonate Market Revenue (Million), by Country 2024 & 2032
- Figure 20: MEA Lithium Carbonate Market Volume (K Tons), by Country 2024 & 2032
- Figure 21: MEA Lithium Carbonate Market Revenue Share (%), by Country 2024 & 2032
- Figure 22: MEA Lithium Carbonate Market Volume Share (%), by Country 2024 & 2032
- Figure 23: Asia Pacific Lithium Carbonate Market Revenue (Million), by Grade 2024 & 2032
- Figure 24: Asia Pacific Lithium Carbonate Market Volume (K Tons), by Grade 2024 & 2032
- Figure 25: Asia Pacific Lithium Carbonate Market Revenue Share (%), by Grade 2024 & 2032
- Figure 26: Asia Pacific Lithium Carbonate Market Volume Share (%), by Grade 2024 & 2032
- Figure 27: Asia Pacific Lithium Carbonate Market Revenue (Million), by Application 2024 & 2032
- Figure 28: Asia Pacific Lithium Carbonate Market Volume (K Tons), by Application 2024 & 2032
- Figure 29: Asia Pacific Lithium Carbonate Market Revenue Share (%), by Application 2024 & 2032
- Figure 30: Asia Pacific Lithium Carbonate Market Volume Share (%), by Application 2024 & 2032
- Figure 31: Asia Pacific Lithium Carbonate Market Revenue (Million), by Country 2024 & 2032
- Figure 32: Asia Pacific Lithium Carbonate Market Volume (K Tons), by Country 2024 & 2032
- Figure 33: Asia Pacific Lithium Carbonate Market Revenue Share (%), by Country 2024 & 2032
- Figure 34: Asia Pacific Lithium Carbonate Market Volume Share (%), by Country 2024 & 2032
- Figure 35: North America Lithium Carbonate Market Revenue (Million), by Grade 2024 & 2032
- Figure 36: North America Lithium Carbonate Market Volume (K Tons), by Grade 2024 & 2032
- Figure 37: North America Lithium Carbonate Market Revenue Share (%), by Grade 2024 & 2032
- Figure 38: North America Lithium Carbonate Market Volume Share (%), by Grade 2024 & 2032
- Figure 39: North America Lithium Carbonate Market Revenue (Million), by Application 2024 & 2032
- Figure 40: North America Lithium Carbonate Market Volume (K Tons), by Application 2024 & 2032
- Figure 41: North America Lithium Carbonate Market Revenue Share (%), by Application 2024 & 2032
- Figure 42: North America Lithium Carbonate Market Volume Share (%), by Application 2024 & 2032
- Figure 43: North America Lithium Carbonate Market Revenue (Million), by Country 2024 & 2032
- Figure 44: North America Lithium Carbonate Market Volume (K Tons), by Country 2024 & 2032
- Figure 45: North America Lithium Carbonate Market Revenue Share (%), by Country 2024 & 2032
- Figure 46: North America Lithium Carbonate Market Volume Share (%), by Country 2024 & 2032
- Figure 47: Europe Lithium Carbonate Market Revenue (Million), by Grade 2024 & 2032
- Figure 48: Europe Lithium Carbonate Market Volume (K Tons), by Grade 2024 & 2032
- Figure 49: Europe Lithium Carbonate Market Revenue Share (%), by Grade 2024 & 2032
- Figure 50: Europe Lithium Carbonate Market Volume Share (%), by Grade 2024 & 2032
- Figure 51: Europe Lithium Carbonate Market Revenue (Million), by Application 2024 & 2032
- Figure 52: Europe Lithium Carbonate Market Volume (K Tons), by Application 2024 & 2032
- Figure 53: Europe Lithium Carbonate Market Revenue Share (%), by Application 2024 & 2032
- Figure 54: Europe Lithium Carbonate Market Volume Share (%), by Application 2024 & 2032
- Figure 55: Europe Lithium Carbonate Market Revenue (Million), by Country 2024 & 2032
- Figure 56: Europe Lithium Carbonate Market Volume (K Tons), by Country 2024 & 2032
- Figure 57: Europe Lithium Carbonate Market Revenue Share (%), by Country 2024 & 2032
- Figure 58: Europe Lithium Carbonate Market Volume Share (%), by Country 2024 & 2032
- Figure 59: South America Lithium Carbonate Market Revenue (Million), by Grade 2024 & 2032
- Figure 60: South America Lithium Carbonate Market Volume (K Tons), by Grade 2024 & 2032
- Figure 61: South America Lithium Carbonate Market Revenue Share (%), by Grade 2024 & 2032
- Figure 62: South America Lithium Carbonate Market Volume Share (%), by Grade 2024 & 2032
- Figure 63: South America Lithium Carbonate Market Revenue (Million), by Application 2024 & 2032
- Figure 64: South America Lithium Carbonate Market Volume (K Tons), by Application 2024 & 2032
- Figure 65: South America Lithium Carbonate Market Revenue Share (%), by Application 2024 & 2032
- Figure 66: South America Lithium Carbonate Market Volume Share (%), by Application 2024 & 2032
- Figure 67: South America Lithium Carbonate Market Revenue (Million), by Country 2024 & 2032
- Figure 68: South America Lithium Carbonate Market Volume (K Tons), by Country 2024 & 2032
- Figure 69: South America Lithium Carbonate Market Revenue Share (%), by Country 2024 & 2032
- Figure 70: South America Lithium Carbonate Market Volume Share (%), by Country 2024 & 2032
- Figure 71: Middle East and Africa Lithium Carbonate Market Revenue (Million), by Grade 2024 & 2032
- Figure 72: Middle East and Africa Lithium Carbonate Market Volume (K Tons), by Grade 2024 & 2032
- Figure 73: Middle East and Africa Lithium Carbonate Market Revenue Share (%), by Grade 2024 & 2032
- Figure 74: Middle East and Africa Lithium Carbonate Market Volume Share (%), by Grade 2024 & 2032
- Figure 75: Middle East and Africa Lithium Carbonate Market Revenue (Million), by Application 2024 & 2032
- Figure 76: Middle East and Africa Lithium Carbonate Market Volume (K Tons), by Application 2024 & 2032
- Figure 77: Middle East and Africa Lithium Carbonate Market Revenue Share (%), by Application 2024 & 2032
- Figure 78: Middle East and Africa Lithium Carbonate Market Volume Share (%), by Application 2024 & 2032
- Figure 79: Middle East and Africa Lithium Carbonate Market Revenue (Million), by Country 2024 & 2032
- Figure 80: Middle East and Africa Lithium Carbonate Market Volume (K Tons), by Country 2024 & 2032
- Figure 81: Middle East and Africa Lithium Carbonate Market Revenue Share (%), by Country 2024 & 2032
- Figure 82: Middle East and Africa Lithium Carbonate Market Volume Share (%), by Country 2024 & 2032
List of Tables
- Table 1: Global Lithium Carbonate Market Revenue Million Forecast, by Region 2019 & 2032
- Table 2: Global Lithium Carbonate Market Volume K Tons Forecast, by Region 2019 & 2032
- Table 3: Global Lithium Carbonate Market Revenue Million Forecast, by Grade 2019 & 2032
- Table 4: Global Lithium Carbonate Market Volume K Tons Forecast, by Grade 2019 & 2032
- Table 5: Global Lithium Carbonate Market Revenue Million Forecast, by Application 2019 & 2032
- Table 6: Global Lithium Carbonate Market Volume K Tons Forecast, by Application 2019 & 2032
- Table 7: Global Lithium Carbonate Market Revenue Million Forecast, by Region 2019 & 2032
- Table 8: Global Lithium Carbonate Market Volume K Tons Forecast, by Region 2019 & 2032
- Table 9: Global Lithium Carbonate Market Revenue Million Forecast, by Country 2019 & 2032
- Table 10: Global Lithium Carbonate Market Volume K Tons Forecast, by Country 2019 & 2032
- Table 11: United States Lithium Carbonate Market Revenue (Million) Forecast, by Application 2019 & 2032
- Table 12: United States Lithium Carbonate Market Volume (K Tons) Forecast, by Application 2019 & 2032
- Table 13: Canada Lithium Carbonate Market Revenue (Million) Forecast, by Application 2019 & 2032
- Table 14: Canada Lithium Carbonate Market Volume (K Tons) Forecast, by Application 2019 & 2032
- Table 15: Mexico Lithium Carbonate Market Revenue (Million) Forecast, by Application 2019 & 2032
- Table 16: Mexico Lithium Carbonate Market Volume (K Tons) Forecast, by Application 2019 & 2032
- Table 17: Global Lithium Carbonate Market Revenue Million Forecast, by Country 2019 & 2032
- Table 18: Global Lithium Carbonate Market Volume K Tons Forecast, by Country 2019 & 2032
- Table 19: Germany Lithium Carbonate Market Revenue (Million) Forecast, by Application 2019 & 2032
- Table 20: Germany Lithium Carbonate Market Volume (K Tons) Forecast, by Application 2019 & 2032
- Table 21: France Lithium Carbonate Market Revenue (Million) Forecast, by Application 2019 & 2032
- Table 22: France Lithium Carbonate Market Volume (K Tons) Forecast, by Application 2019 & 2032
- Table 23: Italy Lithium Carbonate Market Revenue (Million) Forecast, by Application 2019 & 2032
- Table 24: Italy Lithium Carbonate Market Volume (K Tons) Forecast, by Application 2019 & 2032
- Table 25: United Kingdom Lithium Carbonate Market Revenue (Million) Forecast, by Application 2019 & 2032
- Table 26: United Kingdom Lithium Carbonate Market Volume (K Tons) Forecast, by Application 2019 & 2032
- Table 27: Netherlands Lithium Carbonate Market Revenue (Million) Forecast, by Application 2019 & 2032
- Table 28: Netherlands Lithium Carbonate Market Volume (K Tons) Forecast, by Application 2019 & 2032
- Table 29: Rest of Europe Lithium Carbonate Market Revenue (Million) Forecast, by Application 2019 & 2032
- Table 30: Rest of Europe Lithium Carbonate Market Volume (K Tons) Forecast, by Application 2019 & 2032
- Table 31: Global Lithium Carbonate Market Revenue Million Forecast, by Country 2019 & 2032
- Table 32: Global Lithium Carbonate Market Volume K Tons Forecast, by Country 2019 & 2032
- Table 33: China Lithium Carbonate Market Revenue (Million) Forecast, by Application 2019 & 2032
- Table 34: China Lithium Carbonate Market Volume (K Tons) Forecast, by Application 2019 & 2032
- Table 35: Japan Lithium Carbonate Market Revenue (Million) Forecast, by Application 2019 & 2032
- Table 36: Japan Lithium Carbonate Market Volume (K Tons) Forecast, by Application 2019 & 2032
- Table 37: India Lithium Carbonate Market Revenue (Million) Forecast, by Application 2019 & 2032
- Table 38: India Lithium Carbonate Market Volume (K Tons) Forecast, by Application 2019 & 2032
- Table 39: South Korea Lithium Carbonate Market Revenue (Million) Forecast, by Application 2019 & 2032
- Table 40: South Korea Lithium Carbonate Market Volume (K Tons) Forecast, by Application 2019 & 2032
- Table 41: Taiwan Lithium Carbonate Market Revenue (Million) Forecast, by Application 2019 & 2032
- Table 42: Taiwan Lithium Carbonate Market Volume (K Tons) Forecast, by Application 2019 & 2032
- Table 43: Australia Lithium Carbonate Market Revenue (Million) Forecast, by Application 2019 & 2032
- Table 44: Australia Lithium Carbonate Market Volume (K Tons) Forecast, by Application 2019 & 2032
- Table 45: Rest of Asia-Pacific Lithium Carbonate Market Revenue (Million) Forecast, by Application 2019 & 2032
- Table 46: Rest of Asia-Pacific Lithium Carbonate Market Volume (K Tons) Forecast, by Application 2019 & 2032
- Table 47: Global Lithium Carbonate Market Revenue Million Forecast, by Country 2019 & 2032
- Table 48: Global Lithium Carbonate Market Volume K Tons Forecast, by Country 2019 & 2032
- Table 49: Brazil Lithium Carbonate Market Revenue (Million) Forecast, by Application 2019 & 2032
- Table 50: Brazil Lithium Carbonate Market Volume (K Tons) Forecast, by Application 2019 & 2032
- Table 51: Argentina Lithium Carbonate Market Revenue (Million) Forecast, by Application 2019 & 2032
- Table 52: Argentina Lithium Carbonate Market Volume (K Tons) Forecast, by Application 2019 & 2032
- Table 53: Rest of South America Lithium Carbonate Market Revenue (Million) Forecast, by Application 2019 & 2032
- Table 54: Rest of South America Lithium Carbonate Market Volume (K Tons) Forecast, by Application 2019 & 2032
- Table 55: Global Lithium Carbonate Market Revenue Million Forecast, by Country 2019 & 2032
- Table 56: Global Lithium Carbonate Market Volume K Tons Forecast, by Country 2019 & 2032
- Table 57: Middle East Lithium Carbonate Market Revenue (Million) Forecast, by Application 2019 & 2032
- Table 58: Middle East Lithium Carbonate Market Volume (K Tons) Forecast, by Application 2019 & 2032
- Table 59: Africa Lithium Carbonate Market Revenue (Million) Forecast, by Application 2019 & 2032
- Table 60: Africa Lithium Carbonate Market Volume (K Tons) Forecast, by Application 2019 & 2032
- Table 61: Global Lithium Carbonate Market Revenue Million Forecast, by Grade 2019 & 2032
- Table 62: Global Lithium Carbonate Market Volume K Tons Forecast, by Grade 2019 & 2032
- Table 63: Global Lithium Carbonate Market Revenue Million Forecast, by Application 2019 & 2032
- Table 64: Global Lithium Carbonate Market Volume K Tons Forecast, by Application 2019 & 2032
- Table 65: Global Lithium Carbonate Market Revenue Million Forecast, by Country 2019 & 2032
- Table 66: Global Lithium Carbonate Market Volume K Tons Forecast, by Country 2019 & 2032
- Table 67: China Lithium Carbonate Market Revenue (Million) Forecast, by Application 2019 & 2032
- Table 68: China Lithium Carbonate Market Volume (K Tons) Forecast, by Application 2019 & 2032
- Table 69: India Lithium Carbonate Market Revenue (Million) Forecast, by Application 2019 & 2032
- Table 70: India Lithium Carbonate Market Volume (K Tons) Forecast, by Application 2019 & 2032
- Table 71: Japan Lithium Carbonate Market Revenue (Million) Forecast, by Application 2019 & 2032
- Table 72: Japan Lithium Carbonate Market Volume (K Tons) Forecast, by Application 2019 & 2032
- Table 73: South Korea Lithium Carbonate Market Revenue (Million) Forecast, by Application 2019 & 2032
- Table 74: South Korea Lithium Carbonate Market Volume (K Tons) Forecast, by Application 2019 & 2032
- Table 75: Rest of Asia Pacific Lithium Carbonate Market Revenue (Million) Forecast, by Application 2019 & 2032
- Table 76: Rest of Asia Pacific Lithium Carbonate Market Volume (K Tons) Forecast, by Application 2019 & 2032
- Table 77: Global Lithium Carbonate Market Revenue Million Forecast, by Grade 2019 & 2032
- Table 78: Global Lithium Carbonate Market Volume K Tons Forecast, by Grade 2019 & 2032
- Table 79: Global Lithium Carbonate Market Revenue Million Forecast, by Application 2019 & 2032
- Table 80: Global Lithium Carbonate Market Volume K Tons Forecast, by Application 2019 & 2032
- Table 81: Global Lithium Carbonate Market Revenue Million Forecast, by Country 2019 & 2032
- Table 82: Global Lithium Carbonate Market Volume K Tons Forecast, by Country 2019 & 2032
- Table 83: United States Lithium Carbonate Market Revenue (Million) Forecast, by Application 2019 & 2032
- Table 84: United States Lithium Carbonate Market Volume (K Tons) Forecast, by Application 2019 & 2032
- Table 85: Canada Lithium Carbonate Market Revenue (Million) Forecast, by Application 2019 & 2032
- Table 86: Canada Lithium Carbonate Market Volume (K Tons) Forecast, by Application 2019 & 2032
- Table 87: Mexico Lithium Carbonate Market Revenue (Million) Forecast, by Application 2019 & 2032
- Table 88: Mexico Lithium Carbonate Market Volume (K Tons) Forecast, by Application 2019 & 2032
- Table 89: Global Lithium Carbonate Market Revenue Million Forecast, by Grade 2019 & 2032
- Table 90: Global Lithium Carbonate Market Volume K Tons Forecast, by Grade 2019 & 2032
- Table 91: Global Lithium Carbonate Market Revenue Million Forecast, by Application 2019 & 2032
- Table 92: Global Lithium Carbonate Market Volume K Tons Forecast, by Application 2019 & 2032
- Table 93: Global Lithium Carbonate Market Revenue Million Forecast, by Country 2019 & 2032
- Table 94: Global Lithium Carbonate Market Volume K Tons Forecast, by Country 2019 & 2032
- Table 95: Germany Lithium Carbonate Market Revenue (Million) Forecast, by Application 2019 & 2032
- Table 96: Germany Lithium Carbonate Market Volume (K Tons) Forecast, by Application 2019 & 2032
- Table 97: United Kingdom Lithium Carbonate Market Revenue (Million) Forecast, by Application 2019 & 2032
- Table 98: United Kingdom Lithium Carbonate Market Volume (K Tons) Forecast, by Application 2019 & 2032
- Table 99: France Lithium Carbonate Market Revenue (Million) Forecast, by Application 2019 & 2032
- Table 100: France Lithium Carbonate Market Volume (K Tons) Forecast, by Application 2019 & 2032
- Table 101: Italy Lithium Carbonate Market Revenue (Million) Forecast, by Application 2019 & 2032
- Table 102: Italy Lithium Carbonate Market Volume (K Tons) Forecast, by Application 2019 & 2032
- Table 103: Rest of Europe Lithium Carbonate Market Revenue (Million) Forecast, by Application 2019 & 2032
- Table 104: Rest of Europe Lithium Carbonate Market Volume (K Tons) Forecast, by Application 2019 & 2032
- Table 105: Global Lithium Carbonate Market Revenue Million Forecast, by Grade 2019 & 2032
- Table 106: Global Lithium Carbonate Market Volume K Tons Forecast, by Grade 2019 & 2032
- Table 107: Global Lithium Carbonate Market Revenue Million Forecast, by Application 2019 & 2032
- Table 108: Global Lithium Carbonate Market Volume K Tons Forecast, by Application 2019 & 2032
- Table 109: Global Lithium Carbonate Market Revenue Million Forecast, by Country 2019 & 2032
- Table 110: Global Lithium Carbonate Market Volume K Tons Forecast, by Country 2019 & 2032
- Table 111: Brazil Lithium Carbonate Market Revenue (Million) Forecast, by Application 2019 & 2032
- Table 112: Brazil Lithium Carbonate Market Volume (K Tons) Forecast, by Application 2019 & 2032
- Table 113: Argentina Lithium Carbonate Market Revenue (Million) Forecast, by Application 2019 & 2032
- Table 114: Argentina Lithium Carbonate Market Volume (K Tons) Forecast, by Application 2019 & 2032
- Table 115: Rest of South America Lithium Carbonate Market Revenue (Million) Forecast, by Application 2019 & 2032
- Table 116: Rest of South America Lithium Carbonate Market Volume (K Tons) Forecast, by Application 2019 & 2032
- Table 117: Global Lithium Carbonate Market Revenue Million Forecast, by Grade 2019 & 2032
- Table 118: Global Lithium Carbonate Market Volume K Tons Forecast, by Grade 2019 & 2032
- Table 119: Global Lithium Carbonate Market Revenue Million Forecast, by Application 2019 & 2032
- Table 120: Global Lithium Carbonate Market Volume K Tons Forecast, by Application 2019 & 2032
- Table 121: Global Lithium Carbonate Market Revenue Million Forecast, by Country 2019 & 2032
- Table 122: Global Lithium Carbonate Market Volume K Tons Forecast, by Country 2019 & 2032
- Table 123: Saudi Arabia Lithium Carbonate Market Revenue (Million) Forecast, by Application 2019 & 2032
- Table 124: Saudi Arabia Lithium Carbonate Market Volume (K Tons) Forecast, by Application 2019 & 2032
- Table 125: South Africa Lithium Carbonate Market Revenue (Million) Forecast, by Application 2019 & 2032
- Table 126: South Africa Lithium Carbonate Market Volume (K Tons) Forecast, by Application 2019 & 2032
- Table 127: Rest of Middle East and Africa Lithium Carbonate Market Revenue (Million) Forecast, by Application 2019 & 2032
- Table 128: Rest of Middle East and Africa Lithium Carbonate Market Volume (K Tons) Forecast, by Application 2019 & 2032
Frequently Asked Questions
1. What is the projected Compound Annual Growth Rate (CAGR) of the Lithium Carbonate Market?
The projected CAGR is approximately 3.9%.
2. Which companies are prominent players in the Lithium Carbonate Market?
Key companies in the market include SQM SA, Arcadium Lithium, Jiangxi Ganfeng Lithium Group Co Ltd, Levertonhelm Limited, Lithium Argentina Corp, Shandong Ruifu Lithium Co Ltd, Lithium Americas Corp, Albemarle Corporation, Tianqi Lithium Industry Co Ltd.
3. What are the main segments of the Lithium Carbonate Market?
The market segments include Grade, Application.
4. Can you provide details about the market size?
The market size is estimated to be USD 5,281 Million as of 2022.
5. What are some drivers contributing to market growth?
Growing Demand From Lithium-ion Batteries; Increasing Investments in the Glass and Ceramics Industry.
6. What are the notable trends driving market growth?
Li-Ion Battery Applications Expected to Drive Growth.
7. Are there any restraints impacting market growth?
Constraints in Lithium Extraction and Geographical Restriction of Lithium Mines.
8. Can you provide examples of recent developments in the market?
January 2024: Allkem and Livent completed an all-stock merger to form Arcadium Lithium. This merger is a strategic move to incorporate the existing resources and expand the production and supplier scale. Arcadium focuses on highly complementary assets and a vertically integrated business model focused on enhancing operational flexibility and predictability while lowering costs.
9. What pricing options are available for accessing the report?
Pricing options include single-user, multi-user, and enterprise licenses priced at USD 3,950, USD 4,950, and USD 6,950 respectively.
10. Is the market size provided in terms of value or volume?
The market size is provided in terms of value, measured in Million and volume, measured in K Tons.
11. Are there any specific market keywords associated with the report?
Yes, the market keyword associated with the report is "Lithium Carbonate Market," which aids in identifying and referencing the specific market segment covered.
12. How do I determine which pricing option suits my needs best?
The pricing options vary based on user requirements and access needs. Individual users may opt for single-user licenses, while businesses requiring broader access may choose multi-user or enterprise licenses for cost-effective access to the report.
13. Are there any additional resources or data provided in the Lithium Carbonate Market report?
While the report offers comprehensive insights, it's advisable to review the specific contents or supplementary materials provided to ascertain if additional resources or data are available.
14. How can I stay updated on further developments or reports in the Lithium Carbonate Market?
To stay informed about further developments, trends, and reports in the Lithium Carbonate Market, consider subscribing to industry newsletters, following relevant companies and organizations, or regularly checking reputable industry news sources and publications.
Methodology
Step 1 - Identification of Relevant Samples Size from Population Database


Step 2 - Approaches for Defining Global Market Size (Value, Volume* & Price*)

Note*: In applicable scenarios
Step 3 - Data Sources
Primary Research
- Web Analytics
- Survey Reports
- Research Institute
- Latest Research Reports
- Opinion Leaders
Secondary Research
- Annual Reports
- White Paper
- Latest Press Release
- Industry Association
- Paid Database
- Investor Presentations

Step 4 - Data Triangulation
Involves using different sources of information in order to increase the validity of a study
These sources are likely to be stakeholders in a program - participants, other researchers, program staff, other community members, and so on.
Then we put all data in single framework & apply various statistical tools to find out the dynamic on the market.
During the analysis stage, feedback from the stakeholder groups would be compared to determine areas of agreement as well as areas of divergence


