
Key Insights
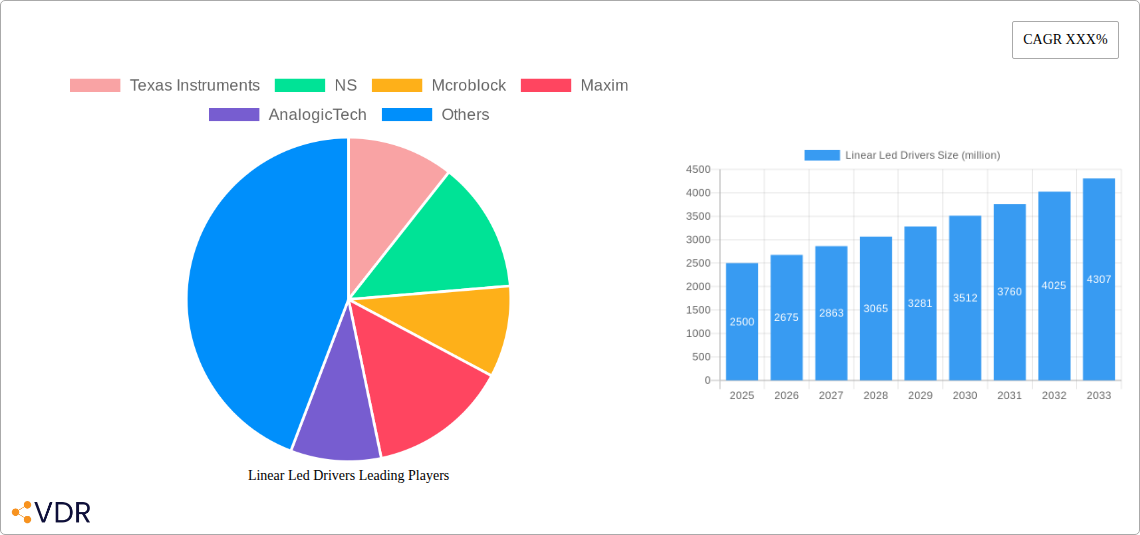
The global linear LED driver market is experiencing robust growth, driven by the increasing adoption of energy-efficient lighting solutions across various sectors. The market, estimated at $2.5 billion in 2025, is projected to exhibit a Compound Annual Growth Rate (CAGR) of 7% from 2025 to 2033, reaching approximately $4.2 billion by 2033. This expansion is fueled by several key factors, including stringent government regulations promoting energy conservation, the rising popularity of smart lighting systems, and the continuous advancements in LED technology leading to improved efficacy and longer lifespans. Key market segments include indoor and outdoor applications, with significant growth potential in commercial and industrial sectors due to large-scale lighting installations. The competitive landscape is dominated by major players like Texas Instruments, NXP, Infineon, and others, each striving to innovate and offer advanced features like dimming capabilities, high power efficiency, and improved control options.
Growth within the market is further propelled by the increasing demand for customizable lighting solutions for diverse applications, such as architectural lighting, retail displays, and smart home integrations. The adoption of advanced materials and manufacturing processes is also contributing to cost reductions and performance enhancements. However, challenges remain, such as the high initial investment costs associated with switching to LED lighting and the potential for fluctuations in raw material prices. Despite these restraints, the overall outlook for the linear LED driver market remains positive, underpinned by continuous technological advancements and the ongoing global shift towards sustainable lighting practices. The market is expected to witness increased consolidation and strategic partnerships in the coming years as companies compete to expand their market share and capture emerging opportunities.
Linear LED Drivers Market Report: 2019-2033
This comprehensive report provides an in-depth analysis of the global linear LED driver market, encompassing market dynamics, growth trends, regional performance, and key players. With a study period spanning 2019-2033, a base year of 2025, and a forecast period of 2025-2033, this report offers crucial insights for industry professionals, investors, and strategic decision-makers. The report analyzes the market in million units.
Linear LED Drivers Market Dynamics & Structure
The linear LED driver market, valued at xx million units in 2024, is characterized by moderate concentration, with key players like Texas Instruments, NS, Maxim Integrated, and Infineon holding significant market share. Technological innovation, driven by advancements in power efficiency and control technologies, is a major growth catalyst. Stringent energy efficiency regulations globally are further propelling market expansion. While some competition exists from alternative lighting technologies (e.g., OLEDs), linear LED drivers maintain a strong competitive edge due to their cost-effectiveness and versatility. The market is witnessing increased M&A activity, with approximately xx deals recorded between 2019 and 2024, primarily focused on expanding product portfolios and geographical reach.
- Market Concentration: Moderately concentrated, with top 5 players holding approximately xx% market share in 2024.
- Technological Innovation: Focus on high-power factor, dimming capabilities, and smart control features.
- Regulatory Landscape: Stringent energy efficiency standards driving adoption in developed markets.
- Competitive Substitutes: Limited direct substitutes; competition primarily from other LED driver technologies.
- End-User Demographics: Predominantly commercial and industrial applications, with growing residential penetration.
- M&A Activity: xx merger and acquisition deals between 2019 and 2024, primarily focused on expansion.
Linear Led Drivers Growth Trends & Insights
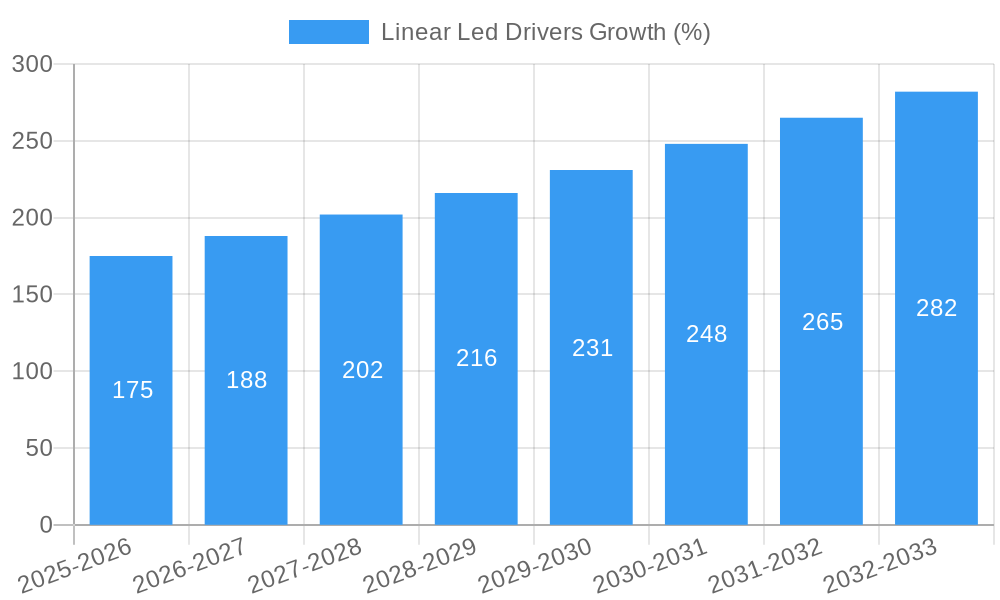
The linear LED driver market experienced a CAGR of xx% during the historical period (2019-2024), driven by increasing LED adoption across various sectors. Market penetration remains relatively high in developed economies but offers significant growth potential in emerging markets. Technological disruptions, including the introduction of smart lighting solutions and IoT-enabled drivers, are reshaping market dynamics. Consumer behavior is shifting towards energy-efficient and smart lighting options, further fueling market growth. By 2033, the market is projected to reach xx million units, exhibiting a CAGR of xx% during the forecast period (2025-2033). This growth is fueled by the expanding adoption of LED lighting across various applications, including indoor and outdoor lighting, commercial spaces, and smart home technology.
Dominant Regions, Countries, or Segments in Linear Led Drivers
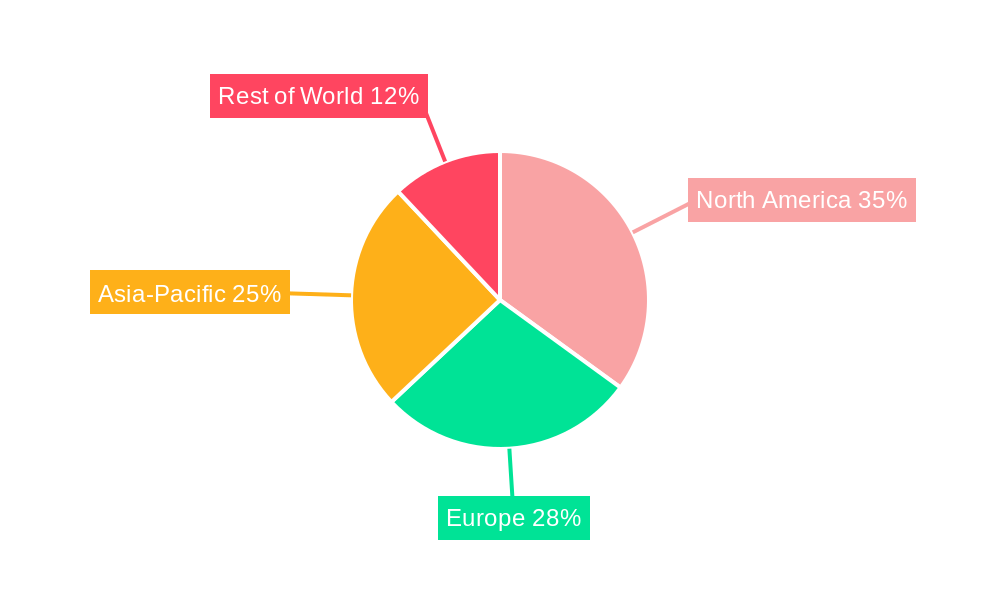
North America and Europe currently dominate the linear LED driver market, accounting for approximately xx% of global demand in 2024. This dominance stems from factors including robust infrastructure, high energy efficiency regulations, and a mature LED lighting market. However, Asia-Pacific is projected to be the fastest-growing region during the forecast period, driven by rapid infrastructure development, increasing disposable incomes, and government initiatives to promote energy efficiency. The commercial sector represents the largest segment, followed by the industrial and residential segments.
- North America: Strong regulatory environment and high adoption rates drive market growth.
- Europe: Similar to North America, high energy efficiency standards and mature LED market.
- Asia-Pacific: Fastest-growing region, fueled by infrastructure development and rising disposable incomes.
- Commercial Sector: Largest segment due to high LED adoption in office buildings, retail spaces, and hospitality.
Linear Led Drivers Product Landscape
Linear LED drivers are available in various configurations, including constant current and constant voltage types, catering to diverse applications. Recent product innovations focus on enhanced efficiency, improved dimming capabilities, and integration with smart lighting systems. Key performance metrics include power factor, efficiency, and dimming range. Unique selling propositions frequently include features such as advanced control algorithms, extended lifespan, and simplified installation.
Key Drivers, Barriers & Challenges in Linear Led Drivers
Key Drivers:
- Increasing adoption of LED lighting globally.
- Stringent energy efficiency regulations.
- Growing demand for smart lighting solutions.
- Cost reductions in LED technology.
Key Challenges:
- Intense competition from other LED driver manufacturers.
- Potential supply chain disruptions impacting raw material availability and production.
- Fluctuations in raw material prices impacting profitability.
- Regulatory compliance variations across different regions.
Emerging Opportunities in Linear Led Drivers
Emerging opportunities lie in the adoption of linear LED drivers within smart cities initiatives, the integration of advanced control systems with IoT platforms, and the expansion into new applications like horticultural lighting and automotive lighting. Untapped markets in developing economies also present significant growth potential. The development of high-power linear LED drivers for outdoor applications also opens up significant opportunities.
Growth Accelerators in the Linear Led Drivers Industry
Technological advancements, especially in power electronics and control systems, will remain crucial growth accelerators. Strategic partnerships between LED driver manufacturers and lighting companies will drive market expansion. Continued government support for energy efficiency initiatives and smart city projects will create a favorable market environment. The introduction of higher-efficacy LEDs and improved dimming control will also enhance growth.
Key Players Shaping the Linear Led Drivers Market
- Texas Instruments
- NXP
- Maxim Integrated
- Infineon
- Toshiba
- Onsemi
- AnalogicTech
- Linear Technology (Acquired by Analog Devices)
- Microchip Technology (Acquired Micrel)
- NS
Notable Milestones in Linear Led Drivers Sector
- 2020: Introduction of the first xx-watt high-efficiency linear LED driver by Texas Instruments.
- 2022: Maxim Integrated launches a new line of smart LED drivers with integrated IoT capabilities.
- 2023: Infineon announces a significant investment in expanding its linear LED driver production capacity.
- 2024: NS and Onsemi announce strategic partnership for developing next-generation LED drivers.
In-Depth Linear Led Drivers Market Outlook
The linear LED driver market is poised for continued growth, driven by the widespread adoption of LED lighting across various sectors. Strategic opportunities lie in developing innovative driver technologies for smart lighting systems, expanding into emerging markets, and fostering collaborations to drive technological advancements. The market's long-term outlook remains positive, supported by increasing government regulations promoting energy efficiency, ongoing technological innovation, and a growing global demand for LED lighting solutions.
Linear Led Drivers Segmentation
-
1. Application
- 1.1. Transportation
- 1.2. Industrial
- 1.3. Other
-
2. Type
- 2.1. A-Lamps
- 2.2. T-Lamps
- 2.3. Other
Linear Led Drivers Segmentation By Geography
-
1. North America
- 1.1. United States
- 1.2. Canada
- 1.3. Mexico
-
2. South America
- 2.1. Brazil
- 2.2. Argentina
- 2.3. Rest of South America
-
3. Europe
- 3.1. United Kingdom
- 3.2. Germany
- 3.3. France
- 3.4. Italy
- 3.5. Spain
- 3.6. Russia
- 3.7. Benelux
- 3.8. Nordics
- 3.9. Rest of Europe
-
4. Middle East & Africa
- 4.1. Turkey
- 4.2. Israel
- 4.3. GCC
- 4.4. North Africa
- 4.5. South Africa
- 4.6. Rest of Middle East & Africa
-
5. Asia Pacific
- 5.1. China
- 5.2. India
- 5.3. Japan
- 5.4. South Korea
- 5.5. ASEAN
- 5.6. Oceania
- 5.7. Rest of Asia Pacific
Linear Led Drivers REPORT HIGHLIGHTS
| Aspects | Details |
|---|---|
| Study Period | 2019-2033 |
| Base Year | 2024 |
| Estimated Year | 2025 |
| Forecast Period | 2025-2033 |
| Historical Period | 2019-2024 |
| Growth Rate | CAGR of XXX% from 2019-2033 |
| Segmentation |
|
Table of Contents
- 1. Introduction
- 1.1. Research Scope
- 1.2. Market Segmentation
- 1.3. Research Methodology
- 1.4. Definitions and Assumptions
- 2. Executive Summary
- 2.1. Introduction
- 3. Market Dynamics
- 3.1. Introduction
- 3.2. Market Drivers
- 3.3. Market Restrains
- 3.4. Market Trends
- 4. Market Factor Analysis
- 4.1. Porters Five Forces
- 4.2. Supply/Value Chain
- 4.3. PESTEL analysis
- 4.4. Market Entropy
- 4.5. Patent/Trademark Analysis
- 5. Global Linear Led Drivers Analysis, Insights and Forecast, 2019-2031
- 5.1. Market Analysis, Insights and Forecast - by Application
- 5.1.1. Transportation
- 5.1.2. Industrial
- 5.1.3. Other
- 5.2. Market Analysis, Insights and Forecast - by Type
- 5.2.1. A-Lamps
- 5.2.2. T-Lamps
- 5.2.3. Other
- 5.3. Market Analysis, Insights and Forecast - by Region
- 5.3.1. North America
- 5.3.2. South America
- 5.3.3. Europe
- 5.3.4. Middle East & Africa
- 5.3.5. Asia Pacific
- 5.1. Market Analysis, Insights and Forecast - by Application
- 6. North America Linear Led Drivers Analysis, Insights and Forecast, 2019-2031
- 6.1. Market Analysis, Insights and Forecast - by Application
- 6.1.1. Transportation
- 6.1.2. Industrial
- 6.1.3. Other
- 6.2. Market Analysis, Insights and Forecast - by Type
- 6.2.1. A-Lamps
- 6.2.2. T-Lamps
- 6.2.3. Other
- 6.1. Market Analysis, Insights and Forecast - by Application
- 7. South America Linear Led Drivers Analysis, Insights and Forecast, 2019-2031
- 7.1. Market Analysis, Insights and Forecast - by Application
- 7.1.1. Transportation
- 7.1.2. Industrial
- 7.1.3. Other
- 7.2. Market Analysis, Insights and Forecast - by Type
- 7.2.1. A-Lamps
- 7.2.2. T-Lamps
- 7.2.3. Other
- 7.1. Market Analysis, Insights and Forecast - by Application
- 8. Europe Linear Led Drivers Analysis, Insights and Forecast, 2019-2031
- 8.1. Market Analysis, Insights and Forecast - by Application
- 8.1.1. Transportation
- 8.1.2. Industrial
- 8.1.3. Other
- 8.2. Market Analysis, Insights and Forecast - by Type
- 8.2.1. A-Lamps
- 8.2.2. T-Lamps
- 8.2.3. Other
- 8.1. Market Analysis, Insights and Forecast - by Application
- 9. Middle East & Africa Linear Led Drivers Analysis, Insights and Forecast, 2019-2031
- 9.1. Market Analysis, Insights and Forecast - by Application
- 9.1.1. Transportation
- 9.1.2. Industrial
- 9.1.3. Other
- 9.2. Market Analysis, Insights and Forecast - by Type
- 9.2.1. A-Lamps
- 9.2.2. T-Lamps
- 9.2.3. Other
- 9.1. Market Analysis, Insights and Forecast - by Application
- 10. Asia Pacific Linear Led Drivers Analysis, Insights and Forecast, 2019-2031
- 10.1. Market Analysis, Insights and Forecast - by Application
- 10.1.1. Transportation
- 10.1.2. Industrial
- 10.1.3. Other
- 10.2. Market Analysis, Insights and Forecast - by Type
- 10.2.1. A-Lamps
- 10.2.2. T-Lamps
- 10.2.3. Other
- 10.1. Market Analysis, Insights and Forecast - by Application
- 11. Competitive Analysis
- 11.1. Global Market Share Analysis 2024
- 11.2. Company Profiles
- 11.2.1 Texas Instruments
- 11.2.1.1. Overview
- 11.2.1.2. Products
- 11.2.1.3. SWOT Analysis
- 11.2.1.4. Recent Developments
- 11.2.1.5. Financials (Based on Availability)
- 11.2.2 NS
- 11.2.2.1. Overview
- 11.2.2.2. Products
- 11.2.2.3. SWOT Analysis
- 11.2.2.4. Recent Developments
- 11.2.2.5. Financials (Based on Availability)
- 11.2.3 Mcroblock
- 11.2.3.1. Overview
- 11.2.3.2. Products
- 11.2.3.3. SWOT Analysis
- 11.2.3.4. Recent Developments
- 11.2.3.5. Financials (Based on Availability)
- 11.2.4 Maxim
- 11.2.4.1. Overview
- 11.2.4.2. Products
- 11.2.4.3. SWOT Analysis
- 11.2.4.4. Recent Developments
- 11.2.4.5. Financials (Based on Availability)
- 11.2.5 AnalogicTech
- 11.2.5.1. Overview
- 11.2.5.2. Products
- 11.2.5.3. SWOT Analysis
- 11.2.5.4. Recent Developments
- 11.2.5.5. Financials (Based on Availability)
- 11.2.6 Linear
- 11.2.6.1. Overview
- 11.2.6.2. Products
- 11.2.6.3. SWOT Analysis
- 11.2.6.4. Recent Developments
- 11.2.6.5. Financials (Based on Availability)
- 11.2.7 NXP
- 11.2.7.1. Overview
- 11.2.7.2. Products
- 11.2.7.3. SWOT Analysis
- 11.2.7.4. Recent Developments
- 11.2.7.5. Financials (Based on Availability)
- 11.2.8 Infineon
- 11.2.8.1. Overview
- 11.2.8.2. Products
- 11.2.8.3. SWOT Analysis
- 11.2.8.4. Recent Developments
- 11.2.8.5. Financials (Based on Availability)
- 11.2.9 Toshiba
- 11.2.9.1. Overview
- 11.2.9.2. Products
- 11.2.9.3. SWOT Analysis
- 11.2.9.4. Recent Developments
- 11.2.9.5. Financials (Based on Availability)
- 11.2.10 Onsemi
- 11.2.10.1. Overview
- 11.2.10.2. Products
- 11.2.10.3. SWOT Analysis
- 11.2.10.4. Recent Developments
- 11.2.10.5. Financials (Based on Availability)
- 11.2.1 Texas Instruments
List of Figures
- Figure 1: Global Linear Led Drivers Revenue Breakdown (million, %) by Region 2024 & 2032
- Figure 2: North America Linear Led Drivers Revenue (million), by Application 2024 & 2032
- Figure 3: North America Linear Led Drivers Revenue Share (%), by Application 2024 & 2032
- Figure 4: North America Linear Led Drivers Revenue (million), by Type 2024 & 2032
- Figure 5: North America Linear Led Drivers Revenue Share (%), by Type 2024 & 2032
- Figure 6: North America Linear Led Drivers Revenue (million), by Country 2024 & 2032
- Figure 7: North America Linear Led Drivers Revenue Share (%), by Country 2024 & 2032
- Figure 8: South America Linear Led Drivers Revenue (million), by Application 2024 & 2032
- Figure 9: South America Linear Led Drivers Revenue Share (%), by Application 2024 & 2032
- Figure 10: South America Linear Led Drivers Revenue (million), by Type 2024 & 2032
- Figure 11: South America Linear Led Drivers Revenue Share (%), by Type 2024 & 2032
- Figure 12: South America Linear Led Drivers Revenue (million), by Country 2024 & 2032
- Figure 13: South America Linear Led Drivers Revenue Share (%), by Country 2024 & 2032
- Figure 14: Europe Linear Led Drivers Revenue (million), by Application 2024 & 2032
- Figure 15: Europe Linear Led Drivers Revenue Share (%), by Application 2024 & 2032
- Figure 16: Europe Linear Led Drivers Revenue (million), by Type 2024 & 2032
- Figure 17: Europe Linear Led Drivers Revenue Share (%), by Type 2024 & 2032
- Figure 18: Europe Linear Led Drivers Revenue (million), by Country 2024 & 2032
- Figure 19: Europe Linear Led Drivers Revenue Share (%), by Country 2024 & 2032
- Figure 20: Middle East & Africa Linear Led Drivers Revenue (million), by Application 2024 & 2032
- Figure 21: Middle East & Africa Linear Led Drivers Revenue Share (%), by Application 2024 & 2032
- Figure 22: Middle East & Africa Linear Led Drivers Revenue (million), by Type 2024 & 2032
- Figure 23: Middle East & Africa Linear Led Drivers Revenue Share (%), by Type 2024 & 2032
- Figure 24: Middle East & Africa Linear Led Drivers Revenue (million), by Country 2024 & 2032
- Figure 25: Middle East & Africa Linear Led Drivers Revenue Share (%), by Country 2024 & 2032
- Figure 26: Asia Pacific Linear Led Drivers Revenue (million), by Application 2024 & 2032
- Figure 27: Asia Pacific Linear Led Drivers Revenue Share (%), by Application 2024 & 2032
- Figure 28: Asia Pacific Linear Led Drivers Revenue (million), by Type 2024 & 2032
- Figure 29: Asia Pacific Linear Led Drivers Revenue Share (%), by Type 2024 & 2032
- Figure 30: Asia Pacific Linear Led Drivers Revenue (million), by Country 2024 & 2032
- Figure 31: Asia Pacific Linear Led Drivers Revenue Share (%), by Country 2024 & 2032
List of Tables
- Table 1: Global Linear Led Drivers Revenue million Forecast, by Region 2019 & 2032
- Table 2: Global Linear Led Drivers Revenue million Forecast, by Application 2019 & 2032
- Table 3: Global Linear Led Drivers Revenue million Forecast, by Type 2019 & 2032
- Table 4: Global Linear Led Drivers Revenue million Forecast, by Region 2019 & 2032
- Table 5: Global Linear Led Drivers Revenue million Forecast, by Application 2019 & 2032
- Table 6: Global Linear Led Drivers Revenue million Forecast, by Type 2019 & 2032
- Table 7: Global Linear Led Drivers Revenue million Forecast, by Country 2019 & 2032
- Table 8: United States Linear Led Drivers Revenue (million) Forecast, by Application 2019 & 2032
- Table 9: Canada Linear Led Drivers Revenue (million) Forecast, by Application 2019 & 2032
- Table 10: Mexico Linear Led Drivers Revenue (million) Forecast, by Application 2019 & 2032
- Table 11: Global Linear Led Drivers Revenue million Forecast, by Application 2019 & 2032
- Table 12: Global Linear Led Drivers Revenue million Forecast, by Type 2019 & 2032
- Table 13: Global Linear Led Drivers Revenue million Forecast, by Country 2019 & 2032
- Table 14: Brazil Linear Led Drivers Revenue (million) Forecast, by Application 2019 & 2032
- Table 15: Argentina Linear Led Drivers Revenue (million) Forecast, by Application 2019 & 2032
- Table 16: Rest of South America Linear Led Drivers Revenue (million) Forecast, by Application 2019 & 2032
- Table 17: Global Linear Led Drivers Revenue million Forecast, by Application 2019 & 2032
- Table 18: Global Linear Led Drivers Revenue million Forecast, by Type 2019 & 2032
- Table 19: Global Linear Led Drivers Revenue million Forecast, by Country 2019 & 2032
- Table 20: United Kingdom Linear Led Drivers Revenue (million) Forecast, by Application 2019 & 2032
- Table 21: Germany Linear Led Drivers Revenue (million) Forecast, by Application 2019 & 2032
- Table 22: France Linear Led Drivers Revenue (million) Forecast, by Application 2019 & 2032
- Table 23: Italy Linear Led Drivers Revenue (million) Forecast, by Application 2019 & 2032
- Table 24: Spain Linear Led Drivers Revenue (million) Forecast, by Application 2019 & 2032
- Table 25: Russia Linear Led Drivers Revenue (million) Forecast, by Application 2019 & 2032
- Table 26: Benelux Linear Led Drivers Revenue (million) Forecast, by Application 2019 & 2032
- Table 27: Nordics Linear Led Drivers Revenue (million) Forecast, by Application 2019 & 2032
- Table 28: Rest of Europe Linear Led Drivers Revenue (million) Forecast, by Application 2019 & 2032
- Table 29: Global Linear Led Drivers Revenue million Forecast, by Application 2019 & 2032
- Table 30: Global Linear Led Drivers Revenue million Forecast, by Type 2019 & 2032
- Table 31: Global Linear Led Drivers Revenue million Forecast, by Country 2019 & 2032
- Table 32: Turkey Linear Led Drivers Revenue (million) Forecast, by Application 2019 & 2032
- Table 33: Israel Linear Led Drivers Revenue (million) Forecast, by Application 2019 & 2032
- Table 34: GCC Linear Led Drivers Revenue (million) Forecast, by Application 2019 & 2032
- Table 35: North Africa Linear Led Drivers Revenue (million) Forecast, by Application 2019 & 2032
- Table 36: South Africa Linear Led Drivers Revenue (million) Forecast, by Application 2019 & 2032
- Table 37: Rest of Middle East & Africa Linear Led Drivers Revenue (million) Forecast, by Application 2019 & 2032
- Table 38: Global Linear Led Drivers Revenue million Forecast, by Application 2019 & 2032
- Table 39: Global Linear Led Drivers Revenue million Forecast, by Type 2019 & 2032
- Table 40: Global Linear Led Drivers Revenue million Forecast, by Country 2019 & 2032
- Table 41: China Linear Led Drivers Revenue (million) Forecast, by Application 2019 & 2032
- Table 42: India Linear Led Drivers Revenue (million) Forecast, by Application 2019 & 2032
- Table 43: Japan Linear Led Drivers Revenue (million) Forecast, by Application 2019 & 2032
- Table 44: South Korea Linear Led Drivers Revenue (million) Forecast, by Application 2019 & 2032
- Table 45: ASEAN Linear Led Drivers Revenue (million) Forecast, by Application 2019 & 2032
- Table 46: Oceania Linear Led Drivers Revenue (million) Forecast, by Application 2019 & 2032
- Table 47: Rest of Asia Pacific Linear Led Drivers Revenue (million) Forecast, by Application 2019 & 2032
Frequently Asked Questions
1. What is the projected Compound Annual Growth Rate (CAGR) of the Linear Led Drivers?
The projected CAGR is approximately XXX%.
2. Which companies are prominent players in the Linear Led Drivers?
Key companies in the market include Texas Instruments, NS, Mcroblock, Maxim, AnalogicTech, Linear, NXP, Infineon, Toshiba, Onsemi.
3. What are the main segments of the Linear Led Drivers?
The market segments include Application, Type.
4. Can you provide details about the market size?
The market size is estimated to be USD XXX million as of 2022.
5. What are some drivers contributing to market growth?
N/A
6. What are the notable trends driving market growth?
N/A
7. Are there any restraints impacting market growth?
N/A
8. Can you provide examples of recent developments in the market?
N/A
9. What pricing options are available for accessing the report?
Pricing options include single-user, multi-user, and enterprise licenses priced at USD 2900.00, USD 4350.00, and USD 5800.00 respectively.
10. Is the market size provided in terms of value or volume?
The market size is provided in terms of value, measured in million.
11. Are there any specific market keywords associated with the report?
Yes, the market keyword associated with the report is "Linear Led Drivers," which aids in identifying and referencing the specific market segment covered.
12. How do I determine which pricing option suits my needs best?
The pricing options vary based on user requirements and access needs. Individual users may opt for single-user licenses, while businesses requiring broader access may choose multi-user or enterprise licenses for cost-effective access to the report.
13. Are there any additional resources or data provided in the Linear Led Drivers report?
While the report offers comprehensive insights, it's advisable to review the specific contents or supplementary materials provided to ascertain if additional resources or data are available.
14. How can I stay updated on further developments or reports in the Linear Led Drivers?
To stay informed about further developments, trends, and reports in the Linear Led Drivers, consider subscribing to industry newsletters, following relevant companies and organizations, or regularly checking reputable industry news sources and publications.
Methodology
Step 1 - Identification of Relevant Samples Size from Population Database


Step 2 - Approaches for Defining Global Market Size (Value, Volume* & Price*)

Note*: In applicable scenarios
Step 3 - Data Sources
Primary Research
- Web Analytics
- Survey Reports
- Research Institute
- Latest Research Reports
- Opinion Leaders
Secondary Research
- Annual Reports
- White Paper
- Latest Press Release
- Industry Association
- Paid Database
- Investor Presentations

Step 4 - Data Triangulation
Involves using different sources of information in order to increase the validity of a study
These sources are likely to be stakeholders in a program - participants, other researchers, program staff, other community members, and so on.
Then we put all data in single framework & apply various statistical tools to find out the dynamic on the market.
During the analysis stage, feedback from the stakeholder groups would be compared to determine areas of agreement as well as areas of divergence


