Future-Forward Strategies for Legionella Testing Industry Industry

Legionella Testing Industry by Production Analysis, by Consumption Analysis, by Import Market Analysis (Value & Volume), by Export Market Analysis (Value & Volume), by Price Trend Analysis, by North America (United States, Canada, Mexico), by Europe (Germany, United Kingdom, France, Italy, Spain, Rest of Europe), by Asia Pacific (China, Japan, India, Australia, South Korea, Rest of Asia Pacific), by Middle East and Africa (GCC, South Africa, Rest of Middle East and Africa), by South America (Brazil, Argentina, Rest of South America) Forecast 2025-2033

Jun 30 2025
Base Year: 2024

234 Pages
Main Logo

Future-Forward Strategies for Legionella Testing Industry Industry


Home
Industries
Healthcare
sponsor image
sponsor image
sponsor image
sponsor image
sponsor image
sponsor image
sponsor image

Tailored for you

  • In-depth Analysis Tailored to Specified Regions or Segments
  • Company Profiles Customized to User Preferences
  • Comprehensive Insights Focused on Specific Segments or Regions
  • Customized Evaluation of Competitive Landscape to Meet Your Needs
  • Tailored Customization to Address Other Specific Requirements
Ask for customization


Key Insights

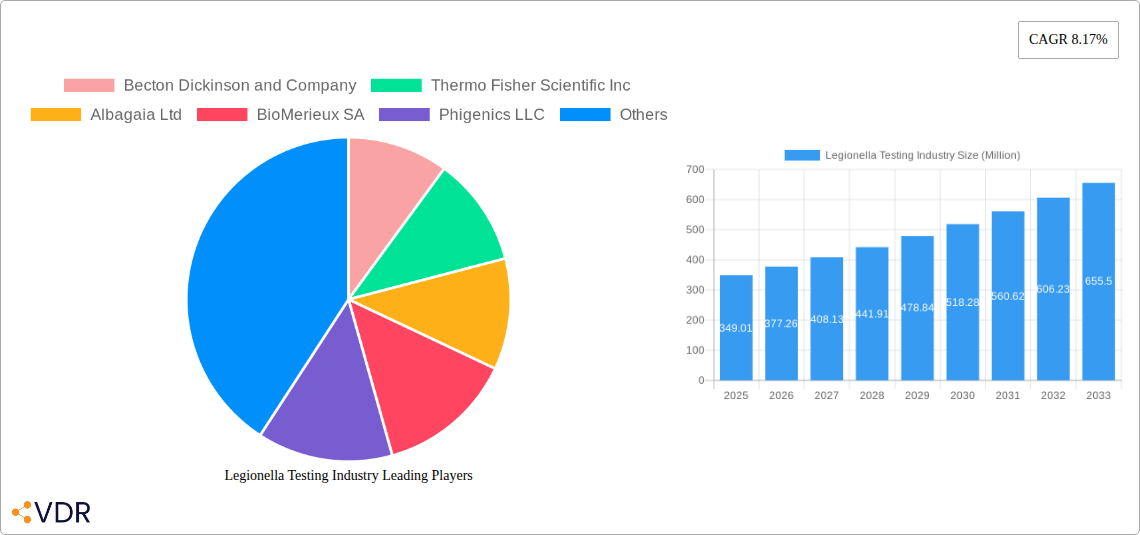
The Legionella testing market, valued at $349.01 million in 2025, is projected to experience robust growth, driven by increasing awareness of Legionnaires' disease, stringent regulations regarding water safety, and the rising prevalence of healthcare-associated infections. The market's Compound Annual Growth Rate (CAGR) of 8.17% from 2019 to 2025 indicates a consistent upward trajectory, expected to continue through 2033. Key growth drivers include the expansion of healthcare infrastructure, particularly in developing economies, and the adoption of advanced testing technologies like PCR, offering faster and more accurate results compared to traditional methods like culture methods and direct fluorescent antibody (DFA) tests. The increasing prevalence of Legionella in various water sources, including hospitals, hotels, and industrial facilities, further fuels demand for reliable and sensitive testing solutions. Market segmentation reveals significant demand across diverse applications, including clinical and environmental testing in hospitals, clinics, and diagnostic laboratories. Leading players such as Becton Dickinson, Thermo Fisher Scientific, and BioMerieux are driving innovation and expanding their product portfolios to cater to evolving market needs.

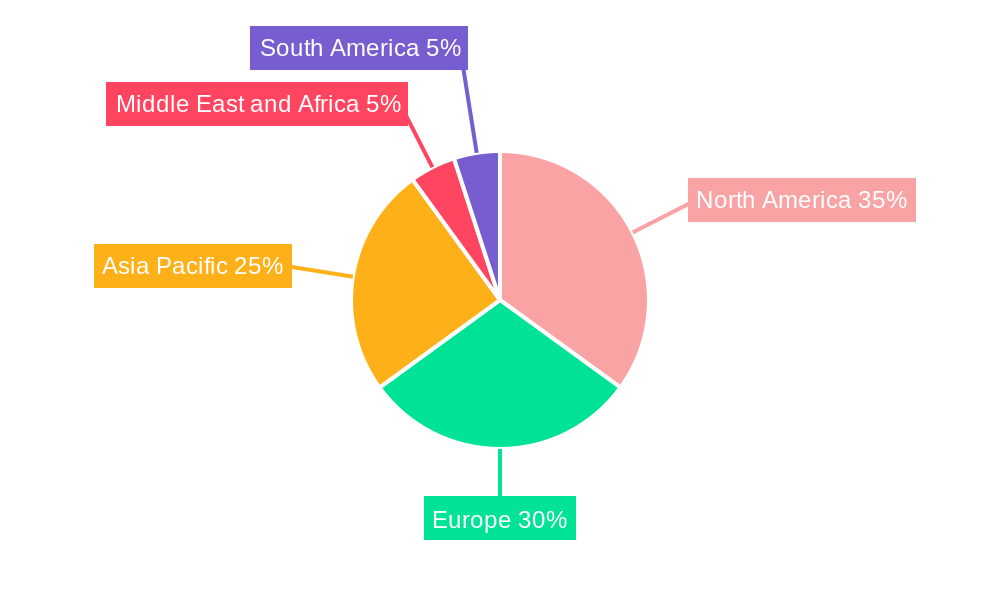
The market's growth, however, faces certain restraints. The high cost associated with advanced testing technologies like PCR, particularly in resource-constrained settings, could limit wider adoption. Furthermore, the need for skilled personnel to operate sophisticated equipment presents a challenge. Despite these challenges, the continued emphasis on public health and safety regulations, coupled with technological advancements leading to more accessible and affordable testing options, is expected to offset these limitations and sustain the overall market expansion. The Asia-Pacific region is anticipated to witness significant growth, fueled by rapid urbanization and increasing investments in healthcare infrastructure. Europe and North America will maintain substantial market shares due to established healthcare systems and stringent regulations. The forecast period (2025-2033) promises a significant expansion in the Legionella testing market, driven by technological innovation and a rising global focus on water safety and public health.

Legionella Testing Industry Research Report - Market Size, Growth & Forecast

Legionella Testing Industry Market Report: 2019-2033

This comprehensive report provides an in-depth analysis of the Legionella testing market, encompassing market dynamics, growth trends, regional dominance, product landscape, key players, and future outlook. The study period spans 2019-2033, with 2025 as the base and estimated year. The market is segmented by test type (Culture Method, Urinary Antigen Test (UAT), Direct Fluorescent Antibody (DFA) Test, Polymerase Chain Reaction (PCR), Other Test Types) and application (Clinical Testing Method, Environmental Testing Method, Hospital and Clinic, Diagnostic Laboratory). The report analyzes key players including Becton Dickinson and Company, Thermo Fisher Scientific Inc, Albagaia Ltd, BioMerieux SA, Phigenics LLC, Evoqua Water Technologies (Pacific Water Technology), Aquacert Ltd, Merck KgaA, Qiagen NV, and Danaher Corporation (Pall Corporation). The total market size in 2025 is estimated at XX Million.

Legionella Testing Industry Market Dynamics & Structure

The Legionella testing market is characterized by moderate concentration, with a few major players holding significant market share. Technological innovation, particularly in PCR-based testing and rapid diagnostic methods, is a key driver. Stringent regulatory frameworks, particularly concerning water safety and public health, influence market growth. Competitive substitutes include traditional microbiological culture methods, but rapid diagnostic tests are gaining traction due to their speed and efficiency. End-users include hospitals, clinics, diagnostic laboratories, and environmental testing agencies. M&A activity has been moderate, with strategic acquisitions aimed at expanding product portfolios and geographic reach. The market is expected to witness a steady growth due to rising awareness about Legionnaires’ disease and increasing demand for rapid and accurate diagnostic tools.

  • Market Concentration: Moderately concentrated, with top 5 players holding approximately XX% market share in 2025.
  • Technological Innovation: PCR-based tests are driving growth, alongside automation and point-of-care diagnostics.
  • Regulatory Landscape: Stringent regulations on water quality and infection control are crucial market drivers.
  • Competitive Substitutes: Traditional culture methods face competition from faster, more efficient techniques.
  • M&A Activity: XX major M&A deals recorded between 2019-2024, primarily focused on expanding product portfolios.
  • Innovation Barriers: High R&D costs, regulatory approval processes, and market access challenges.

Legionella Testing Industry Growth Trends & Insights

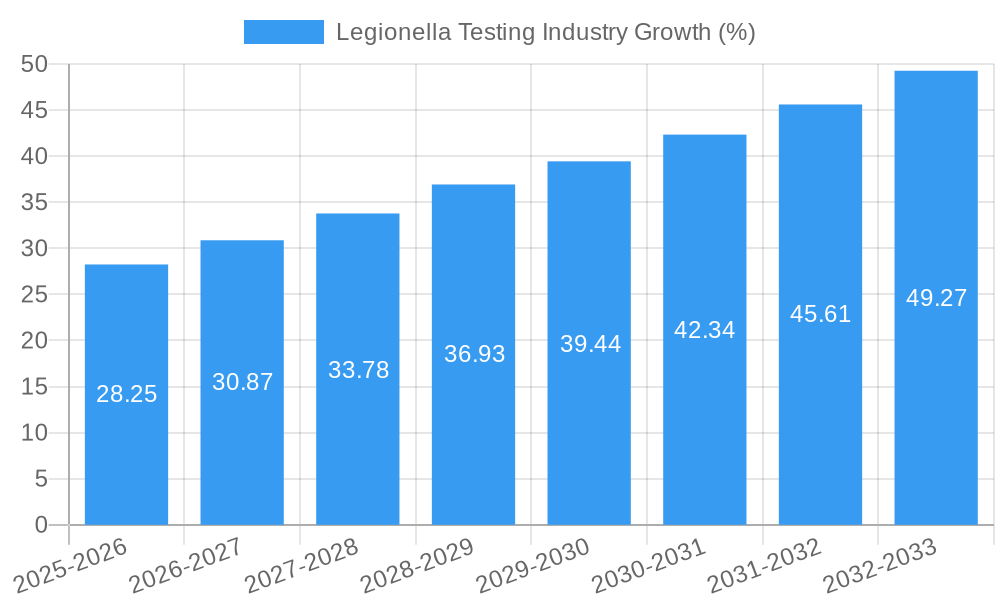
The Legionella testing market exhibited a CAGR of XX% during the historical period (2019-2024), reaching XX Million in 2024. This growth is attributed to factors such as the increasing prevalence of Legionnaires' disease, rising awareness among healthcare professionals and the public, and technological advancements in diagnostic testing. Market penetration of rapid diagnostic tests is increasing, driven by their speed and efficiency. Consumer behavior shifts toward greater demand for rapid results and improved diagnostic accuracy. We project continued robust growth with a CAGR of XX% from 2025 to 2033, reaching XX Million by 2033. Technological disruptions, like the introduction of portable and automated testing systems, will continue to fuel market expansion. This growth will also be boosted by an increased focus on preventative measures and improved water management practices in buildings.

Legionella Testing Industry Growth

Dominant Regions, Countries, or Segments in Legionella Testing Industry

North America currently holds the largest market share, driven by high healthcare expenditure, advanced healthcare infrastructure, and stringent regulations. Europe follows closely, with significant growth potential in emerging economies. Within the segments, PCR-based tests are showing the highest growth rate due to their high sensitivity and specificity, followed by rapid antigen tests owing to their speed and ease of use. The clinical testing method segment holds a larger market share compared to environmental testing, primarily driven by the high prevalence of Legionnaires' disease in hospitals and healthcare facilities.

  • Key Drivers (North America): High healthcare expenditure, advanced infrastructure, stringent regulations.
  • Key Drivers (Europe): Rising prevalence of Legionnaires’ disease, focus on preventative healthcare.
  • Segment Dominance: PCR tests and Clinical Testing Methods hold the largest shares.
  • Growth Potential: Emerging economies in Asia and Latin America offer significant growth opportunities.

Legionella Testing Industry Product Landscape

The Legionella testing product landscape is characterized by a wide range of testing methods, including culture-based methods, rapid antigen tests, DFA tests, and PCR-based tests. Recent innovations focus on improving the speed, accuracy, and ease of use of these tests, including the development of portable and automated systems. Unique selling propositions include faster turnaround times, increased sensitivity and specificity, and reduced costs. Technological advancements are driving a shift towards more sophisticated and user-friendly testing solutions.

Key Drivers, Barriers & Challenges in Legionella Testing Industry

Key Drivers:

  • Increasing prevalence of Legionnaires' disease.
  • Growing awareness and stringent regulations.
  • Technological advancements leading to faster and more accurate tests.
  • Rising healthcare expenditure.

Challenges & Restraints:

  • High cost of advanced testing technologies, potentially limiting access in certain regions.
  • Complex regulatory approval processes for new testing methods.
  • Intense competition among existing players.
  • Potential supply chain disruptions impacting the availability of testing supplies.

Emerging Opportunities in Legionella Testing Industry

  • Development of point-of-care testing devices for rapid diagnosis.
  • Expansion into untapped markets in developing countries.
  • Integration of advanced technologies, such as AI and machine learning, for improved data analysis and disease surveillance.
  • Focus on preventative measures, such as water management systems, to reduce the risk of Legionella contamination.

Growth Accelerators in the Legionella Testing Industry

Strategic partnerships between testing companies and healthcare providers are accelerating market growth by improving market access and streamlining testing procedures. Technological breakthroughs, particularly in rapid diagnostics, are boosting efficiency and reducing costs. Expanding into new geographical markets and offering customized testing solutions to meet specific needs are also key growth accelerators.

Key Players Shaping the Legionella Testing Industry Market

  • Becton Dickinson and Company
  • Thermo Fisher Scientific Inc
  • Albagaia Ltd
  • BioMerieux SA
  • Phigenics LLC
  • Evoqua Water Technologies (Pacific Water Technology)
  • Aquacert Ltd
  • Merck KgaA
  • Qiagen NV
  • Danaher Corporation (Pall Corporation)

Notable Milestones in Legionella Testing Industry Sector

  • May 2022: ChemREADY launches new Legionella testing services and products.
  • March 2022: IDEXX's Legiolert test published as ASTM standard D8429-21.

In-Depth Legionella Testing Industry Market Outlook

The Legionella testing market is poised for continued growth, driven by technological advancements, increasing disease prevalence, and a stronger focus on preventative measures. Strategic partnerships, market expansion into emerging economies, and the development of innovative testing solutions will further accelerate market expansion, creating significant opportunities for key players in the coming years. The market's future hinges on the continued adoption of rapid diagnostics, the development of point-of-care testing, and greater integration of data analytics for disease surveillance and prevention.

Legionella Testing Industry Segmentation

  • 1. Production Analysis
  • 2. Consumption Analysis
  • 3. Import Market Analysis (Value & Volume)
  • 4. Export Market Analysis (Value & Volume)
  • 5. Price Trend Analysis

Legionella Testing Industry Segmentation By Geography

  • 1. North America
    • 1.1. United States
    • 1.2. Canada
    • 1.3. Mexico
  • 2. Europe
    • 2.1. Germany
    • 2.2. United Kingdom
    • 2.3. France
    • 2.4. Italy
    • 2.5. Spain
    • 2.6. Rest of Europe
  • 3. Asia Pacific
    • 3.1. China
    • 3.2. Japan
    • 3.3. India
    • 3.4. Australia
    • 3.5. South Korea
    • 3.6. Rest of Asia Pacific
  • 4. Middle East and Africa
    • 4.1. GCC
    • 4.2. South Africa
    • 4.3. Rest of Middle East and Africa
  • 5. South America
    • 5.1. Brazil
    • 5.2. Argentina
    • 5.3. Rest of South America
Legionella Testing Industry Regional Share


Legionella Testing Industry REPORT HIGHLIGHTS

AspectsDetails
Study Period 2019-2033
Base Year 2024
Estimated Year 2025
Forecast Period2025-2033
Historical Period2019-2024
Growth RateCAGR of 8.17% from 2019-2033
Segmentation
    • By Production Analysis
    • By Consumption Analysis
    • By Import Market Analysis (Value & Volume)
    • By Export Market Analysis (Value & Volume)
    • By Price Trend Analysis
  • By Geography
    • North America
      • United States
      • Canada
      • Mexico
    • Europe
      • Germany
      • United Kingdom
      • France
      • Italy
      • Spain
      • Rest of Europe
    • Asia Pacific
      • China
      • Japan
      • India
      • Australia
      • South Korea
      • Rest of Asia Pacific
    • Middle East and Africa
      • GCC
      • South Africa
      • Rest of Middle East and Africa
    • South America
      • Brazil
      • Argentina
      • Rest of South America


Table of Contents

  1. 1. Introduction
    • 1.1. Research Scope
    • 1.2. Market Segmentation
    • 1.3. Research Methodology
    • 1.4. Definitions and Assumptions
  2. 2. Executive Summary
    • 2.1. Introduction
  3. 3. Market Dynamics
    • 3.1. Introduction
      • 3.2. Market Drivers
        • 3.2.1. Rising Incidence of Pneumonia and Legionella-related Illnesses; Increasing Demand for Rapid and Advanced Diagnostic Techniques; Technological Advancements in the Field of Bacterial Testing
      • 3.3. Market Restrains
        • 3.3.1. Issues in Sensitivity of Diagnostic Tests
      • 3.4. Market Trends
        • 3.4.1. Urinary Antigen Test (UAT) Segment is Expected to Hold a Major Market Share in the Legionella Testing Market
  4. 4. Market Factor Analysis
    • 4.1. Porters Five Forces
    • 4.2. Supply/Value Chain
    • 4.3. PESTEL analysis
    • 4.4. Market Entropy
    • 4.5. Patent/Trademark Analysis
  5. 5. Global Legionella Testing Industry Analysis, Insights and Forecast, 2019-2031
    • 5.1. Market Analysis, Insights and Forecast - by Production Analysis
      • 5.2. Market Analysis, Insights and Forecast - by Consumption Analysis
        • 5.3. Market Analysis, Insights and Forecast - by Import Market Analysis (Value & Volume)
          • 5.4. Market Analysis, Insights and Forecast - by Export Market Analysis (Value & Volume)
            • 5.5. Market Analysis, Insights and Forecast - by Price Trend Analysis
              • 5.6. Market Analysis, Insights and Forecast - by Region
                • 5.6.1. North America
                • 5.6.2. Europe
                • 5.6.3. Asia Pacific
                • 5.6.4. Middle East and Africa
                • 5.6.5. South America
            • 6. North America Legionella Testing Industry Analysis, Insights and Forecast, 2019-2031
              • 6.1. Market Analysis, Insights and Forecast - by Production Analysis
                • 6.2. Market Analysis, Insights and Forecast - by Consumption Analysis
                  • 6.3. Market Analysis, Insights and Forecast - by Import Market Analysis (Value & Volume)
                    • 6.4. Market Analysis, Insights and Forecast - by Export Market Analysis (Value & Volume)
                      • 6.5. Market Analysis, Insights and Forecast - by Price Trend Analysis
                      • 7. Europe Legionella Testing Industry Analysis, Insights and Forecast, 2019-2031
                        • 7.1. Market Analysis, Insights and Forecast - by Production Analysis
                          • 7.2. Market Analysis, Insights and Forecast - by Consumption Analysis
                            • 7.3. Market Analysis, Insights and Forecast - by Import Market Analysis (Value & Volume)
                              • 7.4. Market Analysis, Insights and Forecast - by Export Market Analysis (Value & Volume)
                                • 7.5. Market Analysis, Insights and Forecast - by Price Trend Analysis
                                • 8. Asia Pacific Legionella Testing Industry Analysis, Insights and Forecast, 2019-2031
                                  • 8.1. Market Analysis, Insights and Forecast - by Production Analysis
                                    • 8.2. Market Analysis, Insights and Forecast - by Consumption Analysis
                                      • 8.3. Market Analysis, Insights and Forecast - by Import Market Analysis (Value & Volume)
                                        • 8.4. Market Analysis, Insights and Forecast - by Export Market Analysis (Value & Volume)
                                          • 8.5. Market Analysis, Insights and Forecast - by Price Trend Analysis
                                          • 9. Middle East and Africa Legionella Testing Industry Analysis, Insights and Forecast, 2019-2031
                                            • 9.1. Market Analysis, Insights and Forecast - by Production Analysis
                                              • 9.2. Market Analysis, Insights and Forecast - by Consumption Analysis
                                                • 9.3. Market Analysis, Insights and Forecast - by Import Market Analysis (Value & Volume)
                                                  • 9.4. Market Analysis, Insights and Forecast - by Export Market Analysis (Value & Volume)
                                                    • 9.5. Market Analysis, Insights and Forecast - by Price Trend Analysis
                                                    • 10. South America Legionella Testing Industry Analysis, Insights and Forecast, 2019-2031
                                                      • 10.1. Market Analysis, Insights and Forecast - by Production Analysis
                                                        • 10.2. Market Analysis, Insights and Forecast - by Consumption Analysis
                                                          • 10.3. Market Analysis, Insights and Forecast - by Import Market Analysis (Value & Volume)
                                                            • 10.4. Market Analysis, Insights and Forecast - by Export Market Analysis (Value & Volume)
                                                              • 10.5. Market Analysis, Insights and Forecast - by Price Trend Analysis
                                                              • 11. North Americ Legionella Testing Industry Analysis, Insights and Forecast, 2019-2031
                                                                  • 11.1. Market Analysis, Insights and Forecast - By Country/Sub-region
                                                                    • 11.1.1. undefined
                                                              • 12. Europe Legionella Testing Industry Analysis, Insights and Forecast, 2019-2031
                                                                  • 12.1. Market Analysis, Insights and Forecast - By Country/Sub-region
                                                                    • 12.1.1. undefined
                                                              • 13. Asia Pacific Legionella Testing Industry Analysis, Insights and Forecast, 2019-2031
                                                                  • 13.1. Market Analysis, Insights and Forecast - By Country/Sub-region
                                                                    • 13.1.1. undefined
                                                              • 14. Middle East and Africa Legionella Testing Industry Analysis, Insights and Forecast, 2019-2031
                                                                  • 14.1. Market Analysis, Insights and Forecast - By Country/Sub-region
                                                                    • 14.1.1. undefined
                                                              • 15. South America Legionella Testing Industry Analysis, Insights and Forecast, 2019-2031
                                                                  • 15.1. Market Analysis, Insights and Forecast - By Country/Sub-region
                                                                    • 15.1.1. undefined
                                                              • 16. Competitive Analysis
                                                                • 16.1. Global Market Share Analysis 2024
                                                                  • 16.2. Company Profiles
                                                                    • 16.2.1 Becton Dickinson and Company
                                                                      • 16.2.1.1. Overview
                                                                      • 16.2.1.2. Products
                                                                      • 16.2.1.3. SWOT Analysis
                                                                      • 16.2.1.4. Recent Developments
                                                                      • 16.2.1.5. Financials (Based on Availability)
                                                                    • 16.2.2 Thermo Fisher Scientific Inc
                                                                      • 16.2.2.1. Overview
                                                                      • 16.2.2.2. Products
                                                                      • 16.2.2.3. SWOT Analysis
                                                                      • 16.2.2.4. Recent Developments
                                                                      • 16.2.2.5. Financials (Based on Availability)
                                                                    • 16.2.3 Albagaia Ltd
                                                                      • 16.2.3.1. Overview
                                                                      • 16.2.3.2. Products
                                                                      • 16.2.3.3. SWOT Analysis
                                                                      • 16.2.3.4. Recent Developments
                                                                      • 16.2.3.5. Financials (Based on Availability)
                                                                    • 16.2.4 BioMerieux SA
                                                                      • 16.2.4.1. Overview
                                                                      • 16.2.4.2. Products
                                                                      • 16.2.4.3. SWOT Analysis
                                                                      • 16.2.4.4. Recent Developments
                                                                      • 16.2.4.5. Financials (Based on Availability)
                                                                    • 16.2.5 Phigenics LLC
                                                                      • 16.2.5.1. Overview
                                                                      • 16.2.5.2. Products
                                                                      • 16.2.5.3. SWOT Analysis
                                                                      • 16.2.5.4. Recent Developments
                                                                      • 16.2.5.5. Financials (Based on Availability)
                                                                    • 16.2.6 Evoqua Water Technologies (Pacific Water Technology)
                                                                      • 16.2.6.1. Overview
                                                                      • 16.2.6.2. Products
                                                                      • 16.2.6.3. SWOT Analysis
                                                                      • 16.2.6.4. Recent Developments
                                                                      • 16.2.6.5. Financials (Based on Availability)
                                                                    • 16.2.7 Aquacert Ltd
                                                                      • 16.2.7.1. Overview
                                                                      • 16.2.7.2. Products
                                                                      • 16.2.7.3. SWOT Analysis
                                                                      • 16.2.7.4. Recent Developments
                                                                      • 16.2.7.5. Financials (Based on Availability)
                                                                    • 16.2.8 Merck KgaA
                                                                      • 16.2.8.1. Overview
                                                                      • 16.2.8.2. Products
                                                                      • 16.2.8.3. SWOT Analysis
                                                                      • 16.2.8.4. Recent Developments
                                                                      • 16.2.8.5. Financials (Based on Availability)
                                                                    • 16.2.9 Qiagen NV
                                                                      • 16.2.9.1. Overview
                                                                      • 16.2.9.2. Products
                                                                      • 16.2.9.3. SWOT Analysis
                                                                      • 16.2.9.4. Recent Developments
                                                                      • 16.2.9.5. Financials (Based on Availability)
                                                                    • 16.2.10 Danaher Corporation (Pall Corporation)
                                                                      • 16.2.10.1. Overview
                                                                      • 16.2.10.2. Products
                                                                      • 16.2.10.3. SWOT Analysis
                                                                      • 16.2.10.4. Recent Developments
                                                                      • 16.2.10.5. Financials (Based on Availability)

                                                              List of Figures

                                                              1. Figure 1: Global Legionella Testing Industry Revenue Breakdown (Million, %) by Region 2024 & 2032
                                                              2. Figure 2: Global Legionella Testing Industry Volume Breakdown (K Unit, %) by Region 2024 & 2032
                                                              3. Figure 3: North Americ Legionella Testing Industry Revenue (Million), by Country 2024 & 2032
                                                              4. Figure 4: North Americ Legionella Testing Industry Volume (K Unit), by Country 2024 & 2032
                                                              5. Figure 5: North Americ Legionella Testing Industry Revenue Share (%), by Country 2024 & 2032
                                                              6. Figure 6: North Americ Legionella Testing Industry Volume Share (%), by Country 2024 & 2032
                                                              7. Figure 7: Europe Legionella Testing Industry Revenue (Million), by Country 2024 & 2032
                                                              8. Figure 8: Europe Legionella Testing Industry Volume (K Unit), by Country 2024 & 2032
                                                              9. Figure 9: Europe Legionella Testing Industry Revenue Share (%), by Country 2024 & 2032
                                                              10. Figure 10: Europe Legionella Testing Industry Volume Share (%), by Country 2024 & 2032
                                                              11. Figure 11: Asia Pacific Legionella Testing Industry Revenue (Million), by Country 2024 & 2032
                                                              12. Figure 12: Asia Pacific Legionella Testing Industry Volume (K Unit), by Country 2024 & 2032
                                                              13. Figure 13: Asia Pacific Legionella Testing Industry Revenue Share (%), by Country 2024 & 2032
                                                              14. Figure 14: Asia Pacific Legionella Testing Industry Volume Share (%), by Country 2024 & 2032
                                                              15. Figure 15: Middle East and Africa Legionella Testing Industry Revenue (Million), by Country 2024 & 2032
                                                              16. Figure 16: Middle East and Africa Legionella Testing Industry Volume (K Unit), by Country 2024 & 2032
                                                              17. Figure 17: Middle East and Africa Legionella Testing Industry Revenue Share (%), by Country 2024 & 2032
                                                              18. Figure 18: Middle East and Africa Legionella Testing Industry Volume Share (%), by Country 2024 & 2032
                                                              19. Figure 19: South America Legionella Testing Industry Revenue (Million), by Country 2024 & 2032
                                                              20. Figure 20: South America Legionella Testing Industry Volume (K Unit), by Country 2024 & 2032
                                                              21. Figure 21: South America Legionella Testing Industry Revenue Share (%), by Country 2024 & 2032
                                                              22. Figure 22: South America Legionella Testing Industry Volume Share (%), by Country 2024 & 2032
                                                              23. Figure 23: North America Legionella Testing Industry Revenue (Million), by Production Analysis 2024 & 2032
                                                              24. Figure 24: North America Legionella Testing Industry Volume (K Unit), by Production Analysis 2024 & 2032
                                                              25. Figure 25: North America Legionella Testing Industry Revenue Share (%), by Production Analysis 2024 & 2032
                                                              26. Figure 26: North America Legionella Testing Industry Volume Share (%), by Production Analysis 2024 & 2032
                                                              27. Figure 27: North America Legionella Testing Industry Revenue (Million), by Consumption Analysis 2024 & 2032
                                                              28. Figure 28: North America Legionella Testing Industry Volume (K Unit), by Consumption Analysis 2024 & 2032
                                                              29. Figure 29: North America Legionella Testing Industry Revenue Share (%), by Consumption Analysis 2024 & 2032
                                                              30. Figure 30: North America Legionella Testing Industry Volume Share (%), by Consumption Analysis 2024 & 2032
                                                              31. Figure 31: North America Legionella Testing Industry Revenue (Million), by Import Market Analysis (Value & Volume) 2024 & 2032
                                                              32. Figure 32: North America Legionella Testing Industry Volume (K Unit), by Import Market Analysis (Value & Volume) 2024 & 2032
                                                              33. Figure 33: North America Legionella Testing Industry Revenue Share (%), by Import Market Analysis (Value & Volume) 2024 & 2032
                                                              34. Figure 34: North America Legionella Testing Industry Volume Share (%), by Import Market Analysis (Value & Volume) 2024 & 2032
                                                              35. Figure 35: North America Legionella Testing Industry Revenue (Million), by Export Market Analysis (Value & Volume) 2024 & 2032
                                                              36. Figure 36: North America Legionella Testing Industry Volume (K Unit), by Export Market Analysis (Value & Volume) 2024 & 2032
                                                              37. Figure 37: North America Legionella Testing Industry Revenue Share (%), by Export Market Analysis (Value & Volume) 2024 & 2032
                                                              38. Figure 38: North America Legionella Testing Industry Volume Share (%), by Export Market Analysis (Value & Volume) 2024 & 2032
                                                              39. Figure 39: North America Legionella Testing Industry Revenue (Million), by Price Trend Analysis 2024 & 2032
                                                              40. Figure 40: North America Legionella Testing Industry Volume (K Unit), by Price Trend Analysis 2024 & 2032
                                                              41. Figure 41: North America Legionella Testing Industry Revenue Share (%), by Price Trend Analysis 2024 & 2032
                                                              42. Figure 42: North America Legionella Testing Industry Volume Share (%), by Price Trend Analysis 2024 & 2032
                                                              43. Figure 43: North America Legionella Testing Industry Revenue (Million), by Country 2024 & 2032
                                                              44. Figure 44: North America Legionella Testing Industry Volume (K Unit), by Country 2024 & 2032
                                                              45. Figure 45: North America Legionella Testing Industry Revenue Share (%), by Country 2024 & 2032
                                                              46. Figure 46: North America Legionella Testing Industry Volume Share (%), by Country 2024 & 2032
                                                              47. Figure 47: Europe Legionella Testing Industry Revenue (Million), by Production Analysis 2024 & 2032
                                                              48. Figure 48: Europe Legionella Testing Industry Volume (K Unit), by Production Analysis 2024 & 2032
                                                              49. Figure 49: Europe Legionella Testing Industry Revenue Share (%), by Production Analysis 2024 & 2032
                                                              50. Figure 50: Europe Legionella Testing Industry Volume Share (%), by Production Analysis 2024 & 2032
                                                              51. Figure 51: Europe Legionella Testing Industry Revenue (Million), by Consumption Analysis 2024 & 2032
                                                              52. Figure 52: Europe Legionella Testing Industry Volume (K Unit), by Consumption Analysis 2024 & 2032
                                                              53. Figure 53: Europe Legionella Testing Industry Revenue Share (%), by Consumption Analysis 2024 & 2032
                                                              54. Figure 54: Europe Legionella Testing Industry Volume Share (%), by Consumption Analysis 2024 & 2032
                                                              55. Figure 55: Europe Legionella Testing Industry Revenue (Million), by Import Market Analysis (Value & Volume) 2024 & 2032
                                                              56. Figure 56: Europe Legionella Testing Industry Volume (K Unit), by Import Market Analysis (Value & Volume) 2024 & 2032
                                                              57. Figure 57: Europe Legionella Testing Industry Revenue Share (%), by Import Market Analysis (Value & Volume) 2024 & 2032
                                                              58. Figure 58: Europe Legionella Testing Industry Volume Share (%), by Import Market Analysis (Value & Volume) 2024 & 2032
                                                              59. Figure 59: Europe Legionella Testing Industry Revenue (Million), by Export Market Analysis (Value & Volume) 2024 & 2032
                                                              60. Figure 60: Europe Legionella Testing Industry Volume (K Unit), by Export Market Analysis (Value & Volume) 2024 & 2032
                                                              61. Figure 61: Europe Legionella Testing Industry Revenue Share (%), by Export Market Analysis (Value & Volume) 2024 & 2032
                                                              62. Figure 62: Europe Legionella Testing Industry Volume Share (%), by Export Market Analysis (Value & Volume) 2024 & 2032
                                                              63. Figure 63: Europe Legionella Testing Industry Revenue (Million), by Price Trend Analysis 2024 & 2032
                                                              64. Figure 64: Europe Legionella Testing Industry Volume (K Unit), by Price Trend Analysis 2024 & 2032
                                                              65. Figure 65: Europe Legionella Testing Industry Revenue Share (%), by Price Trend Analysis 2024 & 2032
                                                              66. Figure 66: Europe Legionella Testing Industry Volume Share (%), by Price Trend Analysis 2024 & 2032
                                                              67. Figure 67: Europe Legionella Testing Industry Revenue (Million), by Country 2024 & 2032
                                                              68. Figure 68: Europe Legionella Testing Industry Volume (K Unit), by Country 2024 & 2032
                                                              69. Figure 69: Europe Legionella Testing Industry Revenue Share (%), by Country 2024 & 2032
                                                              70. Figure 70: Europe Legionella Testing Industry Volume Share (%), by Country 2024 & 2032
                                                              71. Figure 71: Asia Pacific Legionella Testing Industry Revenue (Million), by Production Analysis 2024 & 2032
                                                              72. Figure 72: Asia Pacific Legionella Testing Industry Volume (K Unit), by Production Analysis 2024 & 2032
                                                              73. Figure 73: Asia Pacific Legionella Testing Industry Revenue Share (%), by Production Analysis 2024 & 2032
                                                              74. Figure 74: Asia Pacific Legionella Testing Industry Volume Share (%), by Production Analysis 2024 & 2032
                                                              75. Figure 75: Asia Pacific Legionella Testing Industry Revenue (Million), by Consumption Analysis 2024 & 2032
                                                              76. Figure 76: Asia Pacific Legionella Testing Industry Volume (K Unit), by Consumption Analysis 2024 & 2032
                                                              77. Figure 77: Asia Pacific Legionella Testing Industry Revenue Share (%), by Consumption Analysis 2024 & 2032
                                                              78. Figure 78: Asia Pacific Legionella Testing Industry Volume Share (%), by Consumption Analysis 2024 & 2032
                                                              79. Figure 79: Asia Pacific Legionella Testing Industry Revenue (Million), by Import Market Analysis (Value & Volume) 2024 & 2032
                                                              80. Figure 80: Asia Pacific Legionella Testing Industry Volume (K Unit), by Import Market Analysis (Value & Volume) 2024 & 2032
                                                              81. Figure 81: Asia Pacific Legionella Testing Industry Revenue Share (%), by Import Market Analysis (Value & Volume) 2024 & 2032
                                                              82. Figure 82: Asia Pacific Legionella Testing Industry Volume Share (%), by Import Market Analysis (Value & Volume) 2024 & 2032
                                                              83. Figure 83: Asia Pacific Legionella Testing Industry Revenue (Million), by Export Market Analysis (Value & Volume) 2024 & 2032
                                                              84. Figure 84: Asia Pacific Legionella Testing Industry Volume (K Unit), by Export Market Analysis (Value & Volume) 2024 & 2032
                                                              85. Figure 85: Asia Pacific Legionella Testing Industry Revenue Share (%), by Export Market Analysis (Value & Volume) 2024 & 2032
                                                              86. Figure 86: Asia Pacific Legionella Testing Industry Volume Share (%), by Export Market Analysis (Value & Volume) 2024 & 2032
                                                              87. Figure 87: Asia Pacific Legionella Testing Industry Revenue (Million), by Price Trend Analysis 2024 & 2032
                                                              88. Figure 88: Asia Pacific Legionella Testing Industry Volume (K Unit), by Price Trend Analysis 2024 & 2032
                                                              89. Figure 89: Asia Pacific Legionella Testing Industry Revenue Share (%), by Price Trend Analysis 2024 & 2032
                                                              90. Figure 90: Asia Pacific Legionella Testing Industry Volume Share (%), by Price Trend Analysis 2024 & 2032
                                                              91. Figure 91: Asia Pacific Legionella Testing Industry Revenue (Million), by Country 2024 & 2032
                                                              92. Figure 92: Asia Pacific Legionella Testing Industry Volume (K Unit), by Country 2024 & 2032
                                                              93. Figure 93: Asia Pacific Legionella Testing Industry Revenue Share (%), by Country 2024 & 2032
                                                              94. Figure 94: Asia Pacific Legionella Testing Industry Volume Share (%), by Country 2024 & 2032
                                                              95. Figure 95: Middle East and Africa Legionella Testing Industry Revenue (Million), by Production Analysis 2024 & 2032
                                                              96. Figure 96: Middle East and Africa Legionella Testing Industry Volume (K Unit), by Production Analysis 2024 & 2032
                                                              97. Figure 97: Middle East and Africa Legionella Testing Industry Revenue Share (%), by Production Analysis 2024 & 2032
                                                              98. Figure 98: Middle East and Africa Legionella Testing Industry Volume Share (%), by Production Analysis 2024 & 2032
                                                              99. Figure 99: Middle East and Africa Legionella Testing Industry Revenue (Million), by Consumption Analysis 2024 & 2032
                                                              100. Figure 100: Middle East and Africa Legionella Testing Industry Volume (K Unit), by Consumption Analysis 2024 & 2032
                                                              101. Figure 101: Middle East and Africa Legionella Testing Industry Revenue Share (%), by Consumption Analysis 2024 & 2032
                                                              102. Figure 102: Middle East and Africa Legionella Testing Industry Volume Share (%), by Consumption Analysis 2024 & 2032
                                                              103. Figure 103: Middle East and Africa Legionella Testing Industry Revenue (Million), by Import Market Analysis (Value & Volume) 2024 & 2032
                                                              104. Figure 104: Middle East and Africa Legionella Testing Industry Volume (K Unit), by Import Market Analysis (Value & Volume) 2024 & 2032
                                                              105. Figure 105: Middle East and Africa Legionella Testing Industry Revenue Share (%), by Import Market Analysis (Value & Volume) 2024 & 2032
                                                              106. Figure 106: Middle East and Africa Legionella Testing Industry Volume Share (%), by Import Market Analysis (Value & Volume) 2024 & 2032
                                                              107. Figure 107: Middle East and Africa Legionella Testing Industry Revenue (Million), by Export Market Analysis (Value & Volume) 2024 & 2032
                                                              108. Figure 108: Middle East and Africa Legionella Testing Industry Volume (K Unit), by Export Market Analysis (Value & Volume) 2024 & 2032
                                                              109. Figure 109: Middle East and Africa Legionella Testing Industry Revenue Share (%), by Export Market Analysis (Value & Volume) 2024 & 2032
                                                              110. Figure 110: Middle East and Africa Legionella Testing Industry Volume Share (%), by Export Market Analysis (Value & Volume) 2024 & 2032
                                                              111. Figure 111: Middle East and Africa Legionella Testing Industry Revenue (Million), by Price Trend Analysis 2024 & 2032
                                                              112. Figure 112: Middle East and Africa Legionella Testing Industry Volume (K Unit), by Price Trend Analysis 2024 & 2032
                                                              113. Figure 113: Middle East and Africa Legionella Testing Industry Revenue Share (%), by Price Trend Analysis 2024 & 2032
                                                              114. Figure 114: Middle East and Africa Legionella Testing Industry Volume Share (%), by Price Trend Analysis 2024 & 2032
                                                              115. Figure 115: Middle East and Africa Legionella Testing Industry Revenue (Million), by Country 2024 & 2032
                                                              116. Figure 116: Middle East and Africa Legionella Testing Industry Volume (K Unit), by Country 2024 & 2032
                                                              117. Figure 117: Middle East and Africa Legionella Testing Industry Revenue Share (%), by Country 2024 & 2032
                                                              118. Figure 118: Middle East and Africa Legionella Testing Industry Volume Share (%), by Country 2024 & 2032
                                                              119. Figure 119: South America Legionella Testing Industry Revenue (Million), by Production Analysis 2024 & 2032
                                                              120. Figure 120: South America Legionella Testing Industry Volume (K Unit), by Production Analysis 2024 & 2032
                                                              121. Figure 121: South America Legionella Testing Industry Revenue Share (%), by Production Analysis 2024 & 2032
                                                              122. Figure 122: South America Legionella Testing Industry Volume Share (%), by Production Analysis 2024 & 2032
                                                              123. Figure 123: South America Legionella Testing Industry Revenue (Million), by Consumption Analysis 2024 & 2032
                                                              124. Figure 124: South America Legionella Testing Industry Volume (K Unit), by Consumption Analysis 2024 & 2032
                                                              125. Figure 125: South America Legionella Testing Industry Revenue Share (%), by Consumption Analysis 2024 & 2032
                                                              126. Figure 126: South America Legionella Testing Industry Volume Share (%), by Consumption Analysis 2024 & 2032
                                                              127. Figure 127: South America Legionella Testing Industry Revenue (Million), by Import Market Analysis (Value & Volume) 2024 & 2032
                                                              128. Figure 128: South America Legionella Testing Industry Volume (K Unit), by Import Market Analysis (Value & Volume) 2024 & 2032
                                                              129. Figure 129: South America Legionella Testing Industry Revenue Share (%), by Import Market Analysis (Value & Volume) 2024 & 2032
                                                              130. Figure 130: South America Legionella Testing Industry Volume Share (%), by Import Market Analysis (Value & Volume) 2024 & 2032
                                                              131. Figure 131: South America Legionella Testing Industry Revenue (Million), by Export Market Analysis (Value & Volume) 2024 & 2032
                                                              132. Figure 132: South America Legionella Testing Industry Volume (K Unit), by Export Market Analysis (Value & Volume) 2024 & 2032
                                                              133. Figure 133: South America Legionella Testing Industry Revenue Share (%), by Export Market Analysis (Value & Volume) 2024 & 2032
                                                              134. Figure 134: South America Legionella Testing Industry Volume Share (%), by Export Market Analysis (Value & Volume) 2024 & 2032
                                                              135. Figure 135: South America Legionella Testing Industry Revenue (Million), by Price Trend Analysis 2024 & 2032
                                                              136. Figure 136: South America Legionella Testing Industry Volume (K Unit), by Price Trend Analysis 2024 & 2032
                                                              137. Figure 137: South America Legionella Testing Industry Revenue Share (%), by Price Trend Analysis 2024 & 2032
                                                              138. Figure 138: South America Legionella Testing Industry Volume Share (%), by Price Trend Analysis 2024 & 2032
                                                              139. Figure 139: South America Legionella Testing Industry Revenue (Million), by Country 2024 & 2032
                                                              140. Figure 140: South America Legionella Testing Industry Volume (K Unit), by Country 2024 & 2032
                                                              141. Figure 141: South America Legionella Testing Industry Revenue Share (%), by Country 2024 & 2032
                                                              142. Figure 142: South America Legionella Testing Industry Volume Share (%), by Country 2024 & 2032

                                                              List of Tables

                                                              1. Table 1: Global Legionella Testing Industry Revenue Million Forecast, by Region 2019 & 2032
                                                              2. Table 2: Global Legionella Testing Industry Volume K Unit Forecast, by Region 2019 & 2032
                                                              3. Table 3: Global Legionella Testing Industry Revenue Million Forecast, by Production Analysis 2019 & 2032
                                                              4. Table 4: Global Legionella Testing Industry Volume K Unit Forecast, by Production Analysis 2019 & 2032
                                                              5. Table 5: Global Legionella Testing Industry Revenue Million Forecast, by Consumption Analysis 2019 & 2032
                                                              6. Table 6: Global Legionella Testing Industry Volume K Unit Forecast, by Consumption Analysis 2019 & 2032
                                                              7. Table 7: Global Legionella Testing Industry Revenue Million Forecast, by Import Market Analysis (Value & Volume) 2019 & 2032
                                                              8. Table 8: Global Legionella Testing Industry Volume K Unit Forecast, by Import Market Analysis (Value & Volume) 2019 & 2032
                                                              9. Table 9: Global Legionella Testing Industry Revenue Million Forecast, by Export Market Analysis (Value & Volume) 2019 & 2032
                                                              10. Table 10: Global Legionella Testing Industry Volume K Unit Forecast, by Export Market Analysis (Value & Volume) 2019 & 2032
                                                              11. Table 11: Global Legionella Testing Industry Revenue Million Forecast, by Price Trend Analysis 2019 & 2032
                                                              12. Table 12: Global Legionella Testing Industry Volume K Unit Forecast, by Price Trend Analysis 2019 & 2032
                                                              13. Table 13: Global Legionella Testing Industry Revenue Million Forecast, by Region 2019 & 2032
                                                              14. Table 14: Global Legionella Testing Industry Volume K Unit Forecast, by Region 2019 & 2032
                                                              15. Table 15: Global Legionella Testing Industry Revenue Million Forecast, by Country 2019 & 2032
                                                              16. Table 16: Global Legionella Testing Industry Volume K Unit Forecast, by Country 2019 & 2032
                                                              17. Table 17: Global Legionella Testing Industry Revenue Million Forecast, by Country 2019 & 2032
                                                              18. Table 18: Global Legionella Testing Industry Volume K Unit Forecast, by Country 2019 & 2032
                                                              19. Table 19: Global Legionella Testing Industry Revenue Million Forecast, by Country 2019 & 2032
                                                              20. Table 20: Global Legionella Testing Industry Volume K Unit Forecast, by Country 2019 & 2032
                                                              21. Table 21: Global Legionella Testing Industry Revenue Million Forecast, by Country 2019 & 2032
                                                              22. Table 22: Global Legionella Testing Industry Volume K Unit Forecast, by Country 2019 & 2032
                                                              23. Table 23: Global Legionella Testing Industry Revenue Million Forecast, by Country 2019 & 2032
                                                              24. Table 24: Global Legionella Testing Industry Volume K Unit Forecast, by Country 2019 & 2032
                                                              25. Table 25: Global Legionella Testing Industry Revenue Million Forecast, by Production Analysis 2019 & 2032
                                                              26. Table 26: Global Legionella Testing Industry Volume K Unit Forecast, by Production Analysis 2019 & 2032
                                                              27. Table 27: Global Legionella Testing Industry Revenue Million Forecast, by Consumption Analysis 2019 & 2032
                                                              28. Table 28: Global Legionella Testing Industry Volume K Unit Forecast, by Consumption Analysis 2019 & 2032
                                                              29. Table 29: Global Legionella Testing Industry Revenue Million Forecast, by Import Market Analysis (Value & Volume) 2019 & 2032
                                                              30. Table 30: Global Legionella Testing Industry Volume K Unit Forecast, by Import Market Analysis (Value & Volume) 2019 & 2032
                                                              31. Table 31: Global Legionella Testing Industry Revenue Million Forecast, by Export Market Analysis (Value & Volume) 2019 & 2032
                                                              32. Table 32: Global Legionella Testing Industry Volume K Unit Forecast, by Export Market Analysis (Value & Volume) 2019 & 2032
                                                              33. Table 33: Global Legionella Testing Industry Revenue Million Forecast, by Price Trend Analysis 2019 & 2032
                                                              34. Table 34: Global Legionella Testing Industry Volume K Unit Forecast, by Price Trend Analysis 2019 & 2032
                                                              35. Table 35: Global Legionella Testing Industry Revenue Million Forecast, by Country 2019 & 2032
                                                              36. Table 36: Global Legionella Testing Industry Volume K Unit Forecast, by Country 2019 & 2032
                                                              37. Table 37: United States Legionella Testing Industry Revenue (Million) Forecast, by Application 2019 & 2032
                                                              38. Table 38: United States Legionella Testing Industry Volume (K Unit) Forecast, by Application 2019 & 2032
                                                              39. Table 39: Canada Legionella Testing Industry Revenue (Million) Forecast, by Application 2019 & 2032
                                                              40. Table 40: Canada Legionella Testing Industry Volume (K Unit) Forecast, by Application 2019 & 2032
                                                              41. Table 41: Mexico Legionella Testing Industry Revenue (Million) Forecast, by Application 2019 & 2032
                                                              42. Table 42: Mexico Legionella Testing Industry Volume (K Unit) Forecast, by Application 2019 & 2032
                                                              43. Table 43: Global Legionella Testing Industry Revenue Million Forecast, by Production Analysis 2019 & 2032
                                                              44. Table 44: Global Legionella Testing Industry Volume K Unit Forecast, by Production Analysis 2019 & 2032
                                                              45. Table 45: Global Legionella Testing Industry Revenue Million Forecast, by Consumption Analysis 2019 & 2032
                                                              46. Table 46: Global Legionella Testing Industry Volume K Unit Forecast, by Consumption Analysis 2019 & 2032
                                                              47. Table 47: Global Legionella Testing Industry Revenue Million Forecast, by Import Market Analysis (Value & Volume) 2019 & 2032
                                                              48. Table 48: Global Legionella Testing Industry Volume K Unit Forecast, by Import Market Analysis (Value & Volume) 2019 & 2032
                                                              49. Table 49: Global Legionella Testing Industry Revenue Million Forecast, by Export Market Analysis (Value & Volume) 2019 & 2032
                                                              50. Table 50: Global Legionella Testing Industry Volume K Unit Forecast, by Export Market Analysis (Value & Volume) 2019 & 2032
                                                              51. Table 51: Global Legionella Testing Industry Revenue Million Forecast, by Price Trend Analysis 2019 & 2032
                                                              52. Table 52: Global Legionella Testing Industry Volume K Unit Forecast, by Price Trend Analysis 2019 & 2032
                                                              53. Table 53: Global Legionella Testing Industry Revenue Million Forecast, by Country 2019 & 2032
                                                              54. Table 54: Global Legionella Testing Industry Volume K Unit Forecast, by Country 2019 & 2032
                                                              55. Table 55: Germany Legionella Testing Industry Revenue (Million) Forecast, by Application 2019 & 2032
                                                              56. Table 56: Germany Legionella Testing Industry Volume (K Unit) Forecast, by Application 2019 & 2032
                                                              57. Table 57: United Kingdom Legionella Testing Industry Revenue (Million) Forecast, by Application 2019 & 2032
                                                              58. Table 58: United Kingdom Legionella Testing Industry Volume (K Unit) Forecast, by Application 2019 & 2032
                                                              59. Table 59: France Legionella Testing Industry Revenue (Million) Forecast, by Application 2019 & 2032
                                                              60. Table 60: France Legionella Testing Industry Volume (K Unit) Forecast, by Application 2019 & 2032
                                                              61. Table 61: Italy Legionella Testing Industry Revenue (Million) Forecast, by Application 2019 & 2032
                                                              62. Table 62: Italy Legionella Testing Industry Volume (K Unit) Forecast, by Application 2019 & 2032
                                                              63. Table 63: Spain Legionella Testing Industry Revenue (Million) Forecast, by Application 2019 & 2032
                                                              64. Table 64: Spain Legionella Testing Industry Volume (K Unit) Forecast, by Application 2019 & 2032
                                                              65. Table 65: Rest of Europe Legionella Testing Industry Revenue (Million) Forecast, by Application 2019 & 2032
                                                              66. Table 66: Rest of Europe Legionella Testing Industry Volume (K Unit) Forecast, by Application 2019 & 2032
                                                              67. Table 67: Global Legionella Testing Industry Revenue Million Forecast, by Production Analysis 2019 & 2032
                                                              68. Table 68: Global Legionella Testing Industry Volume K Unit Forecast, by Production Analysis 2019 & 2032
                                                              69. Table 69: Global Legionella Testing Industry Revenue Million Forecast, by Consumption Analysis 2019 & 2032
                                                              70. Table 70: Global Legionella Testing Industry Volume K Unit Forecast, by Consumption Analysis 2019 & 2032
                                                              71. Table 71: Global Legionella Testing Industry Revenue Million Forecast, by Import Market Analysis (Value & Volume) 2019 & 2032
                                                              72. Table 72: Global Legionella Testing Industry Volume K Unit Forecast, by Import Market Analysis (Value & Volume) 2019 & 2032
                                                              73. Table 73: Global Legionella Testing Industry Revenue Million Forecast, by Export Market Analysis (Value & Volume) 2019 & 2032
                                                              74. Table 74: Global Legionella Testing Industry Volume K Unit Forecast, by Export Market Analysis (Value & Volume) 2019 & 2032
                                                              75. Table 75: Global Legionella Testing Industry Revenue Million Forecast, by Price Trend Analysis 2019 & 2032
                                                              76. Table 76: Global Legionella Testing Industry Volume K Unit Forecast, by Price Trend Analysis 2019 & 2032
                                                              77. Table 77: Global Legionella Testing Industry Revenue Million Forecast, by Country 2019 & 2032
                                                              78. Table 78: Global Legionella Testing Industry Volume K Unit Forecast, by Country 2019 & 2032
                                                              79. Table 79: China Legionella Testing Industry Revenue (Million) Forecast, by Application 2019 & 2032
                                                              80. Table 80: China Legionella Testing Industry Volume (K Unit) Forecast, by Application 2019 & 2032
                                                              81. Table 81: Japan Legionella Testing Industry Revenue (Million) Forecast, by Application 2019 & 2032
                                                              82. Table 82: Japan Legionella Testing Industry Volume (K Unit) Forecast, by Application 2019 & 2032
                                                              83. Table 83: India Legionella Testing Industry Revenue (Million) Forecast, by Application 2019 & 2032
                                                              84. Table 84: India Legionella Testing Industry Volume (K Unit) Forecast, by Application 2019 & 2032
                                                              85. Table 85: Australia Legionella Testing Industry Revenue (Million) Forecast, by Application 2019 & 2032
                                                              86. Table 86: Australia Legionella Testing Industry Volume (K Unit) Forecast, by Application 2019 & 2032
                                                              87. Table 87: South Korea Legionella Testing Industry Revenue (Million) Forecast, by Application 2019 & 2032
                                                              88. Table 88: South Korea Legionella Testing Industry Volume (K Unit) Forecast, by Application 2019 & 2032
                                                              89. Table 89: Rest of Asia Pacific Legionella Testing Industry Revenue (Million) Forecast, by Application 2019 & 2032
                                                              90. Table 90: Rest of Asia Pacific Legionella Testing Industry Volume (K Unit) Forecast, by Application 2019 & 2032
                                                              91. Table 91: Global Legionella Testing Industry Revenue Million Forecast, by Production Analysis 2019 & 2032
                                                              92. Table 92: Global Legionella Testing Industry Volume K Unit Forecast, by Production Analysis 2019 & 2032
                                                              93. Table 93: Global Legionella Testing Industry Revenue Million Forecast, by Consumption Analysis 2019 & 2032
                                                              94. Table 94: Global Legionella Testing Industry Volume K Unit Forecast, by Consumption Analysis 2019 & 2032
                                                              95. Table 95: Global Legionella Testing Industry Revenue Million Forecast, by Import Market Analysis (Value & Volume) 2019 & 2032
                                                              96. Table 96: Global Legionella Testing Industry Volume K Unit Forecast, by Import Market Analysis (Value & Volume) 2019 & 2032
                                                              97. Table 97: Global Legionella Testing Industry Revenue Million Forecast, by Export Market Analysis (Value & Volume) 2019 & 2032
                                                              98. Table 98: Global Legionella Testing Industry Volume K Unit Forecast, by Export Market Analysis (Value & Volume) 2019 & 2032
                                                              99. Table 99: Global Legionella Testing Industry Revenue Million Forecast, by Price Trend Analysis 2019 & 2032
                                                              100. Table 100: Global Legionella Testing Industry Volume K Unit Forecast, by Price Trend Analysis 2019 & 2032
                                                              101. Table 101: Global Legionella Testing Industry Revenue Million Forecast, by Country 2019 & 2032
                                                              102. Table 102: Global Legionella Testing Industry Volume K Unit Forecast, by Country 2019 & 2032
                                                              103. Table 103: GCC Legionella Testing Industry Revenue (Million) Forecast, by Application 2019 & 2032
                                                              104. Table 104: GCC Legionella Testing Industry Volume (K Unit) Forecast, by Application 2019 & 2032
                                                              105. Table 105: South Africa Legionella Testing Industry Revenue (Million) Forecast, by Application 2019 & 2032
                                                              106. Table 106: South Africa Legionella Testing Industry Volume (K Unit) Forecast, by Application 2019 & 2032
                                                              107. Table 107: Rest of Middle East and Africa Legionella Testing Industry Revenue (Million) Forecast, by Application 2019 & 2032
                                                              108. Table 108: Rest of Middle East and Africa Legionella Testing Industry Volume (K Unit) Forecast, by Application 2019 & 2032
                                                              109. Table 109: Global Legionella Testing Industry Revenue Million Forecast, by Production Analysis 2019 & 2032
                                                              110. Table 110: Global Legionella Testing Industry Volume K Unit Forecast, by Production Analysis 2019 & 2032
                                                              111. Table 111: Global Legionella Testing Industry Revenue Million Forecast, by Consumption Analysis 2019 & 2032
                                                              112. Table 112: Global Legionella Testing Industry Volume K Unit Forecast, by Consumption Analysis 2019 & 2032
                                                              113. Table 113: Global Legionella Testing Industry Revenue Million Forecast, by Import Market Analysis (Value & Volume) 2019 & 2032
                                                              114. Table 114: Global Legionella Testing Industry Volume K Unit Forecast, by Import Market Analysis (Value & Volume) 2019 & 2032
                                                              115. Table 115: Global Legionella Testing Industry Revenue Million Forecast, by Export Market Analysis (Value & Volume) 2019 & 2032
                                                              116. Table 116: Global Legionella Testing Industry Volume K Unit Forecast, by Export Market Analysis (Value & Volume) 2019 & 2032
                                                              117. Table 117: Global Legionella Testing Industry Revenue Million Forecast, by Price Trend Analysis 2019 & 2032
                                                              118. Table 118: Global Legionella Testing Industry Volume K Unit Forecast, by Price Trend Analysis 2019 & 2032
                                                              119. Table 119: Global Legionella Testing Industry Revenue Million Forecast, by Country 2019 & 2032
                                                              120. Table 120: Global Legionella Testing Industry Volume K Unit Forecast, by Country 2019 & 2032
                                                              121. Table 121: Brazil Legionella Testing Industry Revenue (Million) Forecast, by Application 2019 & 2032
                                                              122. Table 122: Brazil Legionella Testing Industry Volume (K Unit) Forecast, by Application 2019 & 2032
                                                              123. Table 123: Argentina Legionella Testing Industry Revenue (Million) Forecast, by Application 2019 & 2032
                                                              124. Table 124: Argentina Legionella Testing Industry Volume (K Unit) Forecast, by Application 2019 & 2032
                                                              125. Table 125: Rest of South America Legionella Testing Industry Revenue (Million) Forecast, by Application 2019 & 2032
                                                              126. Table 126: Rest of South America Legionella Testing Industry Volume (K Unit) Forecast, by Application 2019 & 2032


                                                              Frequently Asked Questions

                                                              1. What is the projected Compound Annual Growth Rate (CAGR) of the Legionella Testing Industry?

                                                              The projected CAGR is approximately 8.17%.

                                                              2. Which companies are prominent players in the Legionella Testing Industry?

                                                              Key companies in the market include Becton Dickinson and Company, Thermo Fisher Scientific Inc , Albagaia Ltd, BioMerieux SA, Phigenics LLC, Evoqua Water Technologies (Pacific Water Technology), Aquacert Ltd, Merck KgaA, Qiagen NV, Danaher Corporation (Pall Corporation).

                                                              3. What are the main segments of the Legionella Testing Industry?

                                                              The market segments include Production Analysis, Consumption Analysis, Import Market Analysis (Value & Volume), Export Market Analysis (Value & Volume), Price Trend Analysis.

                                                              4. Can you provide details about the market size?

                                                              The market size is estimated to be USD 349.01 Million as of 2022.

                                                              5. What are some drivers contributing to market growth?

                                                              Rising Incidence of Pneumonia and Legionella-related Illnesses; Increasing Demand for Rapid and Advanced Diagnostic Techniques; Technological Advancements in the Field of Bacterial Testing.

                                                              6. What are the notable trends driving market growth?

                                                              Urinary Antigen Test (UAT) Segment is Expected to Hold a Major Market Share in the Legionella Testing Market.

                                                              7. Are there any restraints impacting market growth?

                                                              Issues in Sensitivity of Diagnostic Tests.

                                                              8. Can you provide examples of recent developments in the market?

                                                              In May 2022, ChemREADY, manufacturer of water and wastewater treatment chemicals, announced the debut of its new Legionella testing services and product line to battle the water-borne infection in building water systems.

                                                              9. What pricing options are available for accessing the report?

                                                              Pricing options include single-user, multi-user, and enterprise licenses priced at USD 4750, USD 5250, and USD 8750 respectively.

                                                              10. Is the market size provided in terms of value or volume?

                                                              The market size is provided in terms of value, measured in Million and volume, measured in K Unit.

                                                              11. Are there any specific market keywords associated with the report?

                                                              Yes, the market keyword associated with the report is "Legionella Testing Industry," which aids in identifying and referencing the specific market segment covered.

                                                              12. How do I determine which pricing option suits my needs best?

                                                              The pricing options vary based on user requirements and access needs. Individual users may opt for single-user licenses, while businesses requiring broader access may choose multi-user or enterprise licenses for cost-effective access to the report.

                                                              13. Are there any additional resources or data provided in the Legionella Testing Industry report?

                                                              While the report offers comprehensive insights, it's advisable to review the specific contents or supplementary materials provided to ascertain if additional resources or data are available.

                                                              14. How can I stay updated on further developments or reports in the Legionella Testing Industry?

                                                              To stay informed about further developments, trends, and reports in the Legionella Testing Industry, consider subscribing to industry newsletters, following relevant companies and organizations, or regularly checking reputable industry news sources and publications.


                                                              Methodology

                                                              Step 1 - Identification of Relevant Samples Size from Population Database

                                                              Step Chart
                                                              Bar Chart
                                                              Method Chart

                                                              Step 2 - Approaches for Defining Global Market Size (Value, Volume* & Price*)

                                                              Approach Chart
                                                              Top-down and bottom-up approaches are used to validate the global market size and estimate the market size for manufactures, regional segments, product, and application.

                                                              Note*: In applicable scenarios

                                                              Step 3 - Data Sources

                                                              Primary Research

                                                              • Web Analytics
                                                              • Survey Reports
                                                              • Research Institute
                                                              • Latest Research Reports
                                                              • Opinion Leaders

                                                              Secondary Research

                                                              • Annual Reports
                                                              • White Paper
                                                              • Latest Press Release
                                                              • Industry Association
                                                              • Paid Database
                                                              • Investor Presentations
                                                              Analyst Chart

                                                              Step 4 - Data Triangulation

                                                              Involves using different sources of information in order to increase the validity of a study

                                                              These sources are likely to be stakeholders in a program - participants, other researchers, program staff, other community members, and so on.

                                                              Then we put all data in single framework & apply various statistical tools to find out the dynamic on the market.

                                                              During the analysis stage, feedback from the stakeholder groups would be compared to determine areas of agreement as well as areas of divergence

                                                              Additionally, after gathering mixed and scattered data from a wide range of sources, data is triangulated and correlated to come up with estimated figures which are further validated through primary mediums or industry experts, opinion leaders.

                                                              About Visionary Data Reports

                                                              Visionary Data Reports provides future-focused market research, advanced analytics, and strategic insights for technology, healthcare, green energy, and finance. Our reports help you anticipate trends, innovate, and lead in your industry. Our expert team combines primary research, data science, and industry knowledge to deliver actionable intelligence. We offer syndicated reports, custom analytics, and consulting services tailored to your business needs. At Visionary Data Reports, we are committed to quality, transparency, and client satisfaction. Every report is rigorously validated to ensure accuracy and relevance. Our global perspective and forward-thinking approach help you understand both current and emerging market dynamics.

                                                              Stay ahead with Visionary Data Reports. Subscribe to our newsletter for the latest insights and research highlights, and follow us on social media for real-time updates. Visionary Data Reports – Your Guide to Tomorrow’s Opportunities.

                                                              • Home
                                                              • About Us
                                                              • Industries
                                                                • Aerospace & Defense
                                                                • Agriculture
                                                                • Animal Nutrition & Wellness
                                                                • Automotive
                                                                • Chemicals & Materials
                                                                • Consumer Goods and Services
                                                                • Energy & Power
                                                                • Financial Services and Investment Intelligence
                                                                • Food & Beverage
                                                                • Home and Property Improvement
                                                                • Hospitality and Tourism
                                                                • Logistics
                                                                • Manufacturing Products and Services
                                                                • Packaging
                                                                • Professional and Commercial Services
                                                                • Real Estate and Construction
                                                                • Retail
                                                                • Technology, Media and Telecom
                                                                • Healthcare
                                                              • Services
                                                              • Contact
                                                              Main Logo
                                                              • Home
                                                              • About Us
                                                              • Industries
                                                                • Aerospace & Defense
                                                                • Agriculture
                                                                • Animal Nutrition & Wellness
                                                                • Automotive
                                                                • Chemicals & Materials
                                                                • Consumer Goods and Services
                                                                • Energy & Power
                                                                • Financial Services and Investment Intelligence
                                                                • Food & Beverage
                                                                • Home and Property Improvement
                                                                • Hospitality and Tourism
                                                                • Logistics
                                                                • Manufacturing Products and Services
                                                                • Packaging
                                                                • Professional and Commercial Services
                                                                • Real Estate and Construction
                                                                • Retail
                                                                • Technology, Media and Telecom
                                                                • Healthcare
                                                              • Services
                                                              • Contact
                                                              +17162654855
                                                              [email protected]

                                                              +17162654855

                                                              [email protected]

                                                              Business Address

                                                              Head Office

                                                              Office no. A 5010, fifth floor, Solitaire Business Hub, Near Phoenix mall, Pune, Maharashtra 411014

                                                              Contact Information

                                                              Craig Francis

                                                              Business Development Head

                                                              +17162654855

                                                              [email protected]

                                                              Connect With Us

                                                              Secure Payment Partners

                                                              payment image
                                                              RetailLogisticsPackagingAutomotiveHealthcareAgricultureEnergy & PowerFood & BeverageAerospace & DefenseChemicals & MaterialsHospitality and TourismAnimal Nutrition & WellnessConsumer Goods and ServicesReal Estate and ConstructionHome and Property ImprovementTechnology, Media and TelecomManufacturing Products and ServicesFinancial Services and Investment Intelligence

                                                              © 2025 All rights reserved


                                                              Privacy Policy
                                                              Terms and Conditions
                                                              FAQ
                                                              artwork spiralartwork spiralRelated Reports
                                                              artwork underline

                                                              Molecular Weight Marker Market Growth Pathways: Strategic Analysis and Forecasts 2025-2033

                                                              The global molecular weight marker market is booming, projected to reach $2.09 billion by 2033 with a CAGR of 13.17%. Driven by advancements in genomics and proteomics, this market offers lucrative opportunities across DNA, RNA, and protein markers for applications in PCR, blotting, and more. Explore key trends, restraints, and leading companies shaping this dynamic sector.

                                                              August 2025
                                                              Base Year: 2024
                                                              No Of Pages: 234
                                                              Price: $4750

                                                              Exploring Ear Infection Treatment Industry Market Disruption and Innovation

                                                              The global ear infection treatment market is booming, projected to reach [estimated 2033 market size based on CAGR] by 2033. Discover key trends, drivers, and restraints impacting this $12.23 billion (2025) market, including rising prevalence, antibiotic resistance, and innovative treatment advancements. Explore market segmentation by infection type, treatment, and geography.

                                                              August 2025
                                                              Base Year: 2024
                                                              No Of Pages: 234
                                                              Price: $4750

                                                              Regional Trends and Opportunities for Egypt Diabetes Drugs and Devices Market Market

                                                              Discover the booming Egypt diabetes drugs and devices market! This comprehensive analysis reveals a CAGR exceeding 3%, driven by rising prevalence and technological advancements. Explore market size, segmentation, key players (Roche, Novo Nordisk, Abbott etc.), and future trends impacting this lucrative sector in Egypt from 2019-2033.

                                                              August 2025
                                                              Base Year: 2024
                                                              No Of Pages: 197
                                                              Price: $3800

                                                              Global Drug Discovery Outsourcing Market Market Report: Trends and Growth

                                                              The global drug discovery outsourcing market is booming, projected to reach [estimated final market size in 2033] by 2033 with a CAGR of 7.50%. This comprehensive market analysis explores key drivers, trends, and restraints, including the rise of AI, biopharmaceuticals, and regional growth in Asia-Pacific. Learn about top companies, segmented data, and the future of drug development outsourcing.

                                                              August 2025
                                                              Base Year: 2024
                                                              No Of Pages: 234
                                                              Price: $4750

                                                              Strategic Insights into Global Spinal Imaging Treatment Market Market Trends

                                                              The global spinal imaging treatment market is booming, projected to reach $XX million by 2033, driven by rising spinal disorder prevalence and technological advancements. Explore market trends, key players (GE Healthcare, Siemens Healthineers, etc.), and regional growth forecasts in this comprehensive analysis.

                                                              August 2025
                                                              Base Year: 2024
                                                              No Of Pages: 234
                                                              Price: $4750

                                                              Strategic Drivers of Growth in Hydrogel Dressings Industry Industry

                                                              The hydrogel dressings market is booming, projected to reach $7.3 billion by 2033 at a CAGR of 5.3%. Driven by rising chronic wound prevalence and advancements in hydrogel technology, this market analysis explores key trends, segments (foam, alginate, etc.), and leading companies like 3M and Smith & Nephew. Discover market size, growth projections, and regional insights.

                                                              August 2025
                                                              Base Year: 2024
                                                              No Of Pages: 234
                                                              Price: $4750

                                                              Strategic Vision for Global Automated Sample Storage Systems Market Industry Trends

                                                              The global automated sample storage systems market is booming, with a CAGR exceeding 12%! Learn about market drivers, trends, restraints, key players (Thermo Fisher, Hamilton, etc.), and regional growth projections (North America, Europe, Asia-Pacific) in this comprehensive analysis. Discover the future of sample management in pharmaceuticals, biotech, and beyond.

                                                              August 2025
                                                              Base Year: 2024
                                                              No Of Pages: 234
                                                              Price: $4750

                                                              Future Forecasts for Urinary Catheters Market Industry Growth

                                                              The global urinary catheters market is booming, projected to reach $X billion by 2033, driven by rising chronic disease prevalence and technological advancements. Explore market trends, key players (Cook Medical, Coloplast, etc.), and regional growth in this comprehensive analysis. Learn about indwelling, intermittent, and external catheters and their applications in BPH, urinary incontinence, and spinal cord injuries.

                                                              August 2025
                                                              Base Year: 2024
                                                              No Of Pages: 234
                                                              Price: $4750

                                                              Europe Portable X-ray Devices Market Market Analysis and Growth Roadmap

                                                              The European portable X-ray devices market is booming, projected to reach €[Insert projected 2033 value from chart data] by 2033, fueled by digital advancements, rising demand for point-of-care diagnostics, and an aging population. Discover key market trends, leading companies, and regional insights in this comprehensive analysis.

                                                              August 2025
                                                              Base Year: 2024
                                                              No Of Pages: 234
                                                              Price: $4750

                                                              Charting India Neurosurgery Devices Market Growth: CAGR Projections for 2025-2033

                                                              Discover the surging India Neurosurgery Devices Market, projected to reach [estimated 2033 value] million by 2033 with a CAGR of 7.10%. This comprehensive analysis reveals key market drivers, trends, restraints, and leading players like Medtronic and Johnson & Johnson, providing insights into regional market share across North, South, East, and West India. Explore market segmentation by device type and growth projections for strategic planning.

                                                              August 2025
                                                              Base Year: 2024
                                                              No Of Pages: 197
                                                              Price: $3800

                                                              Comprehensive Review of Global Metastatic Cancer Treatment Market Growth Potential

                                                              Discover the latest insights into the booming metastatic cancer treatment market. Explore market size, CAGR, key drivers, treatment types (chemotherapy, immunotherapy, hormone therapy), leading companies (Merck, Johnson & Johnson, Novartis), and regional growth projections (North America, Europe, Asia-Pacific). Learn about future market trends and challenges.

                                                              August 2025
                                                              Base Year: 2024
                                                              No Of Pages: 234
                                                              Price: $4750

                                                              Unlocking the Future of Ultrasound Devices Market in Japan: Growth and Trends 2025-2033

                                                              Discover the booming Japanese ultrasound devices market! Explore market size ($474.18M in 2025), CAGR (6.08%), key drivers (aging population, technological advancements), and leading players. Get insights into regional trends, segmentation by application (cardiology, obstetrics) and technology (3D/4D, HIFU), and future projections to 2033.

                                                              August 2025
                                                              Base Year: 2024
                                                              No Of Pages: 197
                                                              Price: $3800

                                                              Europe Clinical Nutrition Market Unlocking Growth Opportunities: Analysis and Forecast 2025-2033

                                                              The European clinical nutrition market is booming, projected to reach €41.3 billion by 2033 with an 8.35% CAGR. Driven by aging populations and chronic diseases, this market offers lucrative opportunities for players in oral & enteral, parenteral nutrition across malnutrition, metabolic disorders, and more. Explore key trends and leading companies.

                                                              August 2025
                                                              Base Year: 2024
                                                              No Of Pages: 120
                                                              Price: $4750

                                                              Healthcare Quality Management Market 2025-2033 Market Analysis: Trends, Dynamics, and Growth Opportunities

                                                              Discover the booming Healthcare Quality Management market, projected to reach [estimated market size in 2033] by 2033, with a 13.90% CAGR. Explore market trends, key players (Oracle, Microsoft, McKesson), and regional insights in this comprehensive analysis. Learn about cloud-based solutions, risk management tools, and more!

                                                              August 2025
                                                              Base Year: 2024
                                                              No Of Pages: 234
                                                              Price: $4750

                                                              Comprehensive Review of Rapid Microbiology Testing Market Growth Potential

                                                              The rapid microbiology testing market is booming, projected to reach $11.75 billion by 2033, driven by rising infectious diseases and stringent regulations. Explore market trends, key players (Abbott, BD, bioMérieux), and growth opportunities in our in-depth analysis.

                                                              August 2025
                                                              Base Year: 2024
                                                              No Of Pages: 234
                                                              Price: $4750

                                                              GMP Testing Laboratory Industry 2025 to Grow at XX CAGR with XXX Million Market Size: Analysis and Forecasts 2033

                                                              The GMP testing laboratory market is booming, projected to reach \$1.44B by 2025 with a 6.84% CAGR. Discover key drivers, trends, and restraints shaping this industry, including regional breakdowns and leading companies. Learn more about GMP testing services, pharmaceutical testing, and medical device testing.

                                                              August 2025
                                                              Base Year: 2024
                                                              No Of Pages: 234
                                                              Price: $4750

                                                              Electronic Medical Records Industry Strategic Roadmap: Analysis and Forecasts 2025-2033

                                                              The Electronic Medical Records (EMR) market is booming, projected to reach [estimated 2033 value] by 2033, fueled by cloud adoption, AI integration, and telehealth. Discover key market trends, leading companies, and regional insights in this comprehensive analysis.

                                                              August 2025
                                                              Base Year: 2024
                                                              No Of Pages: 234
                                                              Price: $4750

                                                              Consumer Trends Driving Blood Preparation Market Market Growth

                                                              The global blood preparation market is booming, projected to reach $XX million by 2033, with a CAGR of 5.50%. Driven by rising prevalence of blood disorders and technological advancements, this market analysis explores key segments (blood components, anticoagulants, thrombocytosis treatment), regional trends, and leading companies like Daiichi Sankyo and Bayer. Discover insights to understand this dynamic industry.

                                                              August 2025
                                                              Base Year: 2024
                                                              No Of Pages: 234
                                                              Price: $4750

                                                              Perfusion System Market Projected to Grow at XX CAGR: Insights and Forecasts 2025-2033

                                                              Discover the booming perfusion system market! This comprehensive analysis reveals key trends, growth drivers, and market segmentation (NMP, HMP, organ type) from 2019-2033, featuring leading companies and regional insights. Learn about the projected CAGR and lucrative opportunities in this expanding healthcare sector.

                                                              August 2025
                                                              Base Year: 2024
                                                              No Of Pages: 234
                                                              Price: $4750

                                                              US Ophthalmic Devices Industry XX CAGR Growth to Drive Market Size to XXX Million by 2033

                                                              The US ophthalmic devices market is booming, projected to reach $25.4 billion by 2033, driven by an aging population and technological advancements. Learn about key market trends, leading companies like Johnson & Johnson and Alcon, and regional growth opportunities in this comprehensive analysis.

                                                              August 2025
                                                              Base Year: 2024
                                                              No Of Pages: 197
                                                              Price: $3800