
Key Insights
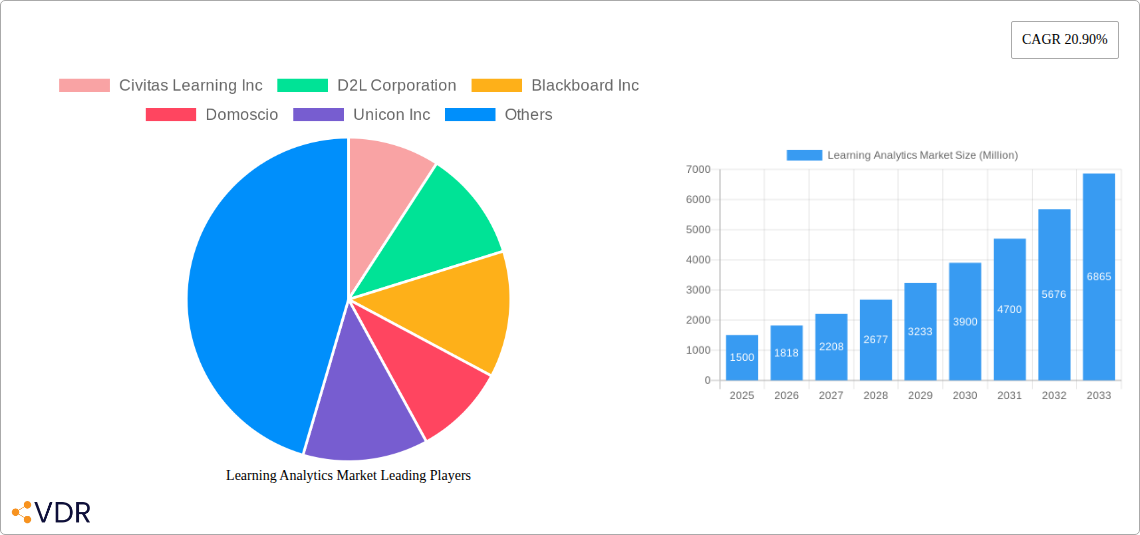
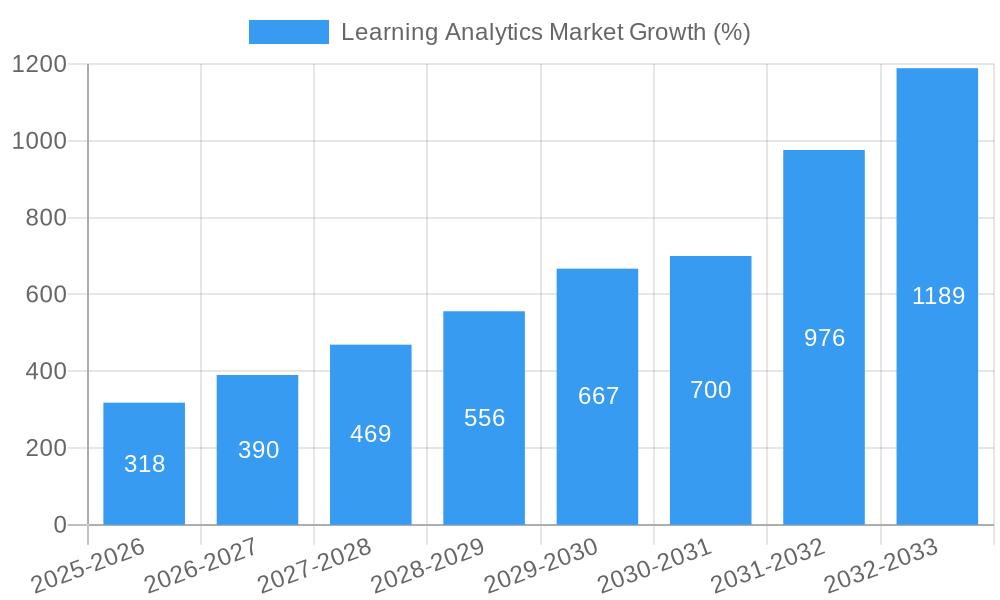
The Learning Analytics market is experiencing robust growth, fueled by a rising demand for data-driven insights to enhance educational outcomes and optimize learning processes. A CAGR of 20.90% from 2019 to 2033 indicates significant market expansion. This growth is driven primarily by the increasing adoption of cloud-based learning analytics platforms, offering scalability, accessibility, and cost-effectiveness compared to on-premise solutions. Furthermore, the rising focus on personalized learning experiences, coupled with the need to improve student success rates and institutional efficiency, is significantly contributing to market expansion. Key segments include software solutions providing data visualization and predictive analytics, cloud-based deployment models offering flexibility, and corporate end-users seeking to improve employee training and development programs. Competition is high, with established players like Blackboard and Instructure alongside emerging innovative companies constantly developing new features and services.
The market segmentation reveals significant opportunities. While the Corporate sector is a substantial revenue generator, the Academia segment is projected to demonstrate significant growth driven by increasing government funding for educational technology and a greater emphasis on evidence-based educational practices. The software segment enjoys a larger market share due to its versatility and potential for integration with existing learning management systems (LMS). However, the services segment is expected to see considerable growth as institutions increasingly require expert consultation and support for implementing and interpreting learning analytics data effectively. Geographic expansion, particularly in rapidly developing economies within the Asia-Pacific region, presents further opportunities for market growth. Restraints include data privacy concerns, the need for robust data infrastructure, and the initial investment costs associated with implementing learning analytics systems.
Learning Analytics Market: A Comprehensive Report (2019-2033)
This comprehensive report provides an in-depth analysis of the Learning Analytics Market, encompassing market dynamics, growth trends, regional dominance, product landscape, key players, and future outlook. The report covers the period from 2019 to 2033, with 2025 as the base and estimated year, and a forecast period spanning 2025-2033. The market is segmented by offerings (Software, Services), deployment mode (On-Premise, Cloud), and end-user (Academia, Corporate). The total market size in 2025 is estimated at XXX Million, projected to reach XXX Million by 2033.
Learning Analytics Market Dynamics & Structure
The Learning Analytics Market is characterized by moderate concentration, with several key players holding significant market share. Technological innovation, particularly in AI and machine learning, is a primary growth driver, while regulatory frameworks concerning data privacy (like GDPR) present both challenges and opportunities. The market sees competition from traditional learning management systems (LMS) and emerging educational technologies. End-user demographics are shifting towards a more digitally native audience, impacting software and service demand. M&A activity has been relatively consistent, with approximately xx deals recorded between 2019 and 2024, indicating consolidation within the sector.
- Market Concentration: Moderately concentrated, with the top 5 players holding approximately xx% of the market share in 2025.
- Technological Innovation: AI-powered personalization, predictive analytics, and adaptive learning platforms are driving market expansion.
- Regulatory Landscape: GDPR and similar regulations influence data handling practices and compliance requirements.
- Competitive Landscape: Competition from established LMS providers and emerging EdTech startups.
- M&A Activity: xx M&A deals between 2019 and 2024, indicating industry consolidation.
Learning Analytics Market Growth Trends & Insights
The Learning Analytics Market experienced robust growth during the historical period (2019-2024), with a CAGR of xx%. This growth is driven by increasing adoption of online and blended learning models, coupled with the demand for personalized learning experiences and improved learning outcomes. Technological disruptions, like the rise of AI-powered analytics and the growing availability of cloud-based solutions, are accelerating market expansion. Consumer behavior is shifting towards a preference for data-driven insights to improve learning effectiveness and optimize educational resources. The market penetration rate is currently at xx% and is expected to reach xx% by 2033.
Dominant Regions, Countries, or Segments in Learning Analytics Market
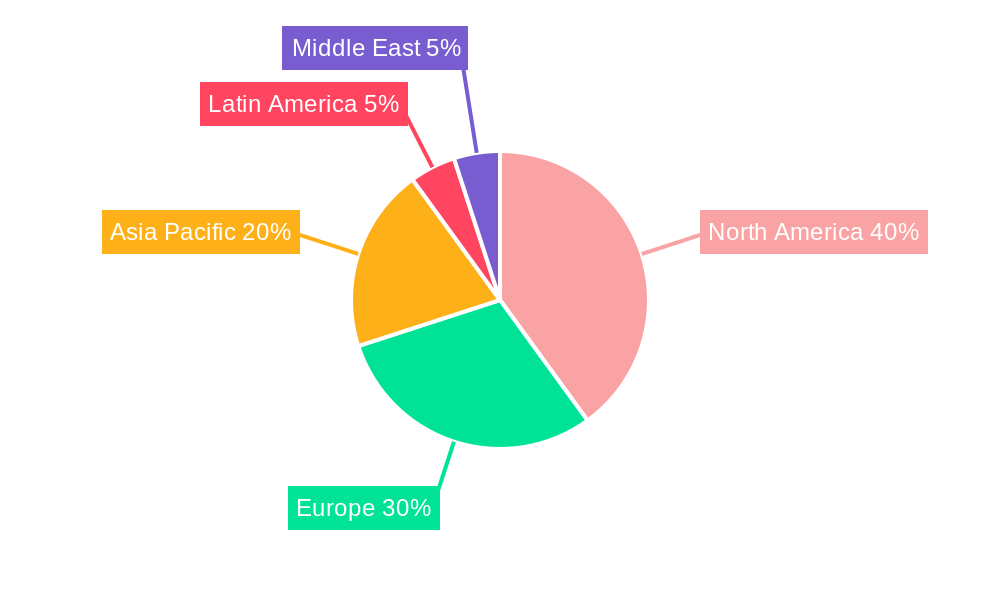
North America currently dominates the Learning Analytics Market, driven by high technological adoption rates, strong research infrastructure, and significant investments in EdTech. Within North America, the United States holds the largest market share. The Cloud deployment mode segment exhibits faster growth than on-premise solutions due to its scalability, cost-effectiveness, and accessibility. The Academia segment constitutes the largest end-user segment, followed by the Corporate sector which shows a high growth potential. The Software segment holds the largest market share due to its widespread use and diverse functionality.
- Key Drivers: Strong technology adoption, robust research infrastructure (North America), and increasing government investments.
- Dominance Factors: High digital literacy, advanced technological infrastructure, and significant investment in educational technology.
- Growth Potential: Emerging economies show significant growth potential in the future. Corporate sector adoption is set for significant growth.
Learning Analytics Market Product Landscape
Learning analytics solutions offer a diverse range of products, from basic data dashboards to advanced AI-powered platforms. These solutions leverage various data sources, including LMS data, student performance metrics, and learning content engagement data to provide actionable insights. Key product innovations focus on improved data visualization, personalized recommendations, and predictive modeling capabilities. The unique selling propositions (USPs) for these products include improved learning outcomes, optimized resource allocation, and enhanced decision-making for educators and administrators. Technological advancements are centered on enhancing the accuracy and predictive power of algorithms.
Key Drivers, Barriers & Challenges in Learning Analytics Market
Key Drivers: The increasing demand for personalized learning, the rising adoption of online learning platforms, and the need for improved student outcomes are driving the market's growth. Government initiatives promoting technology integration in education and increasing investments in educational technology also contribute.
Challenges and Restraints: Data privacy concerns, the complexity of implementing learning analytics systems, and the lack of skilled professionals to interpret and utilize the data are significant challenges. High initial investment costs and the potential for integration issues with existing systems also hinder broader adoption. xx% of organizations reported data privacy as a primary concern in 2024.
Emerging Opportunities in Learning Analytics Market
The integration of learning analytics with other educational technologies, like virtual reality and augmented reality, presents significant opportunities. Expansion into untapped markets, such as K-12 education and informal learning settings, offers considerable growth potential. The development of more sophisticated predictive modeling capabilities, including early identification of at-risk students, is another key opportunity.
Growth Accelerators in the Learning Analytics Market Industry
Strategic partnerships between EdTech companies and educational institutions are accelerating market growth. Technological breakthroughs in AI and machine learning are driving the development of more sophisticated and user-friendly learning analytics platforms. Market expansion into emerging economies and the increasing adoption of cloud-based solutions contribute to long-term growth.
Key Players Shaping the Learning Analytics Market Market
- Civitas Learning Inc
- D2L Corporation
- Blackboard Inc
- Domoscio
- Unicon Inc
- Certica Solutions Inc
- Watershed Systems
- Hobsons Inc
- BrightBytes Inc
- Instructure Inc
Notable Milestones in Learning Analytics Market Sector
- 2020: Increased focus on data privacy regulations impacting data collection practices.
- 2021: Launch of several AI-powered learning analytics platforms by major players.
- 2022: Several mergers and acquisitions within the Learning Analytics sector consolidate market share.
- 2023: Significant investment in research and development of predictive analytics tools.
- 2024: Growing adoption of cloud-based learning analytics solutions.
In-Depth Learning Analytics Market Market Outlook
The Learning Analytics Market is poised for continued strong growth over the forecast period (2025-2033). Technological advancements, increasing adoption rates, and expansion into new markets will drive significant growth. Strategic partnerships and investments in research and development will play a key role in shaping the market’s future. The market presents significant opportunities for both established players and new entrants, particularly those focusing on innovation and addressing emerging challenges like data privacy and integration complexities.
Learning Analytics Market Segmentation
-
1. Offerings
- 1.1. Software
- 1.2. Services
-
2. Deployment Mode
- 2.1. On-Premise
- 2.2. Cloud
-
3. End User
- 3.1. Academia
- 3.2. Corporate
Learning Analytics Market Segmentation By Geography
- 1. North America
- 2. Europe
- 3. Asia Pacific
- 4. Latin America
- 5. Middle East
Learning Analytics Market REPORT HIGHLIGHTS
| Aspects | Details |
|---|---|
| Study Period | 2019-2033 |
| Base Year | 2024 |
| Estimated Year | 2025 |
| Forecast Period | 2025-2033 |
| Historical Period | 2019-2024 |
| Growth Rate | CAGR of 20.90% from 2019-2033 |
| Segmentation |
|
Table of Contents
- 1. Introduction
- 1.1. Research Scope
- 1.2. Market Segmentation
- 1.3. Research Methodology
- 1.4. Definitions and Assumptions
- 2. Executive Summary
- 2.1. Introduction
- 3. Market Dynamics
- 3.1. Introduction
- 3.2. Market Drivers
- 3.2.1. ; Increasing Focus on Improving Student Grades/Retention; Increase in Availability of Cloud-based Services and MOOCs
- 3.3. Market Restrains
- 3.3.1. ; Data Privacy Concerns and Lack of internet Infrastructure in Emerging Nations
- 3.4. Market Trends
- 3.4.1. Increasing Learning & Development Budget towards Online Learning is Fueling the Market Growth
- 4. Market Factor Analysis
- 4.1. Porters Five Forces
- 4.2. Supply/Value Chain
- 4.3. PESTEL analysis
- 4.4. Market Entropy
- 4.5. Patent/Trademark Analysis
- 5. Global Learning Analytics Market Analysis, Insights and Forecast, 2019-2031
- 5.1. Market Analysis, Insights and Forecast - by Offerings
- 5.1.1. Software
- 5.1.2. Services
- 5.2. Market Analysis, Insights and Forecast - by Deployment Mode
- 5.2.1. On-Premise
- 5.2.2. Cloud
- 5.3. Market Analysis, Insights and Forecast - by End User
- 5.3.1. Academia
- 5.3.2. Corporate
- 5.4. Market Analysis, Insights and Forecast - by Region
- 5.4.1. North America
- 5.4.2. Europe
- 5.4.3. Asia Pacific
- 5.4.4. Latin America
- 5.4.5. Middle East
- 5.1. Market Analysis, Insights and Forecast - by Offerings
- 6. North America Learning Analytics Market Analysis, Insights and Forecast, 2019-2031
- 6.1. Market Analysis, Insights and Forecast - by Offerings
- 6.1.1. Software
- 6.1.2. Services
- 6.2. Market Analysis, Insights and Forecast - by Deployment Mode
- 6.2.1. On-Premise
- 6.2.2. Cloud
- 6.3. Market Analysis, Insights and Forecast - by End User
- 6.3.1. Academia
- 6.3.2. Corporate
- 6.1. Market Analysis, Insights and Forecast - by Offerings
- 7. Europe Learning Analytics Market Analysis, Insights and Forecast, 2019-2031
- 7.1. Market Analysis, Insights and Forecast - by Offerings
- 7.1.1. Software
- 7.1.2. Services
- 7.2. Market Analysis, Insights and Forecast - by Deployment Mode
- 7.2.1. On-Premise
- 7.2.2. Cloud
- 7.3. Market Analysis, Insights and Forecast - by End User
- 7.3.1. Academia
- 7.3.2. Corporate
- 7.1. Market Analysis, Insights and Forecast - by Offerings
- 8. Asia Pacific Learning Analytics Market Analysis, Insights and Forecast, 2019-2031
- 8.1. Market Analysis, Insights and Forecast - by Offerings
- 8.1.1. Software
- 8.1.2. Services
- 8.2. Market Analysis, Insights and Forecast - by Deployment Mode
- 8.2.1. On-Premise
- 8.2.2. Cloud
- 8.3. Market Analysis, Insights and Forecast - by End User
- 8.3.1. Academia
- 8.3.2. Corporate
- 8.1. Market Analysis, Insights and Forecast - by Offerings
- 9. Latin America Learning Analytics Market Analysis, Insights and Forecast, 2019-2031
- 9.1. Market Analysis, Insights and Forecast - by Offerings
- 9.1.1. Software
- 9.1.2. Services
- 9.2. Market Analysis, Insights and Forecast - by Deployment Mode
- 9.2.1. On-Premise
- 9.2.2. Cloud
- 9.3. Market Analysis, Insights and Forecast - by End User
- 9.3.1. Academia
- 9.3.2. Corporate
- 9.1. Market Analysis, Insights and Forecast - by Offerings
- 10. Middle East Learning Analytics Market Analysis, Insights and Forecast, 2019-2031
- 10.1. Market Analysis, Insights and Forecast - by Offerings
- 10.1.1. Software
- 10.1.2. Services
- 10.2. Market Analysis, Insights and Forecast - by Deployment Mode
- 10.2.1. On-Premise
- 10.2.2. Cloud
- 10.3. Market Analysis, Insights and Forecast - by End User
- 10.3.1. Academia
- 10.3.2. Corporate
- 10.1. Market Analysis, Insights and Forecast - by Offerings
- 11. North America Learning Analytics Market Analysis, Insights and Forecast, 2019-2031
- 11.1. Market Analysis, Insights and Forecast - By Country/Sub-region
- 11.1.1.
- 12. Europe Learning Analytics Market Analysis, Insights and Forecast, 2019-2031
- 12.1. Market Analysis, Insights and Forecast - By Country/Sub-region
- 12.1.1.
- 13. Asia Pacific Learning Analytics Market Analysis, Insights and Forecast, 2019-2031
- 13.1. Market Analysis, Insights and Forecast - By Country/Sub-region
- 13.1.1.
- 14. Latin America Learning Analytics Market Analysis, Insights and Forecast, 2019-2031
- 14.1. Market Analysis, Insights and Forecast - By Country/Sub-region
- 14.1.1.
- 15. Middle East Learning Analytics Market Analysis, Insights and Forecast, 2019-2031
- 15.1. Market Analysis, Insights and Forecast - By Country/Sub-region
- 15.1.1.
- 16. Competitive Analysis
- 16.1. Global Market Share Analysis 2024
- 16.2. Company Profiles
- 16.2.1 Civitas Learning Inc
- 16.2.1.1. Overview
- 16.2.1.2. Products
- 16.2.1.3. SWOT Analysis
- 16.2.1.4. Recent Developments
- 16.2.1.5. Financials (Based on Availability)
- 16.2.2 D2L Corporation
- 16.2.2.1. Overview
- 16.2.2.2. Products
- 16.2.2.3. SWOT Analysis
- 16.2.2.4. Recent Developments
- 16.2.2.5. Financials (Based on Availability)
- 16.2.3 Blackboard Inc
- 16.2.3.1. Overview
- 16.2.3.2. Products
- 16.2.3.3. SWOT Analysis
- 16.2.3.4. Recent Developments
- 16.2.3.5. Financials (Based on Availability)
- 16.2.4 Domoscio
- 16.2.4.1. Overview
- 16.2.4.2. Products
- 16.2.4.3. SWOT Analysis
- 16.2.4.4. Recent Developments
- 16.2.4.5. Financials (Based on Availability)
- 16.2.5 Unicon Inc
- 16.2.5.1. Overview
- 16.2.5.2. Products
- 16.2.5.3. SWOT Analysis
- 16.2.5.4. Recent Developments
- 16.2.5.5. Financials (Based on Availability)
- 16.2.6 Certica Solutions Inc
- 16.2.6.1. Overview
- 16.2.6.2. Products
- 16.2.6.3. SWOT Analysis
- 16.2.6.4. Recent Developments
- 16.2.6.5. Financials (Based on Availability)
- 16.2.7 Watershed Systems
- 16.2.7.1. Overview
- 16.2.7.2. Products
- 16.2.7.3. SWOT Analysis
- 16.2.7.4. Recent Developments
- 16.2.7.5. Financials (Based on Availability)
- 16.2.8 Hobsons Inc
- 16.2.8.1. Overview
- 16.2.8.2. Products
- 16.2.8.3. SWOT Analysis
- 16.2.8.4. Recent Developments
- 16.2.8.5. Financials (Based on Availability)
- 16.2.9 BrightBytes Inc
- 16.2.9.1. Overview
- 16.2.9.2. Products
- 16.2.9.3. SWOT Analysis
- 16.2.9.4. Recent Developments
- 16.2.9.5. Financials (Based on Availability)
- 16.2.10 Instructure Inc
- 16.2.10.1. Overview
- 16.2.10.2. Products
- 16.2.10.3. SWOT Analysis
- 16.2.10.4. Recent Developments
- 16.2.10.5. Financials (Based on Availability)
- 16.2.1 Civitas Learning Inc
List of Figures
- Figure 1: Global Learning Analytics Market Revenue Breakdown (Million, %) by Region 2024 & 2032
- Figure 2: North America Learning Analytics Market Revenue (Million), by Country 2024 & 2032
- Figure 3: North America Learning Analytics Market Revenue Share (%), by Country 2024 & 2032
- Figure 4: Europe Learning Analytics Market Revenue (Million), by Country 2024 & 2032
- Figure 5: Europe Learning Analytics Market Revenue Share (%), by Country 2024 & 2032
- Figure 6: Asia Pacific Learning Analytics Market Revenue (Million), by Country 2024 & 2032
- Figure 7: Asia Pacific Learning Analytics Market Revenue Share (%), by Country 2024 & 2032
- Figure 8: Latin America Learning Analytics Market Revenue (Million), by Country 2024 & 2032
- Figure 9: Latin America Learning Analytics Market Revenue Share (%), by Country 2024 & 2032
- Figure 10: Middle East Learning Analytics Market Revenue (Million), by Country 2024 & 2032
- Figure 11: Middle East Learning Analytics Market Revenue Share (%), by Country 2024 & 2032
- Figure 12: North America Learning Analytics Market Revenue (Million), by Offerings 2024 & 2032
- Figure 13: North America Learning Analytics Market Revenue Share (%), by Offerings 2024 & 2032
- Figure 14: North America Learning Analytics Market Revenue (Million), by Deployment Mode 2024 & 2032
- Figure 15: North America Learning Analytics Market Revenue Share (%), by Deployment Mode 2024 & 2032
- Figure 16: North America Learning Analytics Market Revenue (Million), by End User 2024 & 2032
- Figure 17: North America Learning Analytics Market Revenue Share (%), by End User 2024 & 2032
- Figure 18: North America Learning Analytics Market Revenue (Million), by Country 2024 & 2032
- Figure 19: North America Learning Analytics Market Revenue Share (%), by Country 2024 & 2032
- Figure 20: Europe Learning Analytics Market Revenue (Million), by Offerings 2024 & 2032
- Figure 21: Europe Learning Analytics Market Revenue Share (%), by Offerings 2024 & 2032
- Figure 22: Europe Learning Analytics Market Revenue (Million), by Deployment Mode 2024 & 2032
- Figure 23: Europe Learning Analytics Market Revenue Share (%), by Deployment Mode 2024 & 2032
- Figure 24: Europe Learning Analytics Market Revenue (Million), by End User 2024 & 2032
- Figure 25: Europe Learning Analytics Market Revenue Share (%), by End User 2024 & 2032
- Figure 26: Europe Learning Analytics Market Revenue (Million), by Country 2024 & 2032
- Figure 27: Europe Learning Analytics Market Revenue Share (%), by Country 2024 & 2032
- Figure 28: Asia Pacific Learning Analytics Market Revenue (Million), by Offerings 2024 & 2032
- Figure 29: Asia Pacific Learning Analytics Market Revenue Share (%), by Offerings 2024 & 2032
- Figure 30: Asia Pacific Learning Analytics Market Revenue (Million), by Deployment Mode 2024 & 2032
- Figure 31: Asia Pacific Learning Analytics Market Revenue Share (%), by Deployment Mode 2024 & 2032
- Figure 32: Asia Pacific Learning Analytics Market Revenue (Million), by End User 2024 & 2032
- Figure 33: Asia Pacific Learning Analytics Market Revenue Share (%), by End User 2024 & 2032
- Figure 34: Asia Pacific Learning Analytics Market Revenue (Million), by Country 2024 & 2032
- Figure 35: Asia Pacific Learning Analytics Market Revenue Share (%), by Country 2024 & 2032
- Figure 36: Latin America Learning Analytics Market Revenue (Million), by Offerings 2024 & 2032
- Figure 37: Latin America Learning Analytics Market Revenue Share (%), by Offerings 2024 & 2032
- Figure 38: Latin America Learning Analytics Market Revenue (Million), by Deployment Mode 2024 & 2032
- Figure 39: Latin America Learning Analytics Market Revenue Share (%), by Deployment Mode 2024 & 2032
- Figure 40: Latin America Learning Analytics Market Revenue (Million), by End User 2024 & 2032
- Figure 41: Latin America Learning Analytics Market Revenue Share (%), by End User 2024 & 2032
- Figure 42: Latin America Learning Analytics Market Revenue (Million), by Country 2024 & 2032
- Figure 43: Latin America Learning Analytics Market Revenue Share (%), by Country 2024 & 2032
- Figure 44: Middle East Learning Analytics Market Revenue (Million), by Offerings 2024 & 2032
- Figure 45: Middle East Learning Analytics Market Revenue Share (%), by Offerings 2024 & 2032
- Figure 46: Middle East Learning Analytics Market Revenue (Million), by Deployment Mode 2024 & 2032
- Figure 47: Middle East Learning Analytics Market Revenue Share (%), by Deployment Mode 2024 & 2032
- Figure 48: Middle East Learning Analytics Market Revenue (Million), by End User 2024 & 2032
- Figure 49: Middle East Learning Analytics Market Revenue Share (%), by End User 2024 & 2032
- Figure 50: Middle East Learning Analytics Market Revenue (Million), by Country 2024 & 2032
- Figure 51: Middle East Learning Analytics Market Revenue Share (%), by Country 2024 & 2032
List of Tables
- Table 1: Global Learning Analytics Market Revenue Million Forecast, by Region 2019 & 2032
- Table 2: Global Learning Analytics Market Revenue Million Forecast, by Offerings 2019 & 2032
- Table 3: Global Learning Analytics Market Revenue Million Forecast, by Deployment Mode 2019 & 2032
- Table 4: Global Learning Analytics Market Revenue Million Forecast, by End User 2019 & 2032
- Table 5: Global Learning Analytics Market Revenue Million Forecast, by Region 2019 & 2032
- Table 6: Global Learning Analytics Market Revenue Million Forecast, by Country 2019 & 2032
- Table 7: Learning Analytics Market Revenue (Million) Forecast, by Application 2019 & 2032
- Table 8: Global Learning Analytics Market Revenue Million Forecast, by Country 2019 & 2032
- Table 9: Learning Analytics Market Revenue (Million) Forecast, by Application 2019 & 2032
- Table 10: Global Learning Analytics Market Revenue Million Forecast, by Country 2019 & 2032
- Table 11: Learning Analytics Market Revenue (Million) Forecast, by Application 2019 & 2032
- Table 12: Global Learning Analytics Market Revenue Million Forecast, by Country 2019 & 2032
- Table 13: Learning Analytics Market Revenue (Million) Forecast, by Application 2019 & 2032
- Table 14: Global Learning Analytics Market Revenue Million Forecast, by Country 2019 & 2032
- Table 15: Learning Analytics Market Revenue (Million) Forecast, by Application 2019 & 2032
- Table 16: Global Learning Analytics Market Revenue Million Forecast, by Offerings 2019 & 2032
- Table 17: Global Learning Analytics Market Revenue Million Forecast, by Deployment Mode 2019 & 2032
- Table 18: Global Learning Analytics Market Revenue Million Forecast, by End User 2019 & 2032
- Table 19: Global Learning Analytics Market Revenue Million Forecast, by Country 2019 & 2032
- Table 20: Global Learning Analytics Market Revenue Million Forecast, by Offerings 2019 & 2032
- Table 21: Global Learning Analytics Market Revenue Million Forecast, by Deployment Mode 2019 & 2032
- Table 22: Global Learning Analytics Market Revenue Million Forecast, by End User 2019 & 2032
- Table 23: Global Learning Analytics Market Revenue Million Forecast, by Country 2019 & 2032
- Table 24: Global Learning Analytics Market Revenue Million Forecast, by Offerings 2019 & 2032
- Table 25: Global Learning Analytics Market Revenue Million Forecast, by Deployment Mode 2019 & 2032
- Table 26: Global Learning Analytics Market Revenue Million Forecast, by End User 2019 & 2032
- Table 27: Global Learning Analytics Market Revenue Million Forecast, by Country 2019 & 2032
- Table 28: Global Learning Analytics Market Revenue Million Forecast, by Offerings 2019 & 2032
- Table 29: Global Learning Analytics Market Revenue Million Forecast, by Deployment Mode 2019 & 2032
- Table 30: Global Learning Analytics Market Revenue Million Forecast, by End User 2019 & 2032
- Table 31: Global Learning Analytics Market Revenue Million Forecast, by Country 2019 & 2032
- Table 32: Global Learning Analytics Market Revenue Million Forecast, by Offerings 2019 & 2032
- Table 33: Global Learning Analytics Market Revenue Million Forecast, by Deployment Mode 2019 & 2032
- Table 34: Global Learning Analytics Market Revenue Million Forecast, by End User 2019 & 2032
- Table 35: Global Learning Analytics Market Revenue Million Forecast, by Country 2019 & 2032
Frequently Asked Questions
1. What is the projected Compound Annual Growth Rate (CAGR) of the Learning Analytics Market?
The projected CAGR is approximately 20.90%.
2. Which companies are prominent players in the Learning Analytics Market?
Key companies in the market include Civitas Learning Inc, D2L Corporation, Blackboard Inc, Domoscio, Unicon Inc, Certica Solutions Inc , Watershed Systems, Hobsons Inc, BrightBytes Inc, Instructure Inc.
3. What are the main segments of the Learning Analytics Market?
The market segments include Offerings, Deployment Mode, End User.
4. Can you provide details about the market size?
The market size is estimated to be USD XX Million as of 2022.
5. What are some drivers contributing to market growth?
; Increasing Focus on Improving Student Grades/Retention; Increase in Availability of Cloud-based Services and MOOCs.
6. What are the notable trends driving market growth?
Increasing Learning & Development Budget towards Online Learning is Fueling the Market Growth.
7. Are there any restraints impacting market growth?
; Data Privacy Concerns and Lack of internet Infrastructure in Emerging Nations.
8. Can you provide examples of recent developments in the market?
N/A
9. What pricing options are available for accessing the report?
Pricing options include single-user, multi-user, and enterprise licenses priced at USD 4750, USD 5250, and USD 8750 respectively.
10. Is the market size provided in terms of value or volume?
The market size is provided in terms of value, measured in Million.
11. Are there any specific market keywords associated with the report?
Yes, the market keyword associated with the report is "Learning Analytics Market," which aids in identifying and referencing the specific market segment covered.
12. How do I determine which pricing option suits my needs best?
The pricing options vary based on user requirements and access needs. Individual users may opt for single-user licenses, while businesses requiring broader access may choose multi-user or enterprise licenses for cost-effective access to the report.
13. Are there any additional resources or data provided in the Learning Analytics Market report?
While the report offers comprehensive insights, it's advisable to review the specific contents or supplementary materials provided to ascertain if additional resources or data are available.
14. How can I stay updated on further developments or reports in the Learning Analytics Market?
To stay informed about further developments, trends, and reports in the Learning Analytics Market, consider subscribing to industry newsletters, following relevant companies and organizations, or regularly checking reputable industry news sources and publications.
Methodology
Step 1 - Identification of Relevant Samples Size from Population Database


Step 2 - Approaches for Defining Global Market Size (Value, Volume* & Price*)

Note*: In applicable scenarios
Step 3 - Data Sources
Primary Research
- Web Analytics
- Survey Reports
- Research Institute
- Latest Research Reports
- Opinion Leaders
Secondary Research
- Annual Reports
- White Paper
- Latest Press Release
- Industry Association
- Paid Database
- Investor Presentations

Step 4 - Data Triangulation
Involves using different sources of information in order to increase the validity of a study
These sources are likely to be stakeholders in a program - participants, other researchers, program staff, other community members, and so on.
Then we put all data in single framework & apply various statistical tools to find out the dynamic on the market.
During the analysis stage, feedback from the stakeholder groups would be compared to determine areas of agreement as well as areas of divergence


