
Key Insights
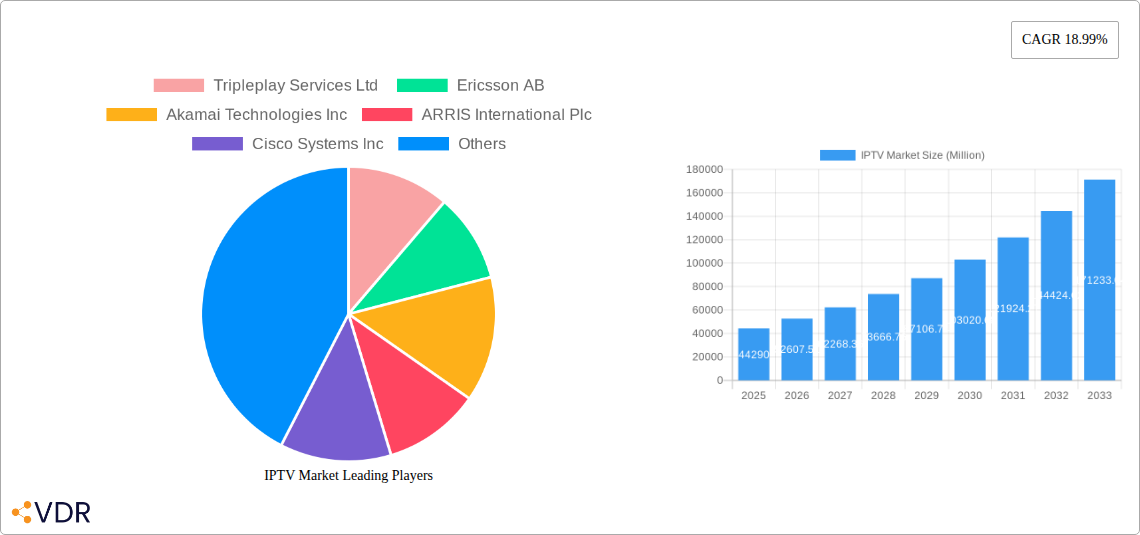
The IPTV market, valued at $44.29 billion in 2025, is experiencing robust growth, projected to expand at a Compound Annual Growth Rate (CAGR) of 18.99% from 2025 to 2033. This surge is driven by several key factors. Increasing broadband penetration globally, particularly in developing economies, fuels the adoption of IPTV services offering superior video quality and interactive features compared to traditional cable television. Furthermore, the rising demand for on-demand content, coupled with the convenience and affordability of subscription-based IPTV packages, is significantly boosting market expansion. Technological advancements such as the implementation of 4K and 8K ultra-high-definition video streaming, and the integration of smart home features within IPTV platforms, further enhance the user experience and drive market demand. Competition among major players like Tripleplay Services Ltd, Ericsson AB, and Cisco Systems Inc, is fostering innovation and pushing prices down, making IPTV accessible to a broader consumer base. The market segmentation by type, encompassing hardware and service components, reveals a dynamic interplay between technological advancements and service delivery models. Hardware advancements drive the need for upgraded set-top boxes and infrastructure, whereas the service segment emphasizes competitive pricing strategies and tailored content packages to attract and retain customers.
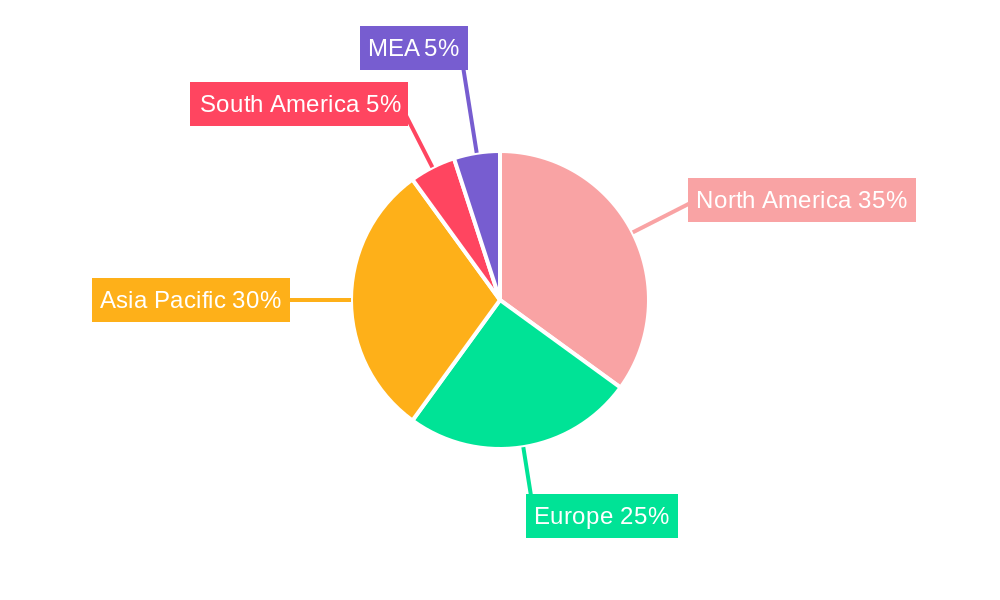
The geographical distribution of the IPTV market showcases significant regional variations. North America, particularly the United States, currently holds a dominant market share, driven by high internet penetration and established IPTV infrastructure. However, rapid growth is anticipated in Asia-Pacific regions like China and India, propelled by burgeoning internet usage and a large, young, tech-savvy population. Europe, while a mature market, continues to witness steady growth, supported by robust broadband infrastructure and increasing adoption of bundled services. The competitive landscape remains intense, with established telecom operators and technology providers vying for market dominance through strategic partnerships, mergers and acquisitions, and continuous innovation in service offerings. The future trajectory of the IPTV market hinges on the ongoing advancements in streaming technology, the expansion of 5G networks, and the continued evolution of consumer preferences towards personalized and interactive viewing experiences.
IPTV Market Report: A Comprehensive Analysis (2019-2033)
This in-depth report provides a comprehensive analysis of the IPTV market, encompassing market dynamics, growth trends, regional dominance, product landscape, key players, and future outlook. The study period covers 2019-2033, with 2025 as the base and estimated year, and a forecast period of 2025-2033. The report is designed for industry professionals, investors, and strategists seeking a granular understanding of this rapidly evolving market. Parent market analysis considers the broader telecommunications and entertainment sectors, while the child market focuses specifically on IPTV hardware and services.
IPTV Market Dynamics & Structure
This section analyzes the IPTV market's competitive landscape, focusing on market concentration, technological advancements, regulatory influences, and market trends. We delve into the impact of mergers and acquisitions (M&A) activity and assess the influence of substitute products. The analysis will explore end-user demographics and their evolving preferences, providing a complete picture of the market’s structure and its driving forces.
- Market Concentration: xx% market share held by top 5 players (2024). Analysis of market concentration ratio (CR5, CR10).
- Technological Innovation Drivers: Advancements in broadband infrastructure, streaming technologies (e.g., adaptive bitrate streaming), and 4K/8K video delivery.
- Regulatory Frameworks: Impact of government policies on spectrum allocation, content regulations, and licensing requirements.
- Competitive Product Substitutes: Analysis of competitive pressure from streaming services (Netflix, Hulu, etc.) and traditional cable television.
- End-User Demographics: Segmentation of user base by age, income, location and usage patterns (e.g., cord-cutting trends).
- M&A Trends: Analysis of M&A activity in the IPTV market from 2019-2024, including deal volumes (xx deals) and average deal size (xx Million units). Qualitative assessment of integration challenges and synergistic effects.
IPTV Market Growth Trends & Insights
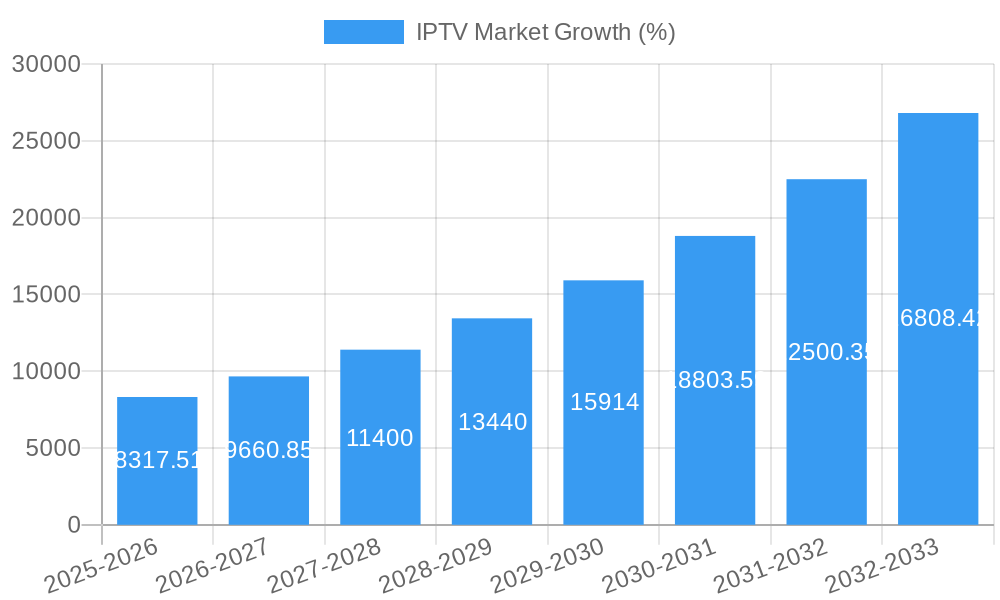
This section details the IPTV market's growth trajectory, encompassing market size evolution, adoption rates, technological disruptions, and shifts in consumer behavior. We analyze the Compound Annual Growth Rate (CAGR) and market penetration rates across different regions and segments. Key technological disruptions are discussed along with their influence on market dynamics and consumer choices. The analysis will integrate quantitative and qualitative findings to provide a comprehensive picture of market trends. Detailed analyses are provided, incorporating insights on CAGR and market penetration rates over the forecast period. Market size projections are also provided for 2033 (xx Million units).
Dominant Regions, Countries, or Segments in IPTV Market
This section identifies the leading regions, countries, or segments (Hardware and Service) driving IPTV market growth. Analysis will focus on factors contributing to the dominance of specific regions or segments, such as infrastructure development, government policies, and economic conditions. The analysis will include market share data and projections for future growth potential.
- Leading Region/Country: [Region/Country Name], driven by [Key Driver 1, Key Driver 2, etc.]. Market share (xx%) in 2024, projected to reach xx% by 2033.
- By Type: Hardware: Strong growth driven by [factors] . Market size (xx Million units) in 2024, projected to (xx Million units) by 2033.
- By Type: Service: High demand for [service type], fueling market expansion. Market size (xx Million units) in 2024, projected to (xx Million units) by 2033.
- Key Drivers: [Bullet points highlighting specific economic policies, infrastructure investments, and consumer preferences contributing to regional/segmental dominance].
IPTV Market Product Landscape
This section details product innovations, applications, and performance metrics within the IPTV market. This includes analysis of unique selling propositions (USPs), technological advancements, and the competitive landscape among different product offerings. The report analyzes the latest advancements in hardware and software solutions, highlighting key features and benefits for consumers and service providers.
Key Drivers, Barriers & Challenges in IPTV Market
This section identifies and analyzes the key factors driving and hindering the growth of the IPTV market.
Key Drivers: The IPTV market is propelled by increasing broadband penetration, rising demand for high-quality video content, and the shift towards digital entertainment. Government initiatives promoting digitalization are also significant drivers.
Key Challenges: Competition from other streaming services, high initial investment costs for infrastructure development, and regulatory hurdles pose significant challenges to market expansion. Furthermore, ensuring cybersecurity and content protection remains a crucial concern. Supply chain disruptions (quantifiable impact: xx% reduction in production in 2022) pose an additional challenge.
Emerging Opportunities in IPTV Market
Emerging opportunities include expansion into underserved markets (e.g., rural areas), development of innovative applications such as interactive TV and personalized content, and the integration of IPTV with other smart home technologies. The increasing adoption of 5G networks also presents significant opportunities for enhanced IPTV service delivery.
Growth Accelerators in the IPTV Market Industry
Long-term growth is accelerated by technological advancements (e.g., improved compression technologies, enhanced streaming protocols), strategic partnerships between content providers and service providers, and market expansion strategies into new geographic regions. The adoption of advanced analytics to personalize content and improve service delivery further accelerates growth.
Key Players Shaping the IPTV Market Market
- Tripleplay Services Ltd
- Ericsson AB
- Akamai Technologies Inc
- ARRIS International Plc
- Cisco Systems Inc
- Sterlite Tech
- Moftak Solutions
- Verizon Communications
- Huawei Technologies Co Ltd
- AT&T Inc
Notable Milestones in IPTV Market Sector
- March 2023: BSNL launches IPTV services in Tamil Nadu, partnering with E2 Info Solutions. This significantly expands IPTV reach in India.
- March 2023: mwaretv partners with a US content provider, offering a comprehensive IPTV service package to ISPs and multi-dwelling organizations. This strengthens content offerings in the US market.
In-Depth IPTV Market Market Outlook
The IPTV market exhibits significant growth potential driven by continuous technological advancements, increasing demand for high-quality video content, and the expansion of broadband infrastructure. Strategic partnerships and targeted marketing initiatives will play a crucial role in maximizing market penetration and driving revenue growth over the forecast period. The market is poised for substantial expansion, with opportunities in emerging economies and the integration of IPTV with other smart home technologies.
IPTV Market Segmentation
-
1. Type
- 1.1. Hardware
- 1.2. Service
-
2. End Use
- 2.1. Residential
- 2.2. Commercial
- 2.3. Government
IPTV Market Segmentation By Geography
- 1. North America
- 2. Europe
- 3. Asia Pacific
- 4. Latin America
- 5. Middle East
IPTV Market REPORT HIGHLIGHTS
| Aspects | Details |
|---|---|
| Study Period | 2019-2033 |
| Base Year | 2024 |
| Estimated Year | 2025 |
| Forecast Period | 2025-2033 |
| Historical Period | 2019-2024 |
| Growth Rate | CAGR of 18.99% from 2019-2033 |
| Segmentation |
|
Table of Contents
- 1. Introduction
- 1.1. Research Scope
- 1.2. Market Segmentation
- 1.3. Research Methodology
- 1.4. Definitions and Assumptions
- 2. Executive Summary
- 2.1. Introduction
- 3. Market Dynamics
- 3.1. Introduction
- 3.2. Market Drivers
- 3.2.1. Demand for High-Definition Channels and Video On-Demand; Interactive Services Packaged Along with IPTV Services; Favorable Government Initiatives
- 3.3. Market Restrains
- 3.3.1. Competition from Cable TV and Satellite TV Operators; Lack of Infrastructure in Developing Regions to Offer Delay and Jitter-free Service
- 3.4. Market Trends
- 3.4.1. Hardware segment to acquire major market share
- 4. Market Factor Analysis
- 4.1. Porters Five Forces
- 4.2. Supply/Value Chain
- 4.3. PESTEL analysis
- 4.4. Market Entropy
- 4.5. Patent/Trademark Analysis
- 5. Global IPTV Market Analysis, Insights and Forecast, 2019-2031
- 5.1. Market Analysis, Insights and Forecast - by Type
- 5.1.1. Hardware
- 5.1.2. Service
- 5.2. Market Analysis, Insights and Forecast - by End Use
- 5.2.1. Residential
- 5.2.2. Commercial
- 5.2.3. Government
- 5.3. Market Analysis, Insights and Forecast - by Region
- 5.3.1. North America
- 5.3.2. Europe
- 5.3.3. Asia Pacific
- 5.3.4. Latin America
- 5.3.5. Middle East
- 5.1. Market Analysis, Insights and Forecast - by Type
- 6. North America IPTV Market Analysis, Insights and Forecast, 2019-2031
- 6.1. Market Analysis, Insights and Forecast - by Type
- 6.1.1. Hardware
- 6.1.2. Service
- 6.2. Market Analysis, Insights and Forecast - by End Use
- 6.2.1. Residential
- 6.2.2. Commercial
- 6.2.3. Government
- 6.1. Market Analysis, Insights and Forecast - by Type
- 7. Europe IPTV Market Analysis, Insights and Forecast, 2019-2031
- 7.1. Market Analysis, Insights and Forecast - by Type
- 7.1.1. Hardware
- 7.1.2. Service
- 7.2. Market Analysis, Insights and Forecast - by End Use
- 7.2.1. Residential
- 7.2.2. Commercial
- 7.2.3. Government
- 7.1. Market Analysis, Insights and Forecast - by Type
- 8. Asia Pacific IPTV Market Analysis, Insights and Forecast, 2019-2031
- 8.1. Market Analysis, Insights and Forecast - by Type
- 8.1.1. Hardware
- 8.1.2. Service
- 8.2. Market Analysis, Insights and Forecast - by End Use
- 8.2.1. Residential
- 8.2.2. Commercial
- 8.2.3. Government
- 8.1. Market Analysis, Insights and Forecast - by Type
- 9. Latin America IPTV Market Analysis, Insights and Forecast, 2019-2031
- 9.1. Market Analysis, Insights and Forecast - by Type
- 9.1.1. Hardware
- 9.1.2. Service
- 9.2. Market Analysis, Insights and Forecast - by End Use
- 9.2.1. Residential
- 9.2.2. Commercial
- 9.2.3. Government
- 9.1. Market Analysis, Insights and Forecast - by Type
- 10. Middle East IPTV Market Analysis, Insights and Forecast, 2019-2031
- 10.1. Market Analysis, Insights and Forecast - by Type
- 10.1.1. Hardware
- 10.1.2. Service
- 10.2. Market Analysis, Insights and Forecast - by End Use
- 10.2.1. Residential
- 10.2.2. Commercial
- 10.2.3. Government
- 10.1. Market Analysis, Insights and Forecast - by Type
- 11. North America IPTV Market Analysis, Insights and Forecast, 2019-2031
- 11.1. Market Analysis, Insights and Forecast - By Country/Sub-region
- 11.1.1 United States
- 11.1.2 Canada
- 11.1.3 Mexico
- 12. Europe IPTV Market Analysis, Insights and Forecast, 2019-2031
- 12.1. Market Analysis, Insights and Forecast - By Country/Sub-region
- 12.1.1 Germany
- 12.1.2 United Kingdom
- 12.1.3 France
- 12.1.4 Spain
- 12.1.5 Italy
- 12.1.6 Spain
- 12.1.7 Belgium
- 12.1.8 Netherland
- 12.1.9 Nordics
- 12.1.10 Rest of Europe
- 13. Asia Pacific IPTV Market Analysis, Insights and Forecast, 2019-2031
- 13.1. Market Analysis, Insights and Forecast - By Country/Sub-region
- 13.1.1 China
- 13.1.2 Japan
- 13.1.3 India
- 13.1.4 South Korea
- 13.1.5 Southeast Asia
- 13.1.6 Australia
- 13.1.7 Indonesia
- 13.1.8 Phillipes
- 13.1.9 Singapore
- 13.1.10 Thailandc
- 13.1.11 Rest of Asia Pacific
- 14. South America IPTV Market Analysis, Insights and Forecast, 2019-2031
- 14.1. Market Analysis, Insights and Forecast - By Country/Sub-region
- 14.1.1 Brazil
- 14.1.2 Argentina
- 14.1.3 Peru
- 14.1.4 Chile
- 14.1.5 Colombia
- 14.1.6 Ecuador
- 14.1.7 Venezuela
- 14.1.8 Rest of South America
- 15. North America IPTV Market Analysis, Insights and Forecast, 2019-2031
- 15.1. Market Analysis, Insights and Forecast - By Country/Sub-region
- 15.1.1 United States
- 15.1.2 Canada
- 15.1.3 Mexico
- 16. MEA IPTV Market Analysis, Insights and Forecast, 2019-2031
- 16.1. Market Analysis, Insights and Forecast - By Country/Sub-region
- 16.1.1 United Arab Emirates
- 16.1.2 Saudi Arabia
- 16.1.3 South Africa
- 16.1.4 Rest of Middle East and Africa
- 17. Competitive Analysis
- 17.1. Global Market Share Analysis 2024
- 17.2. Company Profiles
- 17.2.1 Tripleplay Services Ltd
- 17.2.1.1. Overview
- 17.2.1.2. Products
- 17.2.1.3. SWOT Analysis
- 17.2.1.4. Recent Developments
- 17.2.1.5. Financials (Based on Availability)
- 17.2.2 Ericsson AB
- 17.2.2.1. Overview
- 17.2.2.2. Products
- 17.2.2.3. SWOT Analysis
- 17.2.2.4. Recent Developments
- 17.2.2.5. Financials (Based on Availability)
- 17.2.3 Akamai Technologies Inc
- 17.2.3.1. Overview
- 17.2.3.2. Products
- 17.2.3.3. SWOT Analysis
- 17.2.3.4. Recent Developments
- 17.2.3.5. Financials (Based on Availability)
- 17.2.4 ARRIS International Plc
- 17.2.4.1. Overview
- 17.2.4.2. Products
- 17.2.4.3. SWOT Analysis
- 17.2.4.4. Recent Developments
- 17.2.4.5. Financials (Based on Availability)
- 17.2.5 Cisco Systems Inc
- 17.2.5.1. Overview
- 17.2.5.2. Products
- 17.2.5.3. SWOT Analysis
- 17.2.5.4. Recent Developments
- 17.2.5.5. Financials (Based on Availability)
- 17.2.6 Sterlite Tech
- 17.2.6.1. Overview
- 17.2.6.2. Products
- 17.2.6.3. SWOT Analysis
- 17.2.6.4. Recent Developments
- 17.2.6.5. Financials (Based on Availability)
- 17.2.7 Moftak Solutions
- 17.2.7.1. Overview
- 17.2.7.2. Products
- 17.2.7.3. SWOT Analysis
- 17.2.7.4. Recent Developments
- 17.2.7.5. Financials (Based on Availability)
- 17.2.8 Verizon Communications
- 17.2.8.1. Overview
- 17.2.8.2. Products
- 17.2.8.3. SWOT Analysis
- 17.2.8.4. Recent Developments
- 17.2.8.5. Financials (Based on Availability)
- 17.2.9 Huawei Technologies Co Ltd
- 17.2.9.1. Overview
- 17.2.9.2. Products
- 17.2.9.3. SWOT Analysis
- 17.2.9.4. Recent Developments
- 17.2.9.5. Financials (Based on Availability)
- 17.2.10 AT&T Inc
- 17.2.10.1. Overview
- 17.2.10.2. Products
- 17.2.10.3. SWOT Analysis
- 17.2.10.4. Recent Developments
- 17.2.10.5. Financials (Based on Availability)
- 17.2.1 Tripleplay Services Ltd
List of Figures
- Figure 1: Global IPTV Market Revenue Breakdown (Million, %) by Region 2024 & 2032
- Figure 2: Global IPTV Market Volume Breakdown (K Unit, %) by Region 2024 & 2032
- Figure 3: North America IPTV Market Revenue (Million), by Country 2024 & 2032
- Figure 4: North America IPTV Market Volume (K Unit), by Country 2024 & 2032
- Figure 5: North America IPTV Market Revenue Share (%), by Country 2024 & 2032
- Figure 6: North America IPTV Market Volume Share (%), by Country 2024 & 2032
- Figure 7: Europe IPTV Market Revenue (Million), by Country 2024 & 2032
- Figure 8: Europe IPTV Market Volume (K Unit), by Country 2024 & 2032
- Figure 9: Europe IPTV Market Revenue Share (%), by Country 2024 & 2032
- Figure 10: Europe IPTV Market Volume Share (%), by Country 2024 & 2032
- Figure 11: Asia Pacific IPTV Market Revenue (Million), by Country 2024 & 2032
- Figure 12: Asia Pacific IPTV Market Volume (K Unit), by Country 2024 & 2032
- Figure 13: Asia Pacific IPTV Market Revenue Share (%), by Country 2024 & 2032
- Figure 14: Asia Pacific IPTV Market Volume Share (%), by Country 2024 & 2032
- Figure 15: South America IPTV Market Revenue (Million), by Country 2024 & 2032
- Figure 16: South America IPTV Market Volume (K Unit), by Country 2024 & 2032
- Figure 17: South America IPTV Market Revenue Share (%), by Country 2024 & 2032
- Figure 18: South America IPTV Market Volume Share (%), by Country 2024 & 2032
- Figure 19: North America IPTV Market Revenue (Million), by Country 2024 & 2032
- Figure 20: North America IPTV Market Volume (K Unit), by Country 2024 & 2032
- Figure 21: North America IPTV Market Revenue Share (%), by Country 2024 & 2032
- Figure 22: North America IPTV Market Volume Share (%), by Country 2024 & 2032
- Figure 23: MEA IPTV Market Revenue (Million), by Country 2024 & 2032
- Figure 24: MEA IPTV Market Volume (K Unit), by Country 2024 & 2032
- Figure 25: MEA IPTV Market Revenue Share (%), by Country 2024 & 2032
- Figure 26: MEA IPTV Market Volume Share (%), by Country 2024 & 2032
- Figure 27: North America IPTV Market Revenue (Million), by Type 2024 & 2032
- Figure 28: North America IPTV Market Volume (K Unit), by Type 2024 & 2032
- Figure 29: North America IPTV Market Revenue Share (%), by Type 2024 & 2032
- Figure 30: North America IPTV Market Volume Share (%), by Type 2024 & 2032
- Figure 31: North America IPTV Market Revenue (Million), by End Use 2024 & 2032
- Figure 32: North America IPTV Market Volume (K Unit), by End Use 2024 & 2032
- Figure 33: North America IPTV Market Revenue Share (%), by End Use 2024 & 2032
- Figure 34: North America IPTV Market Volume Share (%), by End Use 2024 & 2032
- Figure 35: North America IPTV Market Revenue (Million), by Country 2024 & 2032
- Figure 36: North America IPTV Market Volume (K Unit), by Country 2024 & 2032
- Figure 37: North America IPTV Market Revenue Share (%), by Country 2024 & 2032
- Figure 38: North America IPTV Market Volume Share (%), by Country 2024 & 2032
- Figure 39: Europe IPTV Market Revenue (Million), by Type 2024 & 2032
- Figure 40: Europe IPTV Market Volume (K Unit), by Type 2024 & 2032
- Figure 41: Europe IPTV Market Revenue Share (%), by Type 2024 & 2032
- Figure 42: Europe IPTV Market Volume Share (%), by Type 2024 & 2032
- Figure 43: Europe IPTV Market Revenue (Million), by End Use 2024 & 2032
- Figure 44: Europe IPTV Market Volume (K Unit), by End Use 2024 & 2032
- Figure 45: Europe IPTV Market Revenue Share (%), by End Use 2024 & 2032
- Figure 46: Europe IPTV Market Volume Share (%), by End Use 2024 & 2032
- Figure 47: Europe IPTV Market Revenue (Million), by Country 2024 & 2032
- Figure 48: Europe IPTV Market Volume (K Unit), by Country 2024 & 2032
- Figure 49: Europe IPTV Market Revenue Share (%), by Country 2024 & 2032
- Figure 50: Europe IPTV Market Volume Share (%), by Country 2024 & 2032
- Figure 51: Asia Pacific IPTV Market Revenue (Million), by Type 2024 & 2032
- Figure 52: Asia Pacific IPTV Market Volume (K Unit), by Type 2024 & 2032
- Figure 53: Asia Pacific IPTV Market Revenue Share (%), by Type 2024 & 2032
- Figure 54: Asia Pacific IPTV Market Volume Share (%), by Type 2024 & 2032
- Figure 55: Asia Pacific IPTV Market Revenue (Million), by End Use 2024 & 2032
- Figure 56: Asia Pacific IPTV Market Volume (K Unit), by End Use 2024 & 2032
- Figure 57: Asia Pacific IPTV Market Revenue Share (%), by End Use 2024 & 2032
- Figure 58: Asia Pacific IPTV Market Volume Share (%), by End Use 2024 & 2032
- Figure 59: Asia Pacific IPTV Market Revenue (Million), by Country 2024 & 2032
- Figure 60: Asia Pacific IPTV Market Volume (K Unit), by Country 2024 & 2032
- Figure 61: Asia Pacific IPTV Market Revenue Share (%), by Country 2024 & 2032
- Figure 62: Asia Pacific IPTV Market Volume Share (%), by Country 2024 & 2032
- Figure 63: Latin America IPTV Market Revenue (Million), by Type 2024 & 2032
- Figure 64: Latin America IPTV Market Volume (K Unit), by Type 2024 & 2032
- Figure 65: Latin America IPTV Market Revenue Share (%), by Type 2024 & 2032
- Figure 66: Latin America IPTV Market Volume Share (%), by Type 2024 & 2032
- Figure 67: Latin America IPTV Market Revenue (Million), by End Use 2024 & 2032
- Figure 68: Latin America IPTV Market Volume (K Unit), by End Use 2024 & 2032
- Figure 69: Latin America IPTV Market Revenue Share (%), by End Use 2024 & 2032
- Figure 70: Latin America IPTV Market Volume Share (%), by End Use 2024 & 2032
- Figure 71: Latin America IPTV Market Revenue (Million), by Country 2024 & 2032
- Figure 72: Latin America IPTV Market Volume (K Unit), by Country 2024 & 2032
- Figure 73: Latin America IPTV Market Revenue Share (%), by Country 2024 & 2032
- Figure 74: Latin America IPTV Market Volume Share (%), by Country 2024 & 2032
- Figure 75: Middle East IPTV Market Revenue (Million), by Type 2024 & 2032
- Figure 76: Middle East IPTV Market Volume (K Unit), by Type 2024 & 2032
- Figure 77: Middle East IPTV Market Revenue Share (%), by Type 2024 & 2032
- Figure 78: Middle East IPTV Market Volume Share (%), by Type 2024 & 2032
- Figure 79: Middle East IPTV Market Revenue (Million), by End Use 2024 & 2032
- Figure 80: Middle East IPTV Market Volume (K Unit), by End Use 2024 & 2032
- Figure 81: Middle East IPTV Market Revenue Share (%), by End Use 2024 & 2032
- Figure 82: Middle East IPTV Market Volume Share (%), by End Use 2024 & 2032
- Figure 83: Middle East IPTV Market Revenue (Million), by Country 2024 & 2032
- Figure 84: Middle East IPTV Market Volume (K Unit), by Country 2024 & 2032
- Figure 85: Middle East IPTV Market Revenue Share (%), by Country 2024 & 2032
- Figure 86: Middle East IPTV Market Volume Share (%), by Country 2024 & 2032
List of Tables
- Table 1: Global IPTV Market Revenue Million Forecast, by Region 2019 & 2032
- Table 2: Global IPTV Market Volume K Unit Forecast, by Region 2019 & 2032
- Table 3: Global IPTV Market Revenue Million Forecast, by Type 2019 & 2032
- Table 4: Global IPTV Market Volume K Unit Forecast, by Type 2019 & 2032
- Table 5: Global IPTV Market Revenue Million Forecast, by End Use 2019 & 2032
- Table 6: Global IPTV Market Volume K Unit Forecast, by End Use 2019 & 2032
- Table 7: Global IPTV Market Revenue Million Forecast, by Region 2019 & 2032
- Table 8: Global IPTV Market Volume K Unit Forecast, by Region 2019 & 2032
- Table 9: Global IPTV Market Revenue Million Forecast, by Country 2019 & 2032
- Table 10: Global IPTV Market Volume K Unit Forecast, by Country 2019 & 2032
- Table 11: United States IPTV Market Revenue (Million) Forecast, by Application 2019 & 2032
- Table 12: United States IPTV Market Volume (K Unit) Forecast, by Application 2019 & 2032
- Table 13: Canada IPTV Market Revenue (Million) Forecast, by Application 2019 & 2032
- Table 14: Canada IPTV Market Volume (K Unit) Forecast, by Application 2019 & 2032
- Table 15: Mexico IPTV Market Revenue (Million) Forecast, by Application 2019 & 2032
- Table 16: Mexico IPTV Market Volume (K Unit) Forecast, by Application 2019 & 2032
- Table 17: Global IPTV Market Revenue Million Forecast, by Country 2019 & 2032
- Table 18: Global IPTV Market Volume K Unit Forecast, by Country 2019 & 2032
- Table 19: Germany IPTV Market Revenue (Million) Forecast, by Application 2019 & 2032
- Table 20: Germany IPTV Market Volume (K Unit) Forecast, by Application 2019 & 2032
- Table 21: United Kingdom IPTV Market Revenue (Million) Forecast, by Application 2019 & 2032
- Table 22: United Kingdom IPTV Market Volume (K Unit) Forecast, by Application 2019 & 2032
- Table 23: France IPTV Market Revenue (Million) Forecast, by Application 2019 & 2032
- Table 24: France IPTV Market Volume (K Unit) Forecast, by Application 2019 & 2032
- Table 25: Spain IPTV Market Revenue (Million) Forecast, by Application 2019 & 2032
- Table 26: Spain IPTV Market Volume (K Unit) Forecast, by Application 2019 & 2032
- Table 27: Italy IPTV Market Revenue (Million) Forecast, by Application 2019 & 2032
- Table 28: Italy IPTV Market Volume (K Unit) Forecast, by Application 2019 & 2032
- Table 29: Spain IPTV Market Revenue (Million) Forecast, by Application 2019 & 2032
- Table 30: Spain IPTV Market Volume (K Unit) Forecast, by Application 2019 & 2032
- Table 31: Belgium IPTV Market Revenue (Million) Forecast, by Application 2019 & 2032
- Table 32: Belgium IPTV Market Volume (K Unit) Forecast, by Application 2019 & 2032
- Table 33: Netherland IPTV Market Revenue (Million) Forecast, by Application 2019 & 2032
- Table 34: Netherland IPTV Market Volume (K Unit) Forecast, by Application 2019 & 2032
- Table 35: Nordics IPTV Market Revenue (Million) Forecast, by Application 2019 & 2032
- Table 36: Nordics IPTV Market Volume (K Unit) Forecast, by Application 2019 & 2032
- Table 37: Rest of Europe IPTV Market Revenue (Million) Forecast, by Application 2019 & 2032
- Table 38: Rest of Europe IPTV Market Volume (K Unit) Forecast, by Application 2019 & 2032
- Table 39: Global IPTV Market Revenue Million Forecast, by Country 2019 & 2032
- Table 40: Global IPTV Market Volume K Unit Forecast, by Country 2019 & 2032
- Table 41: China IPTV Market Revenue (Million) Forecast, by Application 2019 & 2032
- Table 42: China IPTV Market Volume (K Unit) Forecast, by Application 2019 & 2032
- Table 43: Japan IPTV Market Revenue (Million) Forecast, by Application 2019 & 2032
- Table 44: Japan IPTV Market Volume (K Unit) Forecast, by Application 2019 & 2032
- Table 45: India IPTV Market Revenue (Million) Forecast, by Application 2019 & 2032
- Table 46: India IPTV Market Volume (K Unit) Forecast, by Application 2019 & 2032
- Table 47: South Korea IPTV Market Revenue (Million) Forecast, by Application 2019 & 2032
- Table 48: South Korea IPTV Market Volume (K Unit) Forecast, by Application 2019 & 2032
- Table 49: Southeast Asia IPTV Market Revenue (Million) Forecast, by Application 2019 & 2032
- Table 50: Southeast Asia IPTV Market Volume (K Unit) Forecast, by Application 2019 & 2032
- Table 51: Australia IPTV Market Revenue (Million) Forecast, by Application 2019 & 2032
- Table 52: Australia IPTV Market Volume (K Unit) Forecast, by Application 2019 & 2032
- Table 53: Indonesia IPTV Market Revenue (Million) Forecast, by Application 2019 & 2032
- Table 54: Indonesia IPTV Market Volume (K Unit) Forecast, by Application 2019 & 2032
- Table 55: Phillipes IPTV Market Revenue (Million) Forecast, by Application 2019 & 2032
- Table 56: Phillipes IPTV Market Volume (K Unit) Forecast, by Application 2019 & 2032
- Table 57: Singapore IPTV Market Revenue (Million) Forecast, by Application 2019 & 2032
- Table 58: Singapore IPTV Market Volume (K Unit) Forecast, by Application 2019 & 2032
- Table 59: Thailandc IPTV Market Revenue (Million) Forecast, by Application 2019 & 2032
- Table 60: Thailandc IPTV Market Volume (K Unit) Forecast, by Application 2019 & 2032
- Table 61: Rest of Asia Pacific IPTV Market Revenue (Million) Forecast, by Application 2019 & 2032
- Table 62: Rest of Asia Pacific IPTV Market Volume (K Unit) Forecast, by Application 2019 & 2032
- Table 63: Global IPTV Market Revenue Million Forecast, by Country 2019 & 2032
- Table 64: Global IPTV Market Volume K Unit Forecast, by Country 2019 & 2032
- Table 65: Brazil IPTV Market Revenue (Million) Forecast, by Application 2019 & 2032
- Table 66: Brazil IPTV Market Volume (K Unit) Forecast, by Application 2019 & 2032
- Table 67: Argentina IPTV Market Revenue (Million) Forecast, by Application 2019 & 2032
- Table 68: Argentina IPTV Market Volume (K Unit) Forecast, by Application 2019 & 2032
- Table 69: Peru IPTV Market Revenue (Million) Forecast, by Application 2019 & 2032
- Table 70: Peru IPTV Market Volume (K Unit) Forecast, by Application 2019 & 2032
- Table 71: Chile IPTV Market Revenue (Million) Forecast, by Application 2019 & 2032
- Table 72: Chile IPTV Market Volume (K Unit) Forecast, by Application 2019 & 2032
- Table 73: Colombia IPTV Market Revenue (Million) Forecast, by Application 2019 & 2032
- Table 74: Colombia IPTV Market Volume (K Unit) Forecast, by Application 2019 & 2032
- Table 75: Ecuador IPTV Market Revenue (Million) Forecast, by Application 2019 & 2032
- Table 76: Ecuador IPTV Market Volume (K Unit) Forecast, by Application 2019 & 2032
- Table 77: Venezuela IPTV Market Revenue (Million) Forecast, by Application 2019 & 2032
- Table 78: Venezuela IPTV Market Volume (K Unit) Forecast, by Application 2019 & 2032
- Table 79: Rest of South America IPTV Market Revenue (Million) Forecast, by Application 2019 & 2032
- Table 80: Rest of South America IPTV Market Volume (K Unit) Forecast, by Application 2019 & 2032
- Table 81: Global IPTV Market Revenue Million Forecast, by Country 2019 & 2032
- Table 82: Global IPTV Market Volume K Unit Forecast, by Country 2019 & 2032
- Table 83: United States IPTV Market Revenue (Million) Forecast, by Application 2019 & 2032
- Table 84: United States IPTV Market Volume (K Unit) Forecast, by Application 2019 & 2032
- Table 85: Canada IPTV Market Revenue (Million) Forecast, by Application 2019 & 2032
- Table 86: Canada IPTV Market Volume (K Unit) Forecast, by Application 2019 & 2032
- Table 87: Mexico IPTV Market Revenue (Million) Forecast, by Application 2019 & 2032
- Table 88: Mexico IPTV Market Volume (K Unit) Forecast, by Application 2019 & 2032
- Table 89: Global IPTV Market Revenue Million Forecast, by Country 2019 & 2032
- Table 90: Global IPTV Market Volume K Unit Forecast, by Country 2019 & 2032
- Table 91: United Arab Emirates IPTV Market Revenue (Million) Forecast, by Application 2019 & 2032
- Table 92: United Arab Emirates IPTV Market Volume (K Unit) Forecast, by Application 2019 & 2032
- Table 93: Saudi Arabia IPTV Market Revenue (Million) Forecast, by Application 2019 & 2032
- Table 94: Saudi Arabia IPTV Market Volume (K Unit) Forecast, by Application 2019 & 2032
- Table 95: South Africa IPTV Market Revenue (Million) Forecast, by Application 2019 & 2032
- Table 96: South Africa IPTV Market Volume (K Unit) Forecast, by Application 2019 & 2032
- Table 97: Rest of Middle East and Africa IPTV Market Revenue (Million) Forecast, by Application 2019 & 2032
- Table 98: Rest of Middle East and Africa IPTV Market Volume (K Unit) Forecast, by Application 2019 & 2032
- Table 99: Global IPTV Market Revenue Million Forecast, by Type 2019 & 2032
- Table 100: Global IPTV Market Volume K Unit Forecast, by Type 2019 & 2032
- Table 101: Global IPTV Market Revenue Million Forecast, by End Use 2019 & 2032
- Table 102: Global IPTV Market Volume K Unit Forecast, by End Use 2019 & 2032
- Table 103: Global IPTV Market Revenue Million Forecast, by Country 2019 & 2032
- Table 104: Global IPTV Market Volume K Unit Forecast, by Country 2019 & 2032
- Table 105: Global IPTV Market Revenue Million Forecast, by Type 2019 & 2032
- Table 106: Global IPTV Market Volume K Unit Forecast, by Type 2019 & 2032
- Table 107: Global IPTV Market Revenue Million Forecast, by End Use 2019 & 2032
- Table 108: Global IPTV Market Volume K Unit Forecast, by End Use 2019 & 2032
- Table 109: Global IPTV Market Revenue Million Forecast, by Country 2019 & 2032
- Table 110: Global IPTV Market Volume K Unit Forecast, by Country 2019 & 2032
- Table 111: Global IPTV Market Revenue Million Forecast, by Type 2019 & 2032
- Table 112: Global IPTV Market Volume K Unit Forecast, by Type 2019 & 2032
- Table 113: Global IPTV Market Revenue Million Forecast, by End Use 2019 & 2032
- Table 114: Global IPTV Market Volume K Unit Forecast, by End Use 2019 & 2032
- Table 115: Global IPTV Market Revenue Million Forecast, by Country 2019 & 2032
- Table 116: Global IPTV Market Volume K Unit Forecast, by Country 2019 & 2032
- Table 117: Global IPTV Market Revenue Million Forecast, by Type 2019 & 2032
- Table 118: Global IPTV Market Volume K Unit Forecast, by Type 2019 & 2032
- Table 119: Global IPTV Market Revenue Million Forecast, by End Use 2019 & 2032
- Table 120: Global IPTV Market Volume K Unit Forecast, by End Use 2019 & 2032
- Table 121: Global IPTV Market Revenue Million Forecast, by Country 2019 & 2032
- Table 122: Global IPTV Market Volume K Unit Forecast, by Country 2019 & 2032
- Table 123: Global IPTV Market Revenue Million Forecast, by Type 2019 & 2032
- Table 124: Global IPTV Market Volume K Unit Forecast, by Type 2019 & 2032
- Table 125: Global IPTV Market Revenue Million Forecast, by End Use 2019 & 2032
- Table 126: Global IPTV Market Volume K Unit Forecast, by End Use 2019 & 2032
- Table 127: Global IPTV Market Revenue Million Forecast, by Country 2019 & 2032
- Table 128: Global IPTV Market Volume K Unit Forecast, by Country 2019 & 2032
Frequently Asked Questions
1. What is the projected Compound Annual Growth Rate (CAGR) of the IPTV Market?
The projected CAGR is approximately 18.99%.
2. Which companies are prominent players in the IPTV Market?
Key companies in the market include Tripleplay Services Ltd , Ericsson AB, Akamai Technologies Inc, ARRIS International Plc, Cisco Systems Inc, Sterlite Tech, Moftak Solutions, Verizon Communications, Huawei Technologies Co Ltd, AT&T Inc.
3. What are the main segments of the IPTV Market?
The market segments include Type, End Use.
4. Can you provide details about the market size?
The market size is estimated to be USD 44.29 Million as of 2022.
5. What are some drivers contributing to market growth?
Demand for High-Definition Channels and Video On-Demand; Interactive Services Packaged Along with IPTV Services; Favorable Government Initiatives.
6. What are the notable trends driving market growth?
Hardware segment to acquire major market share.
7. Are there any restraints impacting market growth?
Competition from Cable TV and Satellite TV Operators; Lack of Infrastructure in Developing Regions to Offer Delay and Jitter-free Service.
8. Can you provide examples of recent developments in the market?
In March 2023, BSNL launched Internet Protocol Television (IPTV) services to its customers in Tamil Nadu. IPTV is a revolutionary way of delivering TV channels over the internet. In the fiber-optic internet services segment, to add further value to the existing and new FTTH (Fibre to the Home ) customers, BSNL has introduced IPTV services in partnership with M/s E2 Info Solutions, an IPTV Service Provider serving pan India.
9. What pricing options are available for accessing the report?
Pricing options include single-user, multi-user, and enterprise licenses priced at USD 4750, USD 5250, and USD 8750 respectively.
10. Is the market size provided in terms of value or volume?
The market size is provided in terms of value, measured in Million and volume, measured in K Unit.
11. Are there any specific market keywords associated with the report?
Yes, the market keyword associated with the report is "IPTV Market," which aids in identifying and referencing the specific market segment covered.
12. How do I determine which pricing option suits my needs best?
The pricing options vary based on user requirements and access needs. Individual users may opt for single-user licenses, while businesses requiring broader access may choose multi-user or enterprise licenses for cost-effective access to the report.
13. Are there any additional resources or data provided in the IPTV Market report?
While the report offers comprehensive insights, it's advisable to review the specific contents or supplementary materials provided to ascertain if additional resources or data are available.
14. How can I stay updated on further developments or reports in the IPTV Market?
To stay informed about further developments, trends, and reports in the IPTV Market, consider subscribing to industry newsletters, following relevant companies and organizations, or regularly checking reputable industry news sources and publications.
Methodology
Step 1 - Identification of Relevant Samples Size from Population Database


Step 2 - Approaches for Defining Global Market Size (Value, Volume* & Price*)

Note*: In applicable scenarios
Step 3 - Data Sources
Primary Research
- Web Analytics
- Survey Reports
- Research Institute
- Latest Research Reports
- Opinion Leaders
Secondary Research
- Annual Reports
- White Paper
- Latest Press Release
- Industry Association
- Paid Database
- Investor Presentations

Step 4 - Data Triangulation
Involves using different sources of information in order to increase the validity of a study
These sources are likely to be stakeholders in a program - participants, other researchers, program staff, other community members, and so on.
Then we put all data in single framework & apply various statistical tools to find out the dynamic on the market.
During the analysis stage, feedback from the stakeholder groups would be compared to determine areas of agreement as well as areas of divergence


