
Key Insights
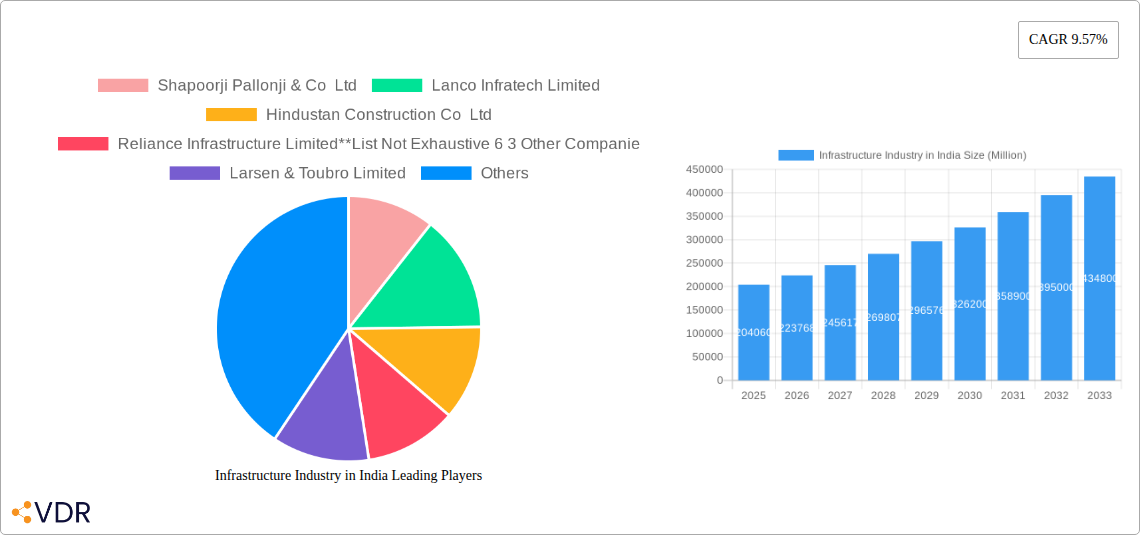
The Indian infrastructure market, valued at $204.06 billion in 2025, exhibits robust growth potential, projected to expand at a Compound Annual Growth Rate (CAGR) of 9.57% from 2025 to 2033. This expansion is driven by several factors, including the government's significant investments in infrastructure development under initiatives like the National Infrastructure Pipeline (NIP), a rising demand for improved transportation networks (roads, railways, and airports) to support economic growth, and the increasing urbanization leading to a surge in the need for social infrastructure like housing and sanitation. Further fueling this growth is the expansion of manufacturing and energy sectors requiring robust industrial infrastructure. While challenges exist, such as land acquisition complexities and regulatory hurdles, the overall outlook remains positive, indicating substantial opportunities for both domestic and international players in various infrastructure segments.
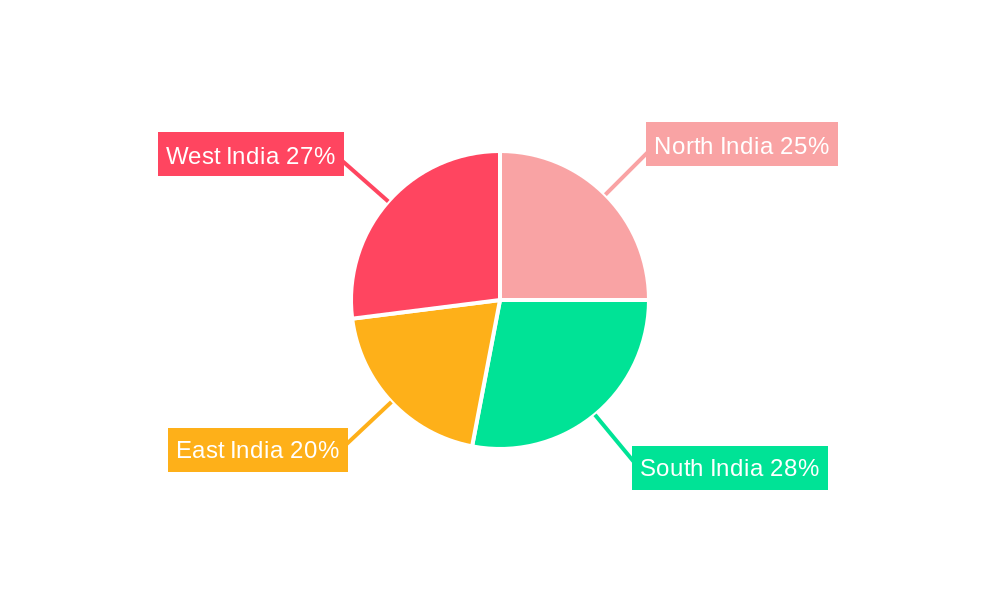
The market segmentation reveals significant opportunities across diverse infrastructure types. Social infrastructure, encompassing housing, healthcare, and education, is expected to witness substantial growth due to India's burgeoning population and rising living standards. Transportation infrastructure, including roads, railways, and ports, will benefit from the government's focus on improving connectivity nationwide. Similarly, the expansion of manufacturing and energy sectors will create a strong demand for industrial infrastructure, including power plants, factories, and related facilities. Maharashtra, Karnataka, Delhi, and Telangana are key states driving market growth, reflecting their advanced economic development and robust infrastructure initiatives. Leading players like Larsen & Toubro, Shapoorji Pallonji, and Reliance Infrastructure are well-positioned to capitalize on these opportunities, while the presence of numerous other companies signals a competitive yet dynamic landscape. The market's regional variations, though not explicitly detailed, suggest varied growth trajectories influenced by local economic conditions and government policies across North, South, East, and West India.
This comprehensive report provides an in-depth analysis of the Indian infrastructure industry, covering market dynamics, growth trends, key players, and future outlook. With a study period spanning 2019-2033, a base year of 2025, and a forecast period of 2025-2033, this report is an essential resource for industry professionals, investors, and policymakers. The report analyzes the market across various segments and key states, offering valuable insights for strategic decision-making.
Infrastructure Industry in India Market Dynamics & Structure
The Indian infrastructure sector, valued at xx Million in 2024, is characterized by a moderately concentrated market with several large players and a large number of smaller firms. Market leaders like Larsen & Toubro Limited and Shapoorji Pallonji & Co Ltd hold significant shares, while numerous regional players contribute to the overall market size. Technological innovation, driven by the adoption of advanced construction techniques, BIM modeling, and digitalization, is transforming the industry. However, bureaucratic hurdles, land acquisition challenges, and financing constraints pose significant barriers to innovation. The regulatory framework, while evolving, continues to influence project timelines and costs. The sector witnesses continuous mergers and acquisitions (M&A), with deal volumes averaging xx per year in the historical period (2019-2024). Competition from other infrastructure markets such as energy and water is present. End-user demographics are influenced by factors such as urbanization and industrial growth, which drive demand for new infrastructure.
- Market Concentration: Moderately concentrated, with a few dominant players and numerous smaller firms.
- Technological Innovation: Adoption of BIM, digital construction, and advanced materials.
- Regulatory Framework: Evolving, influencing project timelines and costs.
- Competitive Substitutes: Energy and water infrastructure markets.
- End-User Demographics: Driven by urbanization and industrial expansion.
- M&A Trends: Average xx deals per year (2019-2024).
Infrastructure Industry in India Growth Trends & Insights
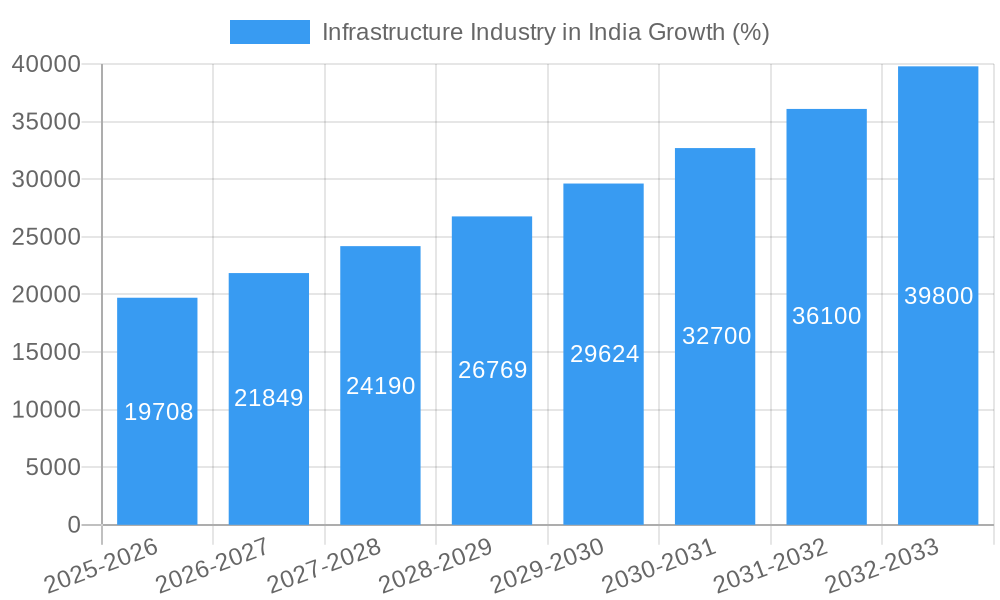
The Indian infrastructure market exhibits robust growth, driven by government initiatives like the National Infrastructure Pipeline (NIP) and increasing private sector participation. The market size grew from xx Million in 2019 to xx Million in 2024, registering a CAGR of xx%. This growth is primarily driven by the expanding transportation infrastructure, urban development, and the nation's continuous industrialization. Technological advancements, particularly the integration of digital technologies, are accelerating project execution and improving efficiency. The evolving consumer behaviour, particularly in urban areas, reflects a higher demand for improved infrastructure quality and sustainable solutions. The adoption rate of advanced construction technologies is gradually increasing, but faces some limitations caused by lack of skilled workforce and integration challenges. Furthermore, public-private partnerships (PPPs) are key drivers for sustainable growth.
- Market Size: xx Million (2024)
- CAGR (2019-2024): xx%
- Key Growth Drivers: NIP, private sector involvement, urbanization, industrialization.
- Technology Adoption: Increasing, but facing skills gaps and integration challenges.
Dominant Regions, Countries, or Segments in Infrastructure Industry in India
Transportation infrastructure represents the largest segment of the Indian infrastructure market, followed by the social infrastructure segment. Maharashtra, Karnataka, and Delhi are among the leading states driving this growth, mainly because of their large populations and established industrial bases. The growth is boosted by economic policies focused on infrastructure development, significant investments in public transportation projects, and rising government spending. The robust economic growth in these states, combined with supportive government policies, fosters a favourable environment for attracting investments. Growth potential is also significant in other states experiencing rapid urbanization and industrialization.
- Dominant Segment: Transportation Infrastructure
- Leading States: Maharashtra, Karnataka, Delhi, Telangana
- Key Drivers: Government policies, investments, urbanization, economic growth.
Infrastructure Industry in India Product Landscape
The Indian infrastructure market showcases a diverse product landscape, including innovative materials like high-performance concrete and sustainable construction techniques. These innovations aim to enhance durability, reduce construction timelines, and promote environmental sustainability. Applications range from large-scale transportation projects to smaller-scale urban development initiatives. Performance metrics, such as project completion rates and cost-effectiveness, are key factors driving the market. The unique selling propositions often focus on advanced technologies that contribute to quicker project completion, improved sustainability, and enhanced safety.
Key Drivers, Barriers & Challenges in Infrastructure Industry in India
Key Drivers: Government initiatives like the NIP, increased private sector participation, and technological advancements, particularly in BIM and digital construction methods, fuel market growth. Furthermore, growing urbanization and industrialization significantly boost demand.
Key Challenges: Land acquisition delays, regulatory hurdles, financing constraints, and a shortage of skilled labor represent major barriers. These factors often cause project cost overruns and schedule delays. The competition among companies for limited resources also poses a challenge. Supply chain disruptions and fluctuating material prices impact project profitability.
Emerging Opportunities in Infrastructure Industry in India
Emerging opportunities lie in areas such as smart city initiatives, renewable energy infrastructure, and the development of sustainable transportation systems. Untapped markets in rural areas and the increasing demand for resilient infrastructure against climate change also present significant opportunities. Innovative applications of digital technologies, such as AI in project management and construction robotics, offer further avenues for growth.
Growth Accelerators in the Infrastructure Industry in India Industry
Technological breakthroughs, such as advanced construction materials and digital twin technology, along with strategic partnerships between public and private entities, are accelerating growth. Expanding into new markets and regions, alongside the development of new infrastructure projects across the country will provide further growth. Focus on sustainable practices and environmentally responsible construction are also significant growth accelerators.
Key Players Shaping the Infrastructure Industry in India Market
- Shapoorji Pallonji & Co Ltd
- Lanco Infratech Limited
- Hindustan Construction Co Ltd
- Reliance Infrastructure Limited
- 6 3 Other Companies
- Larsen & Toubro Limited
- Gammon India Ltd
- Tata Projects Ltd
- Nagarjuna Construction Company Limited (NCC Ltd)
- Jaiprakash Associates Ltd
- Simplex Infrastructures Ltd
Notable Milestones in Infrastructure Industry in India Sector
- January 2024: Highway Infrastructure Trust (HIT) acquired 12 road projects (approx. 3,800 lane km) valued at INR 90.06 billion (USD 1.08 billion).
- February 2024: Tata Steel partnered with South Eastern Railway (SER) to promote sustainable rail infrastructure using slag-based aggregates.
In-Depth Infrastructure Industry in India Market Outlook
The Indian infrastructure industry is poised for sustained growth over the forecast period (2025-2033), driven by continued government investment, urbanization, and technological advancements. Strategic partnerships, focus on sustainable practices, and exploring new market segments will play a crucial role in shaping the industry's future. The market is expected to reach xx Million by 2033, showcasing significant potential for investors and industry players.
Infrastructure Industry in India Segmentation
-
1. Infrastructure segment
- 1.1. Social Infrastructure
- 1.2. Transportation Infrastructure
- 1.3. Extraction Infrastructure
- 1.4. Manufacturing Infrastructure
- 1.5. Utilities Infrastructure
-
2. Key States
- 2.1. Maharashtra
- 2.2. Karnataka
- 2.3. Delhi
- 2.4. Telangana
- 2.5. Other States
Infrastructure Industry in India Segmentation By Geography
-
1. North America
- 1.1. United States
- 1.2. Canada
- 1.3. Mexico
-
2. South America
- 2.1. Brazil
- 2.2. Argentina
- 2.3. Rest of South America
-
3. Europe
- 3.1. United Kingdom
- 3.2. Germany
- 3.3. France
- 3.4. Italy
- 3.5. Spain
- 3.6. Russia
- 3.7. Benelux
- 3.8. Nordics
- 3.9. Rest of Europe
-
4. Middle East & Africa
- 4.1. Turkey
- 4.2. Israel
- 4.3. GCC
- 4.4. North Africa
- 4.5. South Africa
- 4.6. Rest of Middle East & Africa
-
5. Asia Pacific
- 5.1. China
- 5.2. India
- 5.3. Japan
- 5.4. South Korea
- 5.5. ASEAN
- 5.6. Oceania
- 5.7. Rest of Asia Pacific
Infrastructure Industry in India REPORT HIGHLIGHTS
| Aspects | Details |
|---|---|
| Study Period | 2019-2033 |
| Base Year | 2024 |
| Estimated Year | 2025 |
| Forecast Period | 2025-2033 |
| Historical Period | 2019-2024 |
| Growth Rate | CAGR of 9.57% from 2019-2033 |
| Segmentation |
|
Table of Contents
- 1. Introduction
- 1.1. Research Scope
- 1.2. Market Segmentation
- 1.3. Research Methodology
- 1.4. Definitions and Assumptions
- 2. Executive Summary
- 2.1. Introduction
- 3. Market Dynamics
- 3.1. Introduction
- 3.2. Market Drivers
- 3.2.1. Rapid Urbanization is Driving the Market; Surge in Foreign Direct Investments is Driving the Market
- 3.3. Market Restrains
- 3.3.1. Bureaucratic Processes are Affecting the Market; Environmental Concerns and Regulatory Hurdles are Affecting the Market
- 3.4. Market Trends
- 3.4.1. Increase in Road Infrastructure Investment is Expected to Propel the Market Growth
- 4. Market Factor Analysis
- 4.1. Porters Five Forces
- 4.2. Supply/Value Chain
- 4.3. PESTEL analysis
- 4.4. Market Entropy
- 4.5. Patent/Trademark Analysis
- 5. Global Infrastructure Industry in India Analysis, Insights and Forecast, 2019-2031
- 5.1. Market Analysis, Insights and Forecast - by Infrastructure segment
- 5.1.1. Social Infrastructure
- 5.1.2. Transportation Infrastructure
- 5.1.3. Extraction Infrastructure
- 5.1.4. Manufacturing Infrastructure
- 5.1.5. Utilities Infrastructure
- 5.2. Market Analysis, Insights and Forecast - by Key States
- 5.2.1. Maharashtra
- 5.2.2. Karnataka
- 5.2.3. Delhi
- 5.2.4. Telangana
- 5.2.5. Other States
- 5.3. Market Analysis, Insights and Forecast - by Region
- 5.3.1. North America
- 5.3.2. South America
- 5.3.3. Europe
- 5.3.4. Middle East & Africa
- 5.3.5. Asia Pacific
- 5.1. Market Analysis, Insights and Forecast - by Infrastructure segment
- 6. North America Infrastructure Industry in India Analysis, Insights and Forecast, 2019-2031
- 6.1. Market Analysis, Insights and Forecast - by Infrastructure segment
- 6.1.1. Social Infrastructure
- 6.1.2. Transportation Infrastructure
- 6.1.3. Extraction Infrastructure
- 6.1.4. Manufacturing Infrastructure
- 6.1.5. Utilities Infrastructure
- 6.2. Market Analysis, Insights and Forecast - by Key States
- 6.2.1. Maharashtra
- 6.2.2. Karnataka
- 6.2.3. Delhi
- 6.2.4. Telangana
- 6.2.5. Other States
- 6.1. Market Analysis, Insights and Forecast - by Infrastructure segment
- 7. South America Infrastructure Industry in India Analysis, Insights and Forecast, 2019-2031
- 7.1. Market Analysis, Insights and Forecast - by Infrastructure segment
- 7.1.1. Social Infrastructure
- 7.1.2. Transportation Infrastructure
- 7.1.3. Extraction Infrastructure
- 7.1.4. Manufacturing Infrastructure
- 7.1.5. Utilities Infrastructure
- 7.2. Market Analysis, Insights and Forecast - by Key States
- 7.2.1. Maharashtra
- 7.2.2. Karnataka
- 7.2.3. Delhi
- 7.2.4. Telangana
- 7.2.5. Other States
- 7.1. Market Analysis, Insights and Forecast - by Infrastructure segment
- 8. Europe Infrastructure Industry in India Analysis, Insights and Forecast, 2019-2031
- 8.1. Market Analysis, Insights and Forecast - by Infrastructure segment
- 8.1.1. Social Infrastructure
- 8.1.2. Transportation Infrastructure
- 8.1.3. Extraction Infrastructure
- 8.1.4. Manufacturing Infrastructure
- 8.1.5. Utilities Infrastructure
- 8.2. Market Analysis, Insights and Forecast - by Key States
- 8.2.1. Maharashtra
- 8.2.2. Karnataka
- 8.2.3. Delhi
- 8.2.4. Telangana
- 8.2.5. Other States
- 8.1. Market Analysis, Insights and Forecast - by Infrastructure segment
- 9. Middle East & Africa Infrastructure Industry in India Analysis, Insights and Forecast, 2019-2031
- 9.1. Market Analysis, Insights and Forecast - by Infrastructure segment
- 9.1.1. Social Infrastructure
- 9.1.2. Transportation Infrastructure
- 9.1.3. Extraction Infrastructure
- 9.1.4. Manufacturing Infrastructure
- 9.1.5. Utilities Infrastructure
- 9.2. Market Analysis, Insights and Forecast - by Key States
- 9.2.1. Maharashtra
- 9.2.2. Karnataka
- 9.2.3. Delhi
- 9.2.4. Telangana
- 9.2.5. Other States
- 9.1. Market Analysis, Insights and Forecast - by Infrastructure segment
- 10. Asia Pacific Infrastructure Industry in India Analysis, Insights and Forecast, 2019-2031
- 10.1. Market Analysis, Insights and Forecast - by Infrastructure segment
- 10.1.1. Social Infrastructure
- 10.1.2. Transportation Infrastructure
- 10.1.3. Extraction Infrastructure
- 10.1.4. Manufacturing Infrastructure
- 10.1.5. Utilities Infrastructure
- 10.2. Market Analysis, Insights and Forecast - by Key States
- 10.2.1. Maharashtra
- 10.2.2. Karnataka
- 10.2.3. Delhi
- 10.2.4. Telangana
- 10.2.5. Other States
- 10.1. Market Analysis, Insights and Forecast - by Infrastructure segment
- 11. North India Infrastructure Industry in India Analysis, Insights and Forecast, 2019-2031
- 12. South India Infrastructure Industry in India Analysis, Insights and Forecast, 2019-2031
- 13. East India Infrastructure Industry in India Analysis, Insights and Forecast, 2019-2031
- 14. West India Infrastructure Industry in India Analysis, Insights and Forecast, 2019-2031
- 15. Competitive Analysis
- 15.1. Global Market Share Analysis 2024
- 15.2. Company Profiles
- 15.2.1 Shapoorji Pallonji & Co Ltd
- 15.2.1.1. Overview
- 15.2.1.2. Products
- 15.2.1.3. SWOT Analysis
- 15.2.1.4. Recent Developments
- 15.2.1.5. Financials (Based on Availability)
- 15.2.2 Lanco Infratech Limited
- 15.2.2.1. Overview
- 15.2.2.2. Products
- 15.2.2.3. SWOT Analysis
- 15.2.2.4. Recent Developments
- 15.2.2.5. Financials (Based on Availability)
- 15.2.3 Hindustan Construction Co Ltd
- 15.2.3.1. Overview
- 15.2.3.2. Products
- 15.2.3.3. SWOT Analysis
- 15.2.3.4. Recent Developments
- 15.2.3.5. Financials (Based on Availability)
- 15.2.4 Reliance Infrastructure Limited**List Not Exhaustive 6 3 Other Companie
- 15.2.4.1. Overview
- 15.2.4.2. Products
- 15.2.4.3. SWOT Analysis
- 15.2.4.4. Recent Developments
- 15.2.4.5. Financials (Based on Availability)
- 15.2.5 Larsen & Toubro Limited
- 15.2.5.1. Overview
- 15.2.5.2. Products
- 15.2.5.3. SWOT Analysis
- 15.2.5.4. Recent Developments
- 15.2.5.5. Financials (Based on Availability)
- 15.2.6 Gammon India Ltd
- 15.2.6.1. Overview
- 15.2.6.2. Products
- 15.2.6.3. SWOT Analysis
- 15.2.6.4. Recent Developments
- 15.2.6.5. Financials (Based on Availability)
- 15.2.7 Tata Projects Ltd
- 15.2.7.1. Overview
- 15.2.7.2. Products
- 15.2.7.3. SWOT Analysis
- 15.2.7.4. Recent Developments
- 15.2.7.5. Financials (Based on Availability)
- 15.2.8 Nagarjuna Construction Company Limited (NCC Ltd)
- 15.2.8.1. Overview
- 15.2.8.2. Products
- 15.2.8.3. SWOT Analysis
- 15.2.8.4. Recent Developments
- 15.2.8.5. Financials (Based on Availability)
- 15.2.9 Jaiprakash Associates Ltd
- 15.2.9.1. Overview
- 15.2.9.2. Products
- 15.2.9.3. SWOT Analysis
- 15.2.9.4. Recent Developments
- 15.2.9.5. Financials (Based on Availability)
- 15.2.10 Simplex Infrastructures Ltd
- 15.2.10.1. Overview
- 15.2.10.2. Products
- 15.2.10.3. SWOT Analysis
- 15.2.10.4. Recent Developments
- 15.2.10.5. Financials (Based on Availability)
- 15.2.1 Shapoorji Pallonji & Co Ltd
List of Figures
- Figure 1: Global Infrastructure Industry in India Revenue Breakdown (Million, %) by Region 2024 & 2032
- Figure 2: India Infrastructure Industry in India Revenue (Million), by Country 2024 & 2032
- Figure 3: India Infrastructure Industry in India Revenue Share (%), by Country 2024 & 2032
- Figure 4: North America Infrastructure Industry in India Revenue (Million), by Infrastructure segment 2024 & 2032
- Figure 5: North America Infrastructure Industry in India Revenue Share (%), by Infrastructure segment 2024 & 2032
- Figure 6: North America Infrastructure Industry in India Revenue (Million), by Key States 2024 & 2032
- Figure 7: North America Infrastructure Industry in India Revenue Share (%), by Key States 2024 & 2032
- Figure 8: North America Infrastructure Industry in India Revenue (Million), by Country 2024 & 2032
- Figure 9: North America Infrastructure Industry in India Revenue Share (%), by Country 2024 & 2032
- Figure 10: South America Infrastructure Industry in India Revenue (Million), by Infrastructure segment 2024 & 2032
- Figure 11: South America Infrastructure Industry in India Revenue Share (%), by Infrastructure segment 2024 & 2032
- Figure 12: South America Infrastructure Industry in India Revenue (Million), by Key States 2024 & 2032
- Figure 13: South America Infrastructure Industry in India Revenue Share (%), by Key States 2024 & 2032
- Figure 14: South America Infrastructure Industry in India Revenue (Million), by Country 2024 & 2032
- Figure 15: South America Infrastructure Industry in India Revenue Share (%), by Country 2024 & 2032
- Figure 16: Europe Infrastructure Industry in India Revenue (Million), by Infrastructure segment 2024 & 2032
- Figure 17: Europe Infrastructure Industry in India Revenue Share (%), by Infrastructure segment 2024 & 2032
- Figure 18: Europe Infrastructure Industry in India Revenue (Million), by Key States 2024 & 2032
- Figure 19: Europe Infrastructure Industry in India Revenue Share (%), by Key States 2024 & 2032
- Figure 20: Europe Infrastructure Industry in India Revenue (Million), by Country 2024 & 2032
- Figure 21: Europe Infrastructure Industry in India Revenue Share (%), by Country 2024 & 2032
- Figure 22: Middle East & Africa Infrastructure Industry in India Revenue (Million), by Infrastructure segment 2024 & 2032
- Figure 23: Middle East & Africa Infrastructure Industry in India Revenue Share (%), by Infrastructure segment 2024 & 2032
- Figure 24: Middle East & Africa Infrastructure Industry in India Revenue (Million), by Key States 2024 & 2032
- Figure 25: Middle East & Africa Infrastructure Industry in India Revenue Share (%), by Key States 2024 & 2032
- Figure 26: Middle East & Africa Infrastructure Industry in India Revenue (Million), by Country 2024 & 2032
- Figure 27: Middle East & Africa Infrastructure Industry in India Revenue Share (%), by Country 2024 & 2032
- Figure 28: Asia Pacific Infrastructure Industry in India Revenue (Million), by Infrastructure segment 2024 & 2032
- Figure 29: Asia Pacific Infrastructure Industry in India Revenue Share (%), by Infrastructure segment 2024 & 2032
- Figure 30: Asia Pacific Infrastructure Industry in India Revenue (Million), by Key States 2024 & 2032
- Figure 31: Asia Pacific Infrastructure Industry in India Revenue Share (%), by Key States 2024 & 2032
- Figure 32: Asia Pacific Infrastructure Industry in India Revenue (Million), by Country 2024 & 2032
- Figure 33: Asia Pacific Infrastructure Industry in India Revenue Share (%), by Country 2024 & 2032
List of Tables
- Table 1: Global Infrastructure Industry in India Revenue Million Forecast, by Region 2019 & 2032
- Table 2: Global Infrastructure Industry in India Revenue Million Forecast, by Infrastructure segment 2019 & 2032
- Table 3: Global Infrastructure Industry in India Revenue Million Forecast, by Key States 2019 & 2032
- Table 4: Global Infrastructure Industry in India Revenue Million Forecast, by Region 2019 & 2032
- Table 5: Global Infrastructure Industry in India Revenue Million Forecast, by Country 2019 & 2032
- Table 6: North India Infrastructure Industry in India Revenue (Million) Forecast, by Application 2019 & 2032
- Table 7: South India Infrastructure Industry in India Revenue (Million) Forecast, by Application 2019 & 2032
- Table 8: East India Infrastructure Industry in India Revenue (Million) Forecast, by Application 2019 & 2032
- Table 9: West India Infrastructure Industry in India Revenue (Million) Forecast, by Application 2019 & 2032
- Table 10: Global Infrastructure Industry in India Revenue Million Forecast, by Infrastructure segment 2019 & 2032
- Table 11: Global Infrastructure Industry in India Revenue Million Forecast, by Key States 2019 & 2032
- Table 12: Global Infrastructure Industry in India Revenue Million Forecast, by Country 2019 & 2032
- Table 13: United States Infrastructure Industry in India Revenue (Million) Forecast, by Application 2019 & 2032
- Table 14: Canada Infrastructure Industry in India Revenue (Million) Forecast, by Application 2019 & 2032
- Table 15: Mexico Infrastructure Industry in India Revenue (Million) Forecast, by Application 2019 & 2032
- Table 16: Global Infrastructure Industry in India Revenue Million Forecast, by Infrastructure segment 2019 & 2032
- Table 17: Global Infrastructure Industry in India Revenue Million Forecast, by Key States 2019 & 2032
- Table 18: Global Infrastructure Industry in India Revenue Million Forecast, by Country 2019 & 2032
- Table 19: Brazil Infrastructure Industry in India Revenue (Million) Forecast, by Application 2019 & 2032
- Table 20: Argentina Infrastructure Industry in India Revenue (Million) Forecast, by Application 2019 & 2032
- Table 21: Rest of South America Infrastructure Industry in India Revenue (Million) Forecast, by Application 2019 & 2032
- Table 22: Global Infrastructure Industry in India Revenue Million Forecast, by Infrastructure segment 2019 & 2032
- Table 23: Global Infrastructure Industry in India Revenue Million Forecast, by Key States 2019 & 2032
- Table 24: Global Infrastructure Industry in India Revenue Million Forecast, by Country 2019 & 2032
- Table 25: United Kingdom Infrastructure Industry in India Revenue (Million) Forecast, by Application 2019 & 2032
- Table 26: Germany Infrastructure Industry in India Revenue (Million) Forecast, by Application 2019 & 2032
- Table 27: France Infrastructure Industry in India Revenue (Million) Forecast, by Application 2019 & 2032
- Table 28: Italy Infrastructure Industry in India Revenue (Million) Forecast, by Application 2019 & 2032
- Table 29: Spain Infrastructure Industry in India Revenue (Million) Forecast, by Application 2019 & 2032
- Table 30: Russia Infrastructure Industry in India Revenue (Million) Forecast, by Application 2019 & 2032
- Table 31: Benelux Infrastructure Industry in India Revenue (Million) Forecast, by Application 2019 & 2032
- Table 32: Nordics Infrastructure Industry in India Revenue (Million) Forecast, by Application 2019 & 2032
- Table 33: Rest of Europe Infrastructure Industry in India Revenue (Million) Forecast, by Application 2019 & 2032
- Table 34: Global Infrastructure Industry in India Revenue Million Forecast, by Infrastructure segment 2019 & 2032
- Table 35: Global Infrastructure Industry in India Revenue Million Forecast, by Key States 2019 & 2032
- Table 36: Global Infrastructure Industry in India Revenue Million Forecast, by Country 2019 & 2032
- Table 37: Turkey Infrastructure Industry in India Revenue (Million) Forecast, by Application 2019 & 2032
- Table 38: Israel Infrastructure Industry in India Revenue (Million) Forecast, by Application 2019 & 2032
- Table 39: GCC Infrastructure Industry in India Revenue (Million) Forecast, by Application 2019 & 2032
- Table 40: North Africa Infrastructure Industry in India Revenue (Million) Forecast, by Application 2019 & 2032
- Table 41: South Africa Infrastructure Industry in India Revenue (Million) Forecast, by Application 2019 & 2032
- Table 42: Rest of Middle East & Africa Infrastructure Industry in India Revenue (Million) Forecast, by Application 2019 & 2032
- Table 43: Global Infrastructure Industry in India Revenue Million Forecast, by Infrastructure segment 2019 & 2032
- Table 44: Global Infrastructure Industry in India Revenue Million Forecast, by Key States 2019 & 2032
- Table 45: Global Infrastructure Industry in India Revenue Million Forecast, by Country 2019 & 2032
- Table 46: China Infrastructure Industry in India Revenue (Million) Forecast, by Application 2019 & 2032
- Table 47: India Infrastructure Industry in India Revenue (Million) Forecast, by Application 2019 & 2032
- Table 48: Japan Infrastructure Industry in India Revenue (Million) Forecast, by Application 2019 & 2032
- Table 49: South Korea Infrastructure Industry in India Revenue (Million) Forecast, by Application 2019 & 2032
- Table 50: ASEAN Infrastructure Industry in India Revenue (Million) Forecast, by Application 2019 & 2032
- Table 51: Oceania Infrastructure Industry in India Revenue (Million) Forecast, by Application 2019 & 2032
- Table 52: Rest of Asia Pacific Infrastructure Industry in India Revenue (Million) Forecast, by Application 2019 & 2032
Frequently Asked Questions
1. What is the projected Compound Annual Growth Rate (CAGR) of the Infrastructure Industry in India?
The projected CAGR is approximately 9.57%.
2. Which companies are prominent players in the Infrastructure Industry in India?
Key companies in the market include Shapoorji Pallonji & Co Ltd, Lanco Infratech Limited, Hindustan Construction Co Ltd, Reliance Infrastructure Limited**List Not Exhaustive 6 3 Other Companie, Larsen & Toubro Limited, Gammon India Ltd, Tata Projects Ltd, Nagarjuna Construction Company Limited (NCC Ltd), Jaiprakash Associates Ltd, Simplex Infrastructures Ltd.
3. What are the main segments of the Infrastructure Industry in India?
The market segments include Infrastructure segment, Key States.
4. Can you provide details about the market size?
The market size is estimated to be USD 204.06 Million as of 2022.
5. What are some drivers contributing to market growth?
Rapid Urbanization is Driving the Market; Surge in Foreign Direct Investments is Driving the Market.
6. What are the notable trends driving market growth?
Increase in Road Infrastructure Investment is Expected to Propel the Market Growth.
7. Are there any restraints impacting market growth?
Bureaucratic Processes are Affecting the Market; Environmental Concerns and Regulatory Hurdles are Affecting the Market.
8. Can you provide examples of recent developments in the market?
February 2024: Tata Steel, a prominent private steel firm, unveiled its partnership with South Eastern Railway (SER). The collaboration aims to foster sustainable rail infrastructure by leveraging slag-based aggregates.
9. What pricing options are available for accessing the report?
Pricing options include single-user, multi-user, and enterprise licenses priced at USD 3800, USD 4500, and USD 5800 respectively.
10. Is the market size provided in terms of value or volume?
The market size is provided in terms of value, measured in Million.
11. Are there any specific market keywords associated with the report?
Yes, the market keyword associated with the report is "Infrastructure Industry in India," which aids in identifying and referencing the specific market segment covered.
12. How do I determine which pricing option suits my needs best?
The pricing options vary based on user requirements and access needs. Individual users may opt for single-user licenses, while businesses requiring broader access may choose multi-user or enterprise licenses for cost-effective access to the report.
13. Are there any additional resources or data provided in the Infrastructure Industry in India report?
While the report offers comprehensive insights, it's advisable to review the specific contents or supplementary materials provided to ascertain if additional resources or data are available.
14. How can I stay updated on further developments or reports in the Infrastructure Industry in India?
To stay informed about further developments, trends, and reports in the Infrastructure Industry in India, consider subscribing to industry newsletters, following relevant companies and organizations, or regularly checking reputable industry news sources and publications.
Methodology
Step 1 - Identification of Relevant Samples Size from Population Database


Step 2 - Approaches for Defining Global Market Size (Value, Volume* & Price*)

Note*: In applicable scenarios
Step 3 - Data Sources
Primary Research
- Web Analytics
- Survey Reports
- Research Institute
- Latest Research Reports
- Opinion Leaders
Secondary Research
- Annual Reports
- White Paper
- Latest Press Release
- Industry Association
- Paid Database
- Investor Presentations

Step 4 - Data Triangulation
Involves using different sources of information in order to increase the validity of a study
These sources are likely to be stakeholders in a program - participants, other researchers, program staff, other community members, and so on.
Then we put all data in single framework & apply various statistical tools to find out the dynamic on the market.
During the analysis stage, feedback from the stakeholder groups would be compared to determine areas of agreement as well as areas of divergence


