
Key Insights
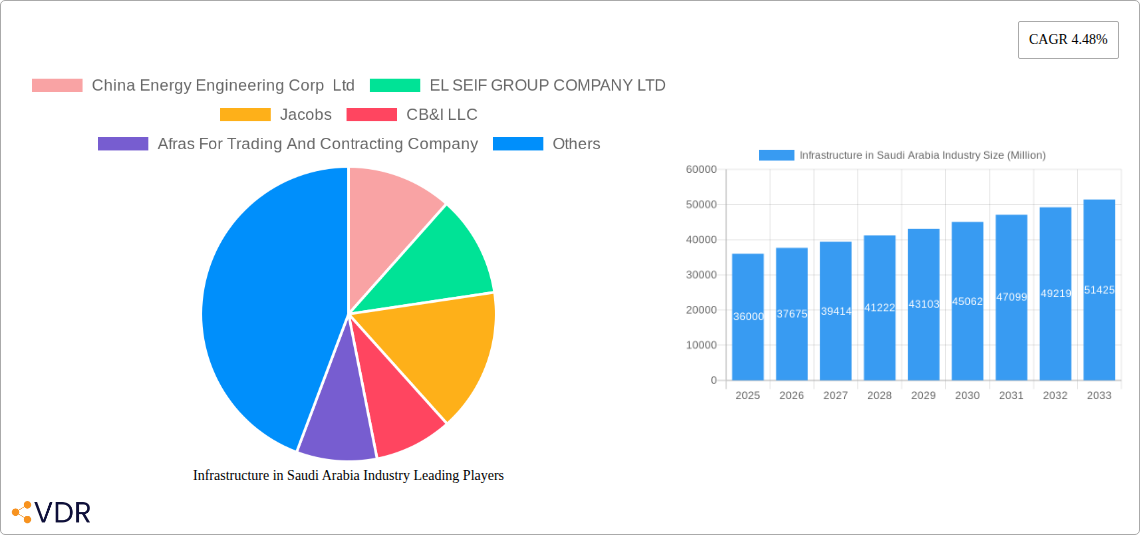
The Saudi Arabian infrastructure market, valued at $36 billion in 2025, is projected to experience robust growth, exhibiting a compound annual growth rate (CAGR) of 4.48% from 2025 to 2033. This expansion is fueled by substantial government investment in key sectors. Significant drivers include Vision 2030's ambitious diversification strategy, focusing on non-oil revenue streams through large-scale infrastructure development. This includes massive projects in transportation (roads, railways, airports), water management, and energy infrastructure to support a growing population and burgeoning economy. The increasing adoption of smart city technologies and sustainable infrastructure solutions further contributes to market momentum. While potential challenges like global economic fluctuations and material cost volatility exist, the long-term outlook remains positive, driven by consistent government spending and a commitment to modernizing the nation's infrastructure.
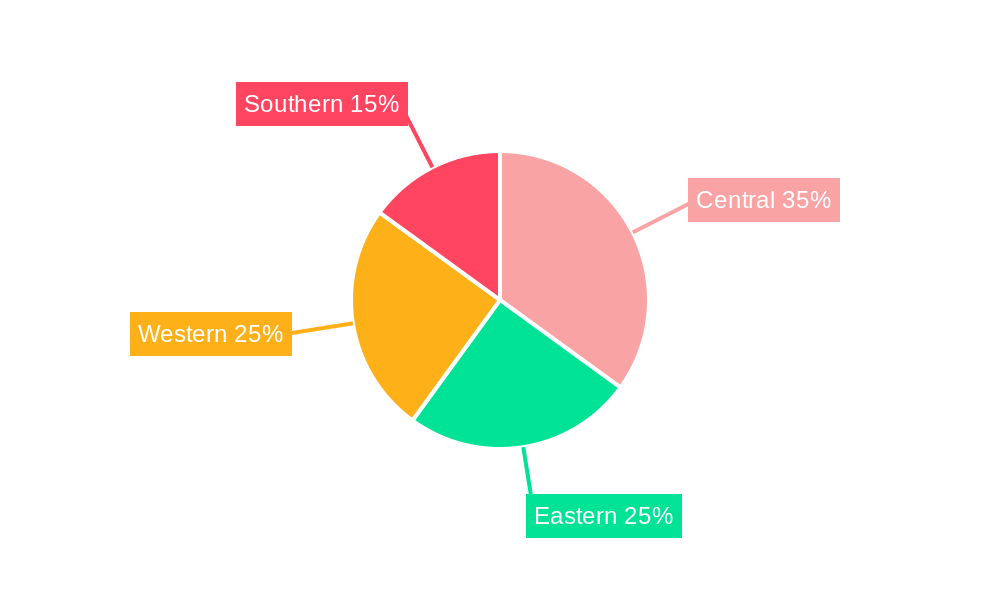
The market is segmented by infrastructure type, encompassing social infrastructure (e.g., hospitals, schools), transportation infrastructure (roads, railways, airports), water infrastructure (extraction, treatment, distribution), and telecoms infrastructure (manufacturing, deployment). Key players like China Energy Engineering Corp Ltd, Jacobs, Bechtel, and Samsung C&T are actively involved, competing for substantial project contracts. Regional distribution across Saudi Arabia (Central, Eastern, Western, Southern regions) reflects varied developmental priorities and project concentration. The forecast period (2025-2033) suggests continued growth, aligning with the nation's long-term economic vision and investment plans. This sustained investment will likely attract further foreign investment and technological advancements, solidifying Saudi Arabia's position as a major infrastructure market in the Middle East.
This comprehensive report provides a detailed analysis of the Infrastructure in Saudi Arabia industry, covering the period 2019-2033. It delves into market dynamics, growth trends, key players, and future opportunities, offering invaluable insights for industry professionals, investors, and strategic planners. The report utilizes a robust methodology, incorporating both qualitative and quantitative data to provide a holistic view of this rapidly evolving sector. Parent markets include the broader Middle Eastern construction and infrastructure market, while child markets encompass specific segments like transportation, water, and telecoms infrastructure.
Infrastructure in Saudi Arabia Industry Market Dynamics & Structure
This section analyzes the competitive landscape, technological advancements, regulatory environment, and market trends within the Saudi Arabian infrastructure sector. The study period covers 2019-2033, with 2025 serving as both the base and estimated year. The forecast period is 2025-2033, and the historical period is 2019-2024. The market size in 2025 is estimated at XXX Million.
- Market Concentration: The Saudi Arabian infrastructure market exhibits a moderately concentrated structure, with a few large players holding significant market share. The top 5 players account for approximately xx% of the total market revenue in 2025.
- Technological Innovation: Technological advancements, such as Building Information Modeling (BIM) and the adoption of smart city technologies, are driving efficiency and innovation in the sector. However, the pace of adoption varies across different segments and companies.
- Regulatory Framework: Government regulations and policies play a crucial role in shaping the industry. The Vision 2030 initiative, for instance, has significantly influenced infrastructure development.
- Competitive Product Substitutes: The availability of substitute materials and technologies presents challenges for some established players. The use of sustainable and cost-effective materials is growing.
- End-User Demographics: The primary end-users include government agencies, private developers, and multinational corporations. Government spending continues to be a key driver of market growth.
- M&A Trends: The past five years have witnessed a moderate level of mergers and acquisitions activity, with approximately xx deals recorded, primarily focused on expanding geographic reach and technological capabilities.
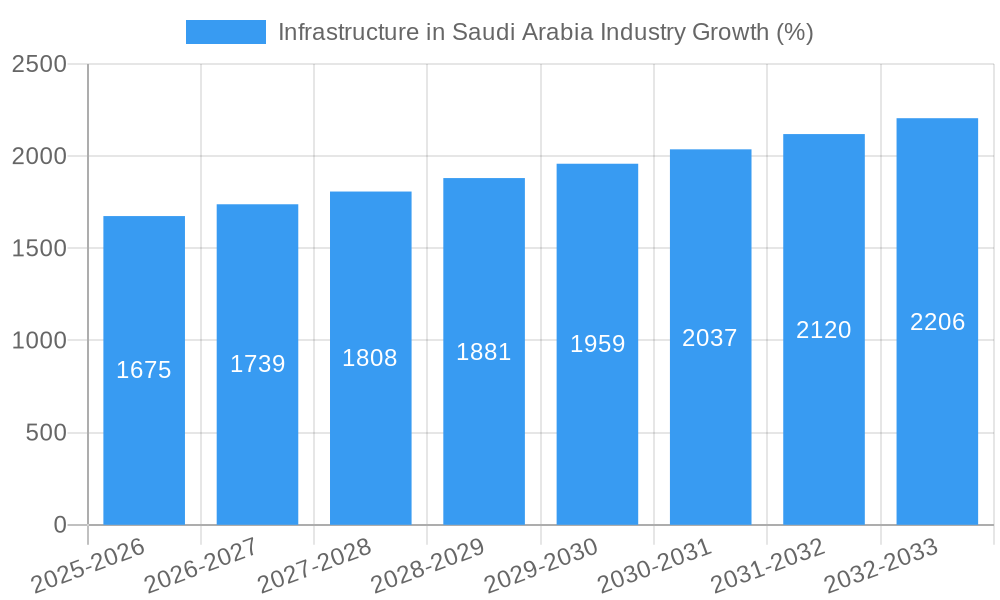
Infrastructure in Saudi Arabia Industry Growth Trends & Insights
This section details the growth trajectory of the Saudi Arabian infrastructure market, including market size evolution, adoption rates, and technological disruptions. The analysis uses a combination of primary and secondary research data, including government reports, industry publications, and financial statements of key players.
The Saudi Arabian infrastructure market witnessed substantial growth during the historical period (2019-2024), driven by significant investments in mega-projects and government initiatives. The market size experienced a CAGR of xx% from 2019 to 2024, reaching XXX Million in 2024. The forecast period (2025-2033) anticipates continued expansion, with a projected CAGR of xx%, reaching a market size of XXX Million by 2033. This growth is fueled by Vision 2030, which aims to diversify the Saudi economy and enhance infrastructure across various segments. Market penetration of advanced technologies, like IoT and AI in infrastructure management is also expected to increase significantly, contributing to market expansion. Shifts in consumer behavior, particularly towards sustainable infrastructure solutions, are also influencing industry growth.
Dominant Regions, Countries, or Segments in Infrastructure in Saudi Arabia Industry
This section identifies the leading regions, countries, or segments driving market growth within the Saudi Arabian infrastructure industry.
The transportation infrastructure segment is currently the dominant driver of market growth, accounting for approximately xx% of the total market value in 2025. This is largely due to massive investments in road networks, rail projects (like the Haramain High-Speed Railway), and airport expansions. Social infrastructure, particularly healthcare and educational facilities, is also experiencing significant growth, representing xx% of the market in 2025. This is driven by government initiatives to improve public services and living standards. The waterways and telecoms segments contribute xx% and xx% respectively to the overall market value in 2025. Growth within these segments is expected to accelerate in the coming years due to investments in water desalination and digital infrastructure expansion.
- Key Drivers:
- Government investment (Vision 2030)
- Mega-project development
- Urbanization and population growth
- Technological advancements
Infrastructure in Saudi Arabia Industry Product Landscape
The Saudi Arabian infrastructure market is characterized by a wide range of products and services, including construction materials, engineering services, and technological solutions. Recent innovations focus on sustainable and smart technologies, aiming to improve efficiency, reduce environmental impact, and enhance operational performance. The use of prefabricated building components and modular construction is gaining traction, driven by its efficiency and cost-effectiveness. Key performance metrics include project completion time, cost efficiency, and material durability.
Key Drivers, Barriers & Challenges in Infrastructure in Saudi Arabia Industry
Key Drivers:
Government investment in infrastructure, particularly under Vision 2030, is the primary driver, along with urbanization, population growth, and the increasing demand for improved transportation and social infrastructure. Technological advancements are increasing efficiency and reducing costs.
Key Challenges & Restraints:
- Supply Chain Disruptions: Global supply chain issues can lead to project delays and cost overruns (estimated impact: xx% increase in project costs in 2024).
- Regulatory Hurdles: Complex bureaucratic processes can slow down project approvals and implementation.
- Competitive Pressures: A relatively high degree of competition among both domestic and international players puts pressure on pricing and margins.
Emerging Opportunities in Infrastructure in Saudi Arabia Industry
Significant opportunities exist in the adoption of sustainable infrastructure technologies, smart city solutions, and the expansion of renewable energy infrastructure. Further, the development of specialized infrastructure for logistics and industrial zones presents a substantial growth area. Untapped markets include the development of rural infrastructure and the modernization of existing infrastructure.
Growth Accelerators in the Infrastructure in Saudi Arabia Industry Industry
Long-term growth is accelerated by ongoing government investments, technological breakthroughs in construction techniques and materials, and strategic partnerships between public and private entities. International collaboration and knowledge transfer further facilitate the development of sophisticated infrastructure projects. Expanding into new market segments, such as renewable energy and digital infrastructure, will also create new opportunities.
Key Players Shaping the Infrastructure in Saudi Arabia Industry Market
- China Energy Engineering Corp Ltd
- EL SEIF GROUP COMPANY LTD
- Jacobs
- CB&I LLC
- Afras For Trading And Contracting Company
- Fluor Corp
- Al Latifa Trading and Contracting
- Samsung C&T
- Bechtel
- Tekfen Construction and Installation Co Inc
- China Railway Construction Corp Ltd
- AL Jazirah Engineers & Consultants
Notable Milestones in Infrastructure in Saudi Arabia Industry Sector
- 2020-Q4: Launch of the NEOM project, a major driver of infrastructure development.
- 2021-Q2: Completion of a significant section of the Haramain High-Speed Railway.
- 2022-Q3: Announcement of major investments in renewable energy infrastructure.
In-Depth Infrastructure in Saudi Arabia Industry Market Outlook
The Saudi Arabian infrastructure market is poised for robust growth over the forecast period, driven by government spending, technological innovation, and population growth. Strategic opportunities lie in capitalizing on emerging trends such as sustainable construction, digitalization, and the development of specialized infrastructure to support various economic sectors. The market's future depends on effectively addressing challenges relating to supply chain resilience, regulatory efficiency, and maintaining a competitive edge in attracting both domestic and international investment.
Infrastructure in Saudi Arabia Industry Segmentation
-
1. Infrastructure segment
-
1.1. Social Infrastructure
- 1.1.1. Schools
- 1.1.2. Hospitals
- 1.1.3. Defence
- 1.1.4. Others
-
1.2. Transportation Infrastructure
- 1.2.1. Railways
- 1.2.2. Roadways
- 1.2.3. Airports
- 1.2.4. Waterways
-
1.3. Extraction Infrastructure
- 1.3.1. Power Generation
- 1.3.2. Electricity Transmission & Disribution
- 1.3.3. Gas
- 1.3.4. Telecoms
-
1.4. Manufacturing Infrastructure
- 1.4.1. Metal and Ore Production
- 1.4.2. Petroleum Refining
- 1.4.3. Chemical Manufacturing
- 1.4.4. Industrial Parks and clusters
-
1.1. Social Infrastructure
Infrastructure in Saudi Arabia Industry Segmentation By Geography
-
1. North America
- 1.1. United States
- 1.2. Canada
- 1.3. Mexico
-
2. South America
- 2.1. Brazil
- 2.2. Argentina
- 2.3. Rest of South America
-
3. Europe
- 3.1. United Kingdom
- 3.2. Germany
- 3.3. France
- 3.4. Italy
- 3.5. Spain
- 3.6. Russia
- 3.7. Benelux
- 3.8. Nordics
- 3.9. Rest of Europe
-
4. Middle East & Africa
- 4.1. Turkey
- 4.2. Israel
- 4.3. GCC
- 4.4. North Africa
- 4.5. South Africa
- 4.6. Rest of Middle East & Africa
-
5. Asia Pacific
- 5.1. China
- 5.2. India
- 5.3. Japan
- 5.4. South Korea
- 5.5. ASEAN
- 5.6. Oceania
- 5.7. Rest of Asia Pacific
Infrastructure in Saudi Arabia Industry REPORT HIGHLIGHTS
| Aspects | Details |
|---|---|
| Study Period | 2019-2033 |
| Base Year | 2024 |
| Estimated Year | 2025 |
| Forecast Period | 2025-2033 |
| Historical Period | 2019-2024 |
| Growth Rate | CAGR of 4.48% from 2019-2033 |
| Segmentation |
|
Table of Contents
- 1. Introduction
- 1.1. Research Scope
- 1.2. Market Segmentation
- 1.3. Research Methodology
- 1.4. Definitions and Assumptions
- 2. Executive Summary
- 2.1. Introduction
- 3. Market Dynamics
- 3.1. Introduction
- 3.2. Market Drivers
- 3.2.1. High demand with signs of increased residential project developments and buyers in the market; The growing population in Bahrain is driving the luxury residential real estate sector
- 3.3. Market Restrains
- 3.3.1. The Bahrain real estate sector has been growing at a slower pace in recent years; The increased cost of credit due to higher interest rates is starting to dent demand for luxury real estate in Bahrain
- 3.4. Market Trends
- 3.4.1. Growing Power sector
- 4. Market Factor Analysis
- 4.1. Porters Five Forces
- 4.2. Supply/Value Chain
- 4.3. PESTEL analysis
- 4.4. Market Entropy
- 4.5. Patent/Trademark Analysis
- 5. Global Infrastructure in Saudi Arabia Industry Analysis, Insights and Forecast, 2019-2031
- 5.1. Market Analysis, Insights and Forecast - by Infrastructure segment
- 5.1.1. Social Infrastructure
- 5.1.1.1. Schools
- 5.1.1.2. Hospitals
- 5.1.1.3. Defence
- 5.1.1.4. Others
- 5.1.2. Transportation Infrastructure
- 5.1.2.1. Railways
- 5.1.2.2. Roadways
- 5.1.2.3. Airports
- 5.1.2.4. Waterways
- 5.1.3. Extraction Infrastructure
- 5.1.3.1. Power Generation
- 5.1.3.2. Electricity Transmission & Disribution
- 5.1.3.3. Gas
- 5.1.3.4. Telecoms
- 5.1.4. Manufacturing Infrastructure
- 5.1.4.1. Metal and Ore Production
- 5.1.4.2. Petroleum Refining
- 5.1.4.3. Chemical Manufacturing
- 5.1.4.4. Industrial Parks and clusters
- 5.1.1. Social Infrastructure
- 5.2. Market Analysis, Insights and Forecast - by Region
- 5.2.1. North America
- 5.2.2. South America
- 5.2.3. Europe
- 5.2.4. Middle East & Africa
- 5.2.5. Asia Pacific
- 5.1. Market Analysis, Insights and Forecast - by Infrastructure segment
- 6. North America Infrastructure in Saudi Arabia Industry Analysis, Insights and Forecast, 2019-2031
- 6.1. Market Analysis, Insights and Forecast - by Infrastructure segment
- 6.1.1. Social Infrastructure
- 6.1.1.1. Schools
- 6.1.1.2. Hospitals
- 6.1.1.3. Defence
- 6.1.1.4. Others
- 6.1.2. Transportation Infrastructure
- 6.1.2.1. Railways
- 6.1.2.2. Roadways
- 6.1.2.3. Airports
- 6.1.2.4. Waterways
- 6.1.3. Extraction Infrastructure
- 6.1.3.1. Power Generation
- 6.1.3.2. Electricity Transmission & Disribution
- 6.1.3.3. Gas
- 6.1.3.4. Telecoms
- 6.1.4. Manufacturing Infrastructure
- 6.1.4.1. Metal and Ore Production
- 6.1.4.2. Petroleum Refining
- 6.1.4.3. Chemical Manufacturing
- 6.1.4.4. Industrial Parks and clusters
- 6.1.1. Social Infrastructure
- 6.1. Market Analysis, Insights and Forecast - by Infrastructure segment
- 7. South America Infrastructure in Saudi Arabia Industry Analysis, Insights and Forecast, 2019-2031
- 7.1. Market Analysis, Insights and Forecast - by Infrastructure segment
- 7.1.1. Social Infrastructure
- 7.1.1.1. Schools
- 7.1.1.2. Hospitals
- 7.1.1.3. Defence
- 7.1.1.4. Others
- 7.1.2. Transportation Infrastructure
- 7.1.2.1. Railways
- 7.1.2.2. Roadways
- 7.1.2.3. Airports
- 7.1.2.4. Waterways
- 7.1.3. Extraction Infrastructure
- 7.1.3.1. Power Generation
- 7.1.3.2. Electricity Transmission & Disribution
- 7.1.3.3. Gas
- 7.1.3.4. Telecoms
- 7.1.4. Manufacturing Infrastructure
- 7.1.4.1. Metal and Ore Production
- 7.1.4.2. Petroleum Refining
- 7.1.4.3. Chemical Manufacturing
- 7.1.4.4. Industrial Parks and clusters
- 7.1.1. Social Infrastructure
- 7.1. Market Analysis, Insights and Forecast - by Infrastructure segment
- 8. Europe Infrastructure in Saudi Arabia Industry Analysis, Insights and Forecast, 2019-2031
- 8.1. Market Analysis, Insights and Forecast - by Infrastructure segment
- 8.1.1. Social Infrastructure
- 8.1.1.1. Schools
- 8.1.1.2. Hospitals
- 8.1.1.3. Defence
- 8.1.1.4. Others
- 8.1.2. Transportation Infrastructure
- 8.1.2.1. Railways
- 8.1.2.2. Roadways
- 8.1.2.3. Airports
- 8.1.2.4. Waterways
- 8.1.3. Extraction Infrastructure
- 8.1.3.1. Power Generation
- 8.1.3.2. Electricity Transmission & Disribution
- 8.1.3.3. Gas
- 8.1.3.4. Telecoms
- 8.1.4. Manufacturing Infrastructure
- 8.1.4.1. Metal and Ore Production
- 8.1.4.2. Petroleum Refining
- 8.1.4.3. Chemical Manufacturing
- 8.1.4.4. Industrial Parks and clusters
- 8.1.1. Social Infrastructure
- 8.1. Market Analysis, Insights and Forecast - by Infrastructure segment
- 9. Middle East & Africa Infrastructure in Saudi Arabia Industry Analysis, Insights and Forecast, 2019-2031
- 9.1. Market Analysis, Insights and Forecast - by Infrastructure segment
- 9.1.1. Social Infrastructure
- 9.1.1.1. Schools
- 9.1.1.2. Hospitals
- 9.1.1.3. Defence
- 9.1.1.4. Others
- 9.1.2. Transportation Infrastructure
- 9.1.2.1. Railways
- 9.1.2.2. Roadways
- 9.1.2.3. Airports
- 9.1.2.4. Waterways
- 9.1.3. Extraction Infrastructure
- 9.1.3.1. Power Generation
- 9.1.3.2. Electricity Transmission & Disribution
- 9.1.3.3. Gas
- 9.1.3.4. Telecoms
- 9.1.4. Manufacturing Infrastructure
- 9.1.4.1. Metal and Ore Production
- 9.1.4.2. Petroleum Refining
- 9.1.4.3. Chemical Manufacturing
- 9.1.4.4. Industrial Parks and clusters
- 9.1.1. Social Infrastructure
- 9.1. Market Analysis, Insights and Forecast - by Infrastructure segment
- 10. Asia Pacific Infrastructure in Saudi Arabia Industry Analysis, Insights and Forecast, 2019-2031
- 10.1. Market Analysis, Insights and Forecast - by Infrastructure segment
- 10.1.1. Social Infrastructure
- 10.1.1.1. Schools
- 10.1.1.2. Hospitals
- 10.1.1.3. Defence
- 10.1.1.4. Others
- 10.1.2. Transportation Infrastructure
- 10.1.2.1. Railways
- 10.1.2.2. Roadways
- 10.1.2.3. Airports
- 10.1.2.4. Waterways
- 10.1.3. Extraction Infrastructure
- 10.1.3.1. Power Generation
- 10.1.3.2. Electricity Transmission & Disribution
- 10.1.3.3. Gas
- 10.1.3.4. Telecoms
- 10.1.4. Manufacturing Infrastructure
- 10.1.4.1. Metal and Ore Production
- 10.1.4.2. Petroleum Refining
- 10.1.4.3. Chemical Manufacturing
- 10.1.4.4. Industrial Parks and clusters
- 10.1.1. Social Infrastructure
- 10.1. Market Analysis, Insights and Forecast - by Infrastructure segment
- 11. Central Infrastructure in Saudi Arabia Industry Analysis, Insights and Forecast, 2019-2031
- 12. Eastern Infrastructure in Saudi Arabia Industry Analysis, Insights and Forecast, 2019-2031
- 13. Western Infrastructure in Saudi Arabia Industry Analysis, Insights and Forecast, 2019-2031
- 14. Southern Infrastructure in Saudi Arabia Industry Analysis, Insights and Forecast, 2019-2031
- 15. Competitive Analysis
- 15.1. Global Market Share Analysis 2024
- 15.2. Company Profiles
- 15.2.1 China Energy Engineering Corp Ltd
- 15.2.1.1. Overview
- 15.2.1.2. Products
- 15.2.1.3. SWOT Analysis
- 15.2.1.4. Recent Developments
- 15.2.1.5. Financials (Based on Availability)
- 15.2.2 EL SEIF GROUP COMPANY LTD
- 15.2.2.1. Overview
- 15.2.2.2. Products
- 15.2.2.3. SWOT Analysis
- 15.2.2.4. Recent Developments
- 15.2.2.5. Financials (Based on Availability)
- 15.2.3 Jacobs
- 15.2.3.1. Overview
- 15.2.3.2. Products
- 15.2.3.3. SWOT Analysis
- 15.2.3.4. Recent Developments
- 15.2.3.5. Financials (Based on Availability)
- 15.2.4 CB&I LLC
- 15.2.4.1. Overview
- 15.2.4.2. Products
- 15.2.4.3. SWOT Analysis
- 15.2.4.4. Recent Developments
- 15.2.4.5. Financials (Based on Availability)
- 15.2.5 Afras For Trading And Contracting Company
- 15.2.5.1. Overview
- 15.2.5.2. Products
- 15.2.5.3. SWOT Analysis
- 15.2.5.4. Recent Developments
- 15.2.5.5. Financials (Based on Availability)
- 15.2.6 Fluor Corp
- 15.2.6.1. Overview
- 15.2.6.2. Products
- 15.2.6.3. SWOT Analysis
- 15.2.6.4. Recent Developments
- 15.2.6.5. Financials (Based on Availability)
- 15.2.7 Al Latifa Trading and Contracting
- 15.2.7.1. Overview
- 15.2.7.2. Products
- 15.2.7.3. SWOT Analysis
- 15.2.7.4. Recent Developments
- 15.2.7.5. Financials (Based on Availability)
- 15.2.8 Samsung C&T**List Not Exhaustive
- 15.2.8.1. Overview
- 15.2.8.2. Products
- 15.2.8.3. SWOT Analysis
- 15.2.8.4. Recent Developments
- 15.2.8.5. Financials (Based on Availability)
- 15.2.9 Bechtel
- 15.2.9.1. Overview
- 15.2.9.2. Products
- 15.2.9.3. SWOT Analysis
- 15.2.9.4. Recent Developments
- 15.2.9.5. Financials (Based on Availability)
- 15.2.10 Tekfen Construction and Installation Co Inc
- 15.2.10.1. Overview
- 15.2.10.2. Products
- 15.2.10.3. SWOT Analysis
- 15.2.10.4. Recent Developments
- 15.2.10.5. Financials (Based on Availability)
- 15.2.11 China Railway Construction Corp Ltd
- 15.2.11.1. Overview
- 15.2.11.2. Products
- 15.2.11.3. SWOT Analysis
- 15.2.11.4. Recent Developments
- 15.2.11.5. Financials (Based on Availability)
- 15.2.12 AL Jazirah Engineers & Consultants
- 15.2.12.1. Overview
- 15.2.12.2. Products
- 15.2.12.3. SWOT Analysis
- 15.2.12.4. Recent Developments
- 15.2.12.5. Financials (Based on Availability)
- 15.2.1 China Energy Engineering Corp Ltd
List of Figures
- Figure 1: Global Infrastructure in Saudi Arabia Industry Revenue Breakdown (Million, %) by Region 2024 & 2032
- Figure 2: Saudi Arabia Infrastructure in Saudi Arabia Industry Revenue (Million), by Country 2024 & 2032
- Figure 3: Saudi Arabia Infrastructure in Saudi Arabia Industry Revenue Share (%), by Country 2024 & 2032
- Figure 4: North America Infrastructure in Saudi Arabia Industry Revenue (Million), by Infrastructure segment 2024 & 2032
- Figure 5: North America Infrastructure in Saudi Arabia Industry Revenue Share (%), by Infrastructure segment 2024 & 2032
- Figure 6: North America Infrastructure in Saudi Arabia Industry Revenue (Million), by Country 2024 & 2032
- Figure 7: North America Infrastructure in Saudi Arabia Industry Revenue Share (%), by Country 2024 & 2032
- Figure 8: South America Infrastructure in Saudi Arabia Industry Revenue (Million), by Infrastructure segment 2024 & 2032
- Figure 9: South America Infrastructure in Saudi Arabia Industry Revenue Share (%), by Infrastructure segment 2024 & 2032
- Figure 10: South America Infrastructure in Saudi Arabia Industry Revenue (Million), by Country 2024 & 2032
- Figure 11: South America Infrastructure in Saudi Arabia Industry Revenue Share (%), by Country 2024 & 2032
- Figure 12: Europe Infrastructure in Saudi Arabia Industry Revenue (Million), by Infrastructure segment 2024 & 2032
- Figure 13: Europe Infrastructure in Saudi Arabia Industry Revenue Share (%), by Infrastructure segment 2024 & 2032
- Figure 14: Europe Infrastructure in Saudi Arabia Industry Revenue (Million), by Country 2024 & 2032
- Figure 15: Europe Infrastructure in Saudi Arabia Industry Revenue Share (%), by Country 2024 & 2032
- Figure 16: Middle East & Africa Infrastructure in Saudi Arabia Industry Revenue (Million), by Infrastructure segment 2024 & 2032
- Figure 17: Middle East & Africa Infrastructure in Saudi Arabia Industry Revenue Share (%), by Infrastructure segment 2024 & 2032
- Figure 18: Middle East & Africa Infrastructure in Saudi Arabia Industry Revenue (Million), by Country 2024 & 2032
- Figure 19: Middle East & Africa Infrastructure in Saudi Arabia Industry Revenue Share (%), by Country 2024 & 2032
- Figure 20: Asia Pacific Infrastructure in Saudi Arabia Industry Revenue (Million), by Infrastructure segment 2024 & 2032
- Figure 21: Asia Pacific Infrastructure in Saudi Arabia Industry Revenue Share (%), by Infrastructure segment 2024 & 2032
- Figure 22: Asia Pacific Infrastructure in Saudi Arabia Industry Revenue (Million), by Country 2024 & 2032
- Figure 23: Asia Pacific Infrastructure in Saudi Arabia Industry Revenue Share (%), by Country 2024 & 2032
List of Tables
- Table 1: Global Infrastructure in Saudi Arabia Industry Revenue Million Forecast, by Region 2019 & 2032
- Table 2: Global Infrastructure in Saudi Arabia Industry Revenue Million Forecast, by Infrastructure segment 2019 & 2032
- Table 3: Global Infrastructure in Saudi Arabia Industry Revenue Million Forecast, by Region 2019 & 2032
- Table 4: Global Infrastructure in Saudi Arabia Industry Revenue Million Forecast, by Country 2019 & 2032
- Table 5: Central Infrastructure in Saudi Arabia Industry Revenue (Million) Forecast, by Application 2019 & 2032
- Table 6: Eastern Infrastructure in Saudi Arabia Industry Revenue (Million) Forecast, by Application 2019 & 2032
- Table 7: Western Infrastructure in Saudi Arabia Industry Revenue (Million) Forecast, by Application 2019 & 2032
- Table 8: Southern Infrastructure in Saudi Arabia Industry Revenue (Million) Forecast, by Application 2019 & 2032
- Table 9: Global Infrastructure in Saudi Arabia Industry Revenue Million Forecast, by Infrastructure segment 2019 & 2032
- Table 10: Global Infrastructure in Saudi Arabia Industry Revenue Million Forecast, by Country 2019 & 2032
- Table 11: United States Infrastructure in Saudi Arabia Industry Revenue (Million) Forecast, by Application 2019 & 2032
- Table 12: Canada Infrastructure in Saudi Arabia Industry Revenue (Million) Forecast, by Application 2019 & 2032
- Table 13: Mexico Infrastructure in Saudi Arabia Industry Revenue (Million) Forecast, by Application 2019 & 2032
- Table 14: Global Infrastructure in Saudi Arabia Industry Revenue Million Forecast, by Infrastructure segment 2019 & 2032
- Table 15: Global Infrastructure in Saudi Arabia Industry Revenue Million Forecast, by Country 2019 & 2032
- Table 16: Brazil Infrastructure in Saudi Arabia Industry Revenue (Million) Forecast, by Application 2019 & 2032
- Table 17: Argentina Infrastructure in Saudi Arabia Industry Revenue (Million) Forecast, by Application 2019 & 2032
- Table 18: Rest of South America Infrastructure in Saudi Arabia Industry Revenue (Million) Forecast, by Application 2019 & 2032
- Table 19: Global Infrastructure in Saudi Arabia Industry Revenue Million Forecast, by Infrastructure segment 2019 & 2032
- Table 20: Global Infrastructure in Saudi Arabia Industry Revenue Million Forecast, by Country 2019 & 2032
- Table 21: United Kingdom Infrastructure in Saudi Arabia Industry Revenue (Million) Forecast, by Application 2019 & 2032
- Table 22: Germany Infrastructure in Saudi Arabia Industry Revenue (Million) Forecast, by Application 2019 & 2032
- Table 23: France Infrastructure in Saudi Arabia Industry Revenue (Million) Forecast, by Application 2019 & 2032
- Table 24: Italy Infrastructure in Saudi Arabia Industry Revenue (Million) Forecast, by Application 2019 & 2032
- Table 25: Spain Infrastructure in Saudi Arabia Industry Revenue (Million) Forecast, by Application 2019 & 2032
- Table 26: Russia Infrastructure in Saudi Arabia Industry Revenue (Million) Forecast, by Application 2019 & 2032
- Table 27: Benelux Infrastructure in Saudi Arabia Industry Revenue (Million) Forecast, by Application 2019 & 2032
- Table 28: Nordics Infrastructure in Saudi Arabia Industry Revenue (Million) Forecast, by Application 2019 & 2032
- Table 29: Rest of Europe Infrastructure in Saudi Arabia Industry Revenue (Million) Forecast, by Application 2019 & 2032
- Table 30: Global Infrastructure in Saudi Arabia Industry Revenue Million Forecast, by Infrastructure segment 2019 & 2032
- Table 31: Global Infrastructure in Saudi Arabia Industry Revenue Million Forecast, by Country 2019 & 2032
- Table 32: Turkey Infrastructure in Saudi Arabia Industry Revenue (Million) Forecast, by Application 2019 & 2032
- Table 33: Israel Infrastructure in Saudi Arabia Industry Revenue (Million) Forecast, by Application 2019 & 2032
- Table 34: GCC Infrastructure in Saudi Arabia Industry Revenue (Million) Forecast, by Application 2019 & 2032
- Table 35: North Africa Infrastructure in Saudi Arabia Industry Revenue (Million) Forecast, by Application 2019 & 2032
- Table 36: South Africa Infrastructure in Saudi Arabia Industry Revenue (Million) Forecast, by Application 2019 & 2032
- Table 37: Rest of Middle East & Africa Infrastructure in Saudi Arabia Industry Revenue (Million) Forecast, by Application 2019 & 2032
- Table 38: Global Infrastructure in Saudi Arabia Industry Revenue Million Forecast, by Infrastructure segment 2019 & 2032
- Table 39: Global Infrastructure in Saudi Arabia Industry Revenue Million Forecast, by Country 2019 & 2032
- Table 40: China Infrastructure in Saudi Arabia Industry Revenue (Million) Forecast, by Application 2019 & 2032
- Table 41: India Infrastructure in Saudi Arabia Industry Revenue (Million) Forecast, by Application 2019 & 2032
- Table 42: Japan Infrastructure in Saudi Arabia Industry Revenue (Million) Forecast, by Application 2019 & 2032
- Table 43: South Korea Infrastructure in Saudi Arabia Industry Revenue (Million) Forecast, by Application 2019 & 2032
- Table 44: ASEAN Infrastructure in Saudi Arabia Industry Revenue (Million) Forecast, by Application 2019 & 2032
- Table 45: Oceania Infrastructure in Saudi Arabia Industry Revenue (Million) Forecast, by Application 2019 & 2032
- Table 46: Rest of Asia Pacific Infrastructure in Saudi Arabia Industry Revenue (Million) Forecast, by Application 2019 & 2032
Frequently Asked Questions
1. What is the projected Compound Annual Growth Rate (CAGR) of the Infrastructure in Saudi Arabia Industry?
The projected CAGR is approximately 4.48%.
2. Which companies are prominent players in the Infrastructure in Saudi Arabia Industry?
Key companies in the market include China Energy Engineering Corp Ltd, EL SEIF GROUP COMPANY LTD, Jacobs, CB&I LLC, Afras For Trading And Contracting Company, Fluor Corp, Al Latifa Trading and Contracting, Samsung C&T**List Not Exhaustive, Bechtel, Tekfen Construction and Installation Co Inc, China Railway Construction Corp Ltd, AL Jazirah Engineers & Consultants.
3. What are the main segments of the Infrastructure in Saudi Arabia Industry?
The market segments include Infrastructure segment.
4. Can you provide details about the market size?
The market size is estimated to be USD 36.00 Million as of 2022.
5. What are some drivers contributing to market growth?
High demand with signs of increased residential project developments and buyers in the market; The growing population in Bahrain is driving the luxury residential real estate sector.
6. What are the notable trends driving market growth?
Growing Power sector:.
7. Are there any restraints impacting market growth?
The Bahrain real estate sector has been growing at a slower pace in recent years; The increased cost of credit due to higher interest rates is starting to dent demand for luxury real estate in Bahrain.
8. Can you provide examples of recent developments in the market?
N/A
9. What pricing options are available for accessing the report?
Pricing options include single-user, multi-user, and enterprise licenses priced at USD 3800, USD 4500, and USD 5800 respectively.
10. Is the market size provided in terms of value or volume?
The market size is provided in terms of value, measured in Million.
11. Are there any specific market keywords associated with the report?
Yes, the market keyword associated with the report is "Infrastructure in Saudi Arabia Industry," which aids in identifying and referencing the specific market segment covered.
12. How do I determine which pricing option suits my needs best?
The pricing options vary based on user requirements and access needs. Individual users may opt for single-user licenses, while businesses requiring broader access may choose multi-user or enterprise licenses for cost-effective access to the report.
13. Are there any additional resources or data provided in the Infrastructure in Saudi Arabia Industry report?
While the report offers comprehensive insights, it's advisable to review the specific contents or supplementary materials provided to ascertain if additional resources or data are available.
14. How can I stay updated on further developments or reports in the Infrastructure in Saudi Arabia Industry?
To stay informed about further developments, trends, and reports in the Infrastructure in Saudi Arabia Industry, consider subscribing to industry newsletters, following relevant companies and organizations, or regularly checking reputable industry news sources and publications.
Methodology
Step 1 - Identification of Relevant Samples Size from Population Database


Step 2 - Approaches for Defining Global Market Size (Value, Volume* & Price*)

Note*: In applicable scenarios
Step 3 - Data Sources
Primary Research
- Web Analytics
- Survey Reports
- Research Institute
- Latest Research Reports
- Opinion Leaders
Secondary Research
- Annual Reports
- White Paper
- Latest Press Release
- Industry Association
- Paid Database
- Investor Presentations

Step 4 - Data Triangulation
Involves using different sources of information in order to increase the validity of a study
These sources are likely to be stakeholders in a program - participants, other researchers, program staff, other community members, and so on.
Then we put all data in single framework & apply various statistical tools to find out the dynamic on the market.
During the analysis stage, feedback from the stakeholder groups would be compared to determine areas of agreement as well as areas of divergence


