
Key Insights
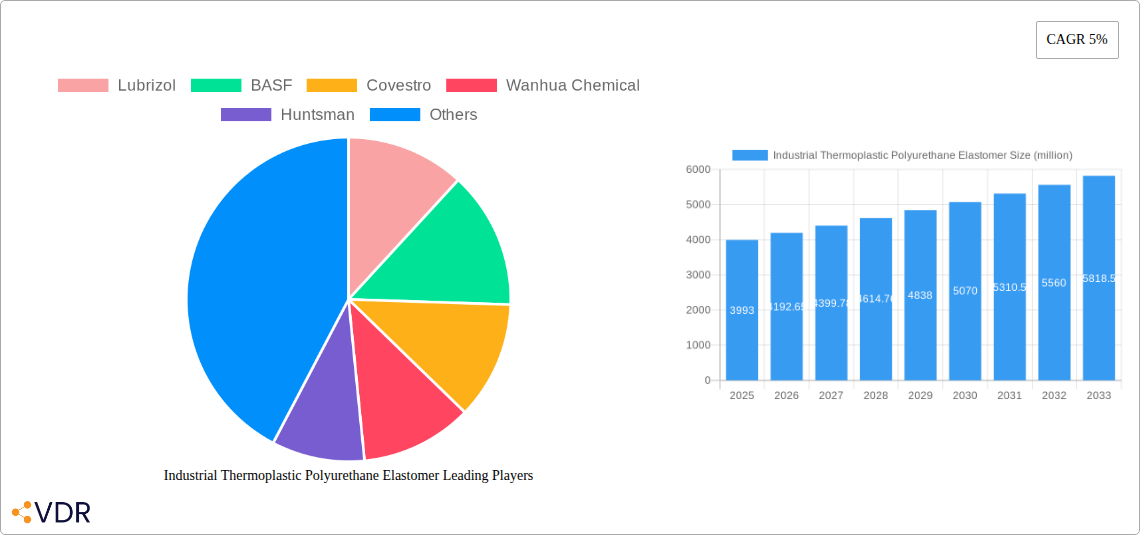
The global industrial thermoplastic polyurethane (TPU) elastomer market, valued at approximately $3.993 billion in 2025, is projected to experience steady growth, driven by increasing demand across diverse industrial sectors. The 5% CAGR suggests a substantial market expansion through 2033. Key drivers include the rising adoption of TPU elastomers in automotive applications (e.g., hoses, seals, and bumpers) due to their superior durability, flexibility, and resistance to harsh environments. The growing demand for lightweight and high-performance materials in various industries, including manufacturing, construction, and electronics, further fuels market growth. Technological advancements leading to improved TPU formulations with enhanced properties (such as abrasion resistance and chemical inertness) are also significant contributors. While potential supply chain disruptions and fluctuations in raw material prices could pose challenges, the overall market outlook remains positive, driven by ongoing innovation and expansion into new application areas. Strong growth is anticipated in regions with rapidly developing manufacturing sectors, including Asia-Pacific and emerging economies in South America and Africa.
The competitive landscape is marked by the presence of both established global players such as Lubrizol, BASF, Covestro, and Huntsman, and regional manufacturers. These companies are actively investing in research and development to expand their TPU product portfolios and cater to specific industry needs. The market is witnessing increasing consolidation, with mergers and acquisitions becoming a common strategy for enhancing market share and technological capabilities. Furthermore, the growing focus on sustainability and the development of bio-based TPUs are expected to shape future market dynamics, presenting both opportunities and challenges for industry participants. The continued growth of e-commerce and increased demand for durable consumer goods are also indirectly contributing factors to the expanding market.
Industrial Thermoplastic Polyurethane Elastomer (TPU) Market Report: 2019-2033
This comprehensive report provides a detailed analysis of the global Industrial Thermoplastic Polyurethane Elastomer (TPU) market, offering invaluable insights for industry professionals, investors, and strategic decision-makers. Covering the period 2019-2033, with a focus on 2025, this report unveils market dynamics, growth trends, and future opportunities within the parent market of industrial polymers and the child market of elastomers. The report is segmented by key players, regions, and applications, delivering a granular understanding of this dynamic sector. The market size is presented in million units throughout the report.
Industrial Thermoplastic Polyurethane Elastomer Market Dynamics & Structure
This section analyzes the competitive landscape, technological advancements, regulatory influences, and market trends within the Industrial TPU market. We examine market concentration, identifying key players and their market share percentages (e.g., BASF holding xx%, Lubrizol xx%, Covestro xx%, etc.). We evaluate the impact of mergers and acquisitions (M&A), with analysis of deal volume and impact on market structure during the historical period (2019-2024) showing xx deals. Technological innovation drivers are assessed, including advancements in TPU formulations and processing technologies, while regulatory frameworks (e.g., REACH, RoHS) and the presence of competitive substitutes are explored. End-user demographics are analyzed, identifying key industries and their consumption patterns.
- Market Concentration: High, with a few major players dominating the market.
- Technological Innovation: Strong focus on bio-based TPUs and improved sustainability.
- Regulatory Framework: Significant impact on material selection and production processes.
- Competitive Substitutes: Thermoplastic elastomers (TPEs) and other elastomeric materials.
- M&A Activity: Moderate activity observed, primarily focused on expanding product portfolios and geographical reach.
- Innovation Barriers: High capital investment needed for new TPU production lines.
Industrial Thermoplastic Polyurethane Elastomer Growth Trends & Insights
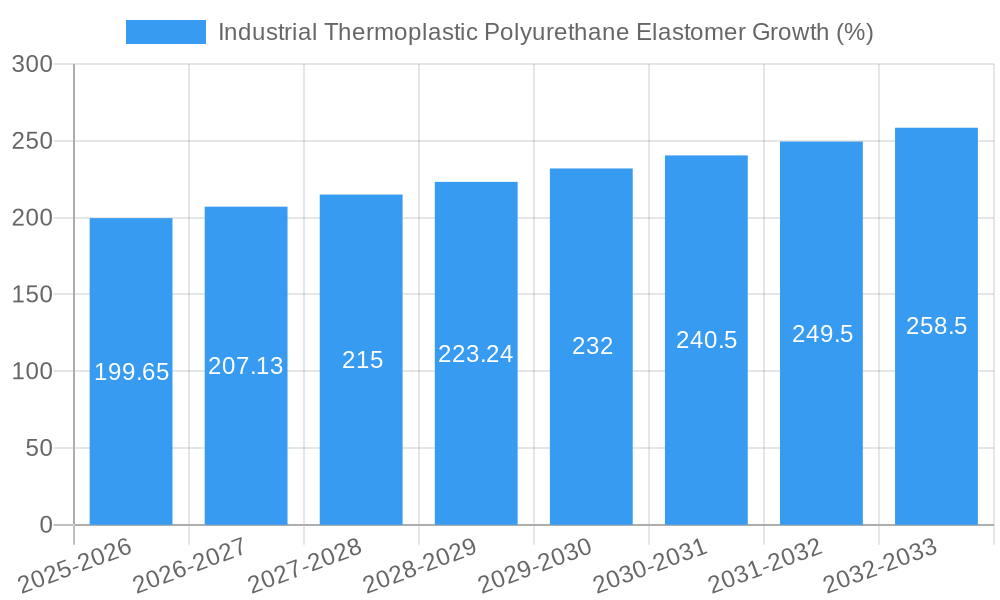
Leveraging extensive market research data, this section meticulously analyzes the evolution of the Industrial TPU market size from 2019 to 2033. We project a Compound Annual Growth Rate (CAGR) of xx% during the forecast period (2025-2033), driven by factors such as increasing demand from automotive, healthcare, and industrial automation sectors. We explore adoption rates in key industries and analyze the impact of technological disruptions, like the rise of additive manufacturing, on market dynamics. Consumer behavior shifts and the influence of sustainability concerns on purchasing decisions are discussed. Market penetration rate in key segments is estimated at xx% in 2025, projected to reach xx% by 2033.
Dominant Regions, Countries, or Segments in Industrial Thermoplastic Polyurethane Elastomer
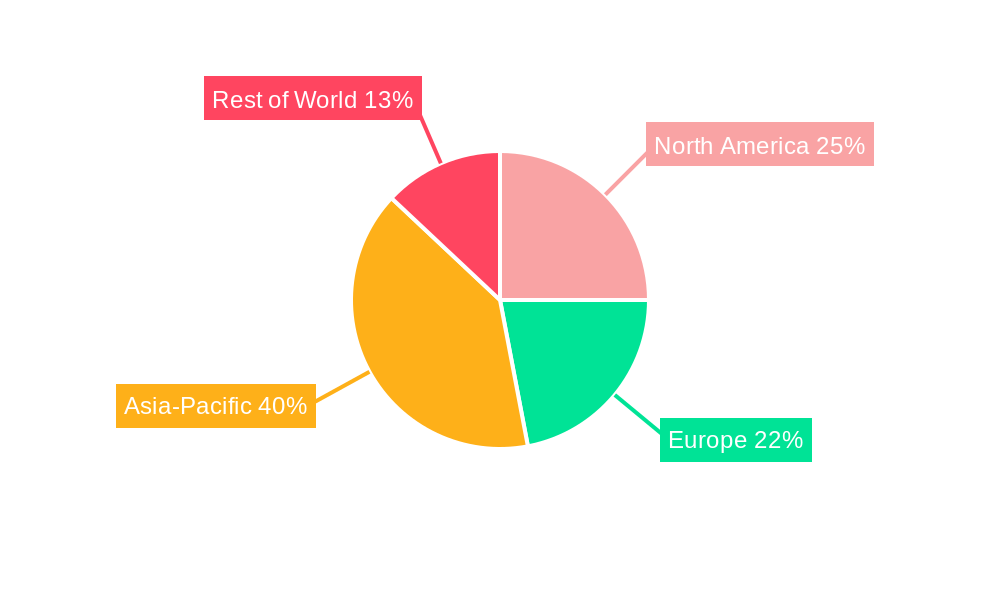
This section pinpoints the leading geographical regions and market segments driving Industrial TPU market growth. Detailed analysis reveals the factors contributing to regional dominance, including economic policies, infrastructure development, and industrial activity. We present market share data for each region (e.g., Asia-Pacific holding xx%, Europe xx%, North America xx%, etc.), highlighting growth potential and future trends. Key drivers in the dominant region are outlined below:
- Economic Growth: Strong GDP growth in key regions fuels demand.
- Infrastructure Development: Expansion of industrial infrastructure supports growth.
- Government Policies: Supportive policies promoting industrialization and sustainability.
Industrial Thermoplastic Polyurethane Elastomer Product Landscape
The Industrial TPU market offers a range of products with varying properties tailored to specific applications. This section details product innovations and highlights unique selling propositions, such as improved abrasion resistance, flexibility, and biodegradability. Technological advancements, including the development of high-performance TPUs and customized formulations, are discussed. Applications span various sectors, encompassing automotive parts (e.g., seals, hoses), medical devices, footwear, and industrial components.
Key Drivers, Barriers & Challenges in Industrial Thermoplastic Polyurethane Elastomer
Key Drivers: The increasing demand for durable, flexible, and chemically resistant materials across diverse industries is a primary driver. Technological advancements, such as improved processing techniques and the development of novel TPU formulations, further fuel market growth. Favorable government policies in several regions are also contributing to market expansion.
Key Barriers and Challenges: Fluctuations in raw material prices, particularly for diisocyanates and polyols, present a significant challenge. Stringent environmental regulations and growing concerns about sustainability can impact production costs and product formulations. Intense competition from alternative materials also puts pressure on margins. Supply chain disruptions (with a quantified impact of xx million units in 2024) add complexity and cost.
Emerging Opportunities in Industrial Thermoplastic Polyurethane Elastomer
The Industrial TPU market presents several emerging opportunities, including the growing demand for bio-based and recycled TPUs, driven by increasing environmental concerns. Untapped markets in developing economies and innovative applications in emerging sectors, such as 3D printing and robotics, offer significant growth potential. Evolving consumer preferences towards sustainable and high-performance products create further opportunities for innovation and market expansion.
Growth Accelerators in the Industrial Thermoplastic Polyurethane Elastomer Industry
Long-term growth in the Industrial TPU market will be accelerated by ongoing technological breakthroughs, leading to improved material properties and processing efficiencies. Strategic partnerships between TPU manufacturers and end-users to develop customized solutions for specific applications will play a crucial role. Market expansion into new geographical regions with high growth potential will further accelerate market growth.
Key Players Shaping the Industrial Thermoplastic Polyurethane Elastomer Market
- Lubrizol
- BASF
- Covestro
- Wanhua Chemical
- Huntsman
- Trinseo
- Hexpol
- Kuraray
- COIM Group
- Avient
- Epaflex
- Miracll Chemicals
- Shandong INOV New Materials
- Urecore
- Huide Technology
- Huafon Chemical
Notable Milestones in Industrial Thermoplastic Polyurethane Elastomer Sector
- 2021-Q4: BASF launched a new bio-based TPU.
- 2022-Q2: Covestro announced a strategic partnership for recycling TPU waste.
- 2023-Q1: Wanhua Chemical expanded its TPU production capacity in China. (Further milestones will be added based on available data)
In-Depth Industrial Thermoplastic Polyurethane Elastomer Market Outlook
The Industrial TPU market exhibits strong growth potential over the forecast period (2025-2033), fueled by sustained demand from key industries and ongoing technological advancements. Strategic opportunities for market players include developing sustainable TPU solutions, expanding into new applications, and forging strategic partnerships to capture market share in high-growth regions. The focus on innovation and sustainability will shape the future of the market.
Industrial Thermoplastic Polyurethane Elastomer Segmentation
-
1. Application
- 1.1. Sports Goods & Footwear
- 1.2. Industrial Manufacturing
- 1.3. Transportation/Automotive
- 1.4. Wire and Cable Solutions
- 1.5. Construction Materials
- 1.6. Medical, etc.
-
2. Types
- 2.1. Polyester-based TPU
- 2.2. Polyether-based TPU
- 2.3. Polycaprolactone-based TPU
Industrial Thermoplastic Polyurethane Elastomer Segmentation By Geography
-
1. North America
- 1.1. United States
- 1.2. Canada
- 1.3. Mexico
-
2. South America
- 2.1. Brazil
- 2.2. Argentina
- 2.3. Rest of South America
-
3. Europe
- 3.1. United Kingdom
- 3.2. Germany
- 3.3. France
- 3.4. Italy
- 3.5. Spain
- 3.6. Russia
- 3.7. Benelux
- 3.8. Nordics
- 3.9. Rest of Europe
-
4. Middle East & Africa
- 4.1. Turkey
- 4.2. Israel
- 4.3. GCC
- 4.4. North Africa
- 4.5. South Africa
- 4.6. Rest of Middle East & Africa
-
5. Asia Pacific
- 5.1. China
- 5.2. India
- 5.3. Japan
- 5.4. South Korea
- 5.5. ASEAN
- 5.6. Oceania
- 5.7. Rest of Asia Pacific
Industrial Thermoplastic Polyurethane Elastomer REPORT HIGHLIGHTS
| Aspects | Details |
|---|---|
| Study Period | 2019-2033 |
| Base Year | 2024 |
| Estimated Year | 2025 |
| Forecast Period | 2025-2033 |
| Historical Period | 2019-2024 |
| Growth Rate | CAGR of 5% from 2019-2033 |
| Segmentation |
|
Table of Contents
- 1. Introduction
- 1.1. Research Scope
- 1.2. Market Segmentation
- 1.3. Research Methodology
- 1.4. Definitions and Assumptions
- 2. Executive Summary
- 2.1. Introduction
- 3. Market Dynamics
- 3.1. Introduction
- 3.2. Market Drivers
- 3.3. Market Restrains
- 3.4. Market Trends
- 4. Market Factor Analysis
- 4.1. Porters Five Forces
- 4.2. Supply/Value Chain
- 4.3. PESTEL analysis
- 4.4. Market Entropy
- 4.5. Patent/Trademark Analysis
- 5. Global Industrial Thermoplastic Polyurethane Elastomer Analysis, Insights and Forecast, 2019-2031
- 5.1. Market Analysis, Insights and Forecast - by Application
- 5.1.1. Sports Goods & Footwear
- 5.1.2. Industrial Manufacturing
- 5.1.3. Transportation/Automotive
- 5.1.4. Wire and Cable Solutions
- 5.1.5. Construction Materials
- 5.1.6. Medical, etc.
- 5.2. Market Analysis, Insights and Forecast - by Types
- 5.2.1. Polyester-based TPU
- 5.2.2. Polyether-based TPU
- 5.2.3. Polycaprolactone-based TPU
- 5.3. Market Analysis, Insights and Forecast - by Region
- 5.3.1. North America
- 5.3.2. South America
- 5.3.3. Europe
- 5.3.4. Middle East & Africa
- 5.3.5. Asia Pacific
- 5.1. Market Analysis, Insights and Forecast - by Application
- 6. North America Industrial Thermoplastic Polyurethane Elastomer Analysis, Insights and Forecast, 2019-2031
- 6.1. Market Analysis, Insights and Forecast - by Application
- 6.1.1. Sports Goods & Footwear
- 6.1.2. Industrial Manufacturing
- 6.1.3. Transportation/Automotive
- 6.1.4. Wire and Cable Solutions
- 6.1.5. Construction Materials
- 6.1.6. Medical, etc.
- 6.2. Market Analysis, Insights and Forecast - by Types
- 6.2.1. Polyester-based TPU
- 6.2.2. Polyether-based TPU
- 6.2.3. Polycaprolactone-based TPU
- 6.1. Market Analysis, Insights and Forecast - by Application
- 7. South America Industrial Thermoplastic Polyurethane Elastomer Analysis, Insights and Forecast, 2019-2031
- 7.1. Market Analysis, Insights and Forecast - by Application
- 7.1.1. Sports Goods & Footwear
- 7.1.2. Industrial Manufacturing
- 7.1.3. Transportation/Automotive
- 7.1.4. Wire and Cable Solutions
- 7.1.5. Construction Materials
- 7.1.6. Medical, etc.
- 7.2. Market Analysis, Insights and Forecast - by Types
- 7.2.1. Polyester-based TPU
- 7.2.2. Polyether-based TPU
- 7.2.3. Polycaprolactone-based TPU
- 7.1. Market Analysis, Insights and Forecast - by Application
- 8. Europe Industrial Thermoplastic Polyurethane Elastomer Analysis, Insights and Forecast, 2019-2031
- 8.1. Market Analysis, Insights and Forecast - by Application
- 8.1.1. Sports Goods & Footwear
- 8.1.2. Industrial Manufacturing
- 8.1.3. Transportation/Automotive
- 8.1.4. Wire and Cable Solutions
- 8.1.5. Construction Materials
- 8.1.6. Medical, etc.
- 8.2. Market Analysis, Insights and Forecast - by Types
- 8.2.1. Polyester-based TPU
- 8.2.2. Polyether-based TPU
- 8.2.3. Polycaprolactone-based TPU
- 8.1. Market Analysis, Insights and Forecast - by Application
- 9. Middle East & Africa Industrial Thermoplastic Polyurethane Elastomer Analysis, Insights and Forecast, 2019-2031
- 9.1. Market Analysis, Insights and Forecast - by Application
- 9.1.1. Sports Goods & Footwear
- 9.1.2. Industrial Manufacturing
- 9.1.3. Transportation/Automotive
- 9.1.4. Wire and Cable Solutions
- 9.1.5. Construction Materials
- 9.1.6. Medical, etc.
- 9.2. Market Analysis, Insights and Forecast - by Types
- 9.2.1. Polyester-based TPU
- 9.2.2. Polyether-based TPU
- 9.2.3. Polycaprolactone-based TPU
- 9.1. Market Analysis, Insights and Forecast - by Application
- 10. Asia Pacific Industrial Thermoplastic Polyurethane Elastomer Analysis, Insights and Forecast, 2019-2031
- 10.1. Market Analysis, Insights and Forecast - by Application
- 10.1.1. Sports Goods & Footwear
- 10.1.2. Industrial Manufacturing
- 10.1.3. Transportation/Automotive
- 10.1.4. Wire and Cable Solutions
- 10.1.5. Construction Materials
- 10.1.6. Medical, etc.
- 10.2. Market Analysis, Insights and Forecast - by Types
- 10.2.1. Polyester-based TPU
- 10.2.2. Polyether-based TPU
- 10.2.3. Polycaprolactone-based TPU
- 10.1. Market Analysis, Insights and Forecast - by Application
- 11. Competitive Analysis
- 11.1. Global Market Share Analysis 2024
- 11.2. Company Profiles
- 11.2.1 Lubrizol
- 11.2.1.1. Overview
- 11.2.1.2. Products
- 11.2.1.3. SWOT Analysis
- 11.2.1.4. Recent Developments
- 11.2.1.5. Financials (Based on Availability)
- 11.2.2 BASF
- 11.2.2.1. Overview
- 11.2.2.2. Products
- 11.2.2.3. SWOT Analysis
- 11.2.2.4. Recent Developments
- 11.2.2.5. Financials (Based on Availability)
- 11.2.3 Covestro
- 11.2.3.1. Overview
- 11.2.3.2. Products
- 11.2.3.3. SWOT Analysis
- 11.2.3.4. Recent Developments
- 11.2.3.5. Financials (Based on Availability)
- 11.2.4 Wanhua Chemical
- 11.2.4.1. Overview
- 11.2.4.2. Products
- 11.2.4.3. SWOT Analysis
- 11.2.4.4. Recent Developments
- 11.2.4.5. Financials (Based on Availability)
- 11.2.5 Huntsman
- 11.2.5.1. Overview
- 11.2.5.2. Products
- 11.2.5.3. SWOT Analysis
- 11.2.5.4. Recent Developments
- 11.2.5.5. Financials (Based on Availability)
- 11.2.6 Trinseo
- 11.2.6.1. Overview
- 11.2.6.2. Products
- 11.2.6.3. SWOT Analysis
- 11.2.6.4. Recent Developments
- 11.2.6.5. Financials (Based on Availability)
- 11.2.7 Hexpol
- 11.2.7.1. Overview
- 11.2.7.2. Products
- 11.2.7.3. SWOT Analysis
- 11.2.7.4. Recent Developments
- 11.2.7.5. Financials (Based on Availability)
- 11.2.8 Kuraray
- 11.2.8.1. Overview
- 11.2.8.2. Products
- 11.2.8.3. SWOT Analysis
- 11.2.8.4. Recent Developments
- 11.2.8.5. Financials (Based on Availability)
- 11.2.9 COIM Group
- 11.2.9.1. Overview
- 11.2.9.2. Products
- 11.2.9.3. SWOT Analysis
- 11.2.9.4. Recent Developments
- 11.2.9.5. Financials (Based on Availability)
- 11.2.10 Avient
- 11.2.10.1. Overview
- 11.2.10.2. Products
- 11.2.10.3. SWOT Analysis
- 11.2.10.4. Recent Developments
- 11.2.10.5. Financials (Based on Availability)
- 11.2.11 Epaflex
- 11.2.11.1. Overview
- 11.2.11.2. Products
- 11.2.11.3. SWOT Analysis
- 11.2.11.4. Recent Developments
- 11.2.11.5. Financials (Based on Availability)
- 11.2.12 Miracll Chemicals
- 11.2.12.1. Overview
- 11.2.12.2. Products
- 11.2.12.3. SWOT Analysis
- 11.2.12.4. Recent Developments
- 11.2.12.5. Financials (Based on Availability)
- 11.2.13 Shandong INOV New Materials
- 11.2.13.1. Overview
- 11.2.13.2. Products
- 11.2.13.3. SWOT Analysis
- 11.2.13.4. Recent Developments
- 11.2.13.5. Financials (Based on Availability)
- 11.2.14 Urecore
- 11.2.14.1. Overview
- 11.2.14.2. Products
- 11.2.14.3. SWOT Analysis
- 11.2.14.4. Recent Developments
- 11.2.14.5. Financials (Based on Availability)
- 11.2.15 Huide Technology
- 11.2.15.1. Overview
- 11.2.15.2. Products
- 11.2.15.3. SWOT Analysis
- 11.2.15.4. Recent Developments
- 11.2.15.5. Financials (Based on Availability)
- 11.2.16 Huafon Chemical
- 11.2.16.1. Overview
- 11.2.16.2. Products
- 11.2.16.3. SWOT Analysis
- 11.2.16.4. Recent Developments
- 11.2.16.5. Financials (Based on Availability)
- 11.2.1 Lubrizol
List of Figures
- Figure 1: Global Industrial Thermoplastic Polyurethane Elastomer Revenue Breakdown (million, %) by Region 2024 & 2032
- Figure 2: Global Industrial Thermoplastic Polyurethane Elastomer Volume Breakdown (K, %) by Region 2024 & 2032
- Figure 3: North America Industrial Thermoplastic Polyurethane Elastomer Revenue (million), by Application 2024 & 2032
- Figure 4: North America Industrial Thermoplastic Polyurethane Elastomer Volume (K), by Application 2024 & 2032
- Figure 5: North America Industrial Thermoplastic Polyurethane Elastomer Revenue Share (%), by Application 2024 & 2032
- Figure 6: North America Industrial Thermoplastic Polyurethane Elastomer Volume Share (%), by Application 2024 & 2032
- Figure 7: North America Industrial Thermoplastic Polyurethane Elastomer Revenue (million), by Types 2024 & 2032
- Figure 8: North America Industrial Thermoplastic Polyurethane Elastomer Volume (K), by Types 2024 & 2032
- Figure 9: North America Industrial Thermoplastic Polyurethane Elastomer Revenue Share (%), by Types 2024 & 2032
- Figure 10: North America Industrial Thermoplastic Polyurethane Elastomer Volume Share (%), by Types 2024 & 2032
- Figure 11: North America Industrial Thermoplastic Polyurethane Elastomer Revenue (million), by Country 2024 & 2032
- Figure 12: North America Industrial Thermoplastic Polyurethane Elastomer Volume (K), by Country 2024 & 2032
- Figure 13: North America Industrial Thermoplastic Polyurethane Elastomer Revenue Share (%), by Country 2024 & 2032
- Figure 14: North America Industrial Thermoplastic Polyurethane Elastomer Volume Share (%), by Country 2024 & 2032
- Figure 15: South America Industrial Thermoplastic Polyurethane Elastomer Revenue (million), by Application 2024 & 2032
- Figure 16: South America Industrial Thermoplastic Polyurethane Elastomer Volume (K), by Application 2024 & 2032
- Figure 17: South America Industrial Thermoplastic Polyurethane Elastomer Revenue Share (%), by Application 2024 & 2032
- Figure 18: South America Industrial Thermoplastic Polyurethane Elastomer Volume Share (%), by Application 2024 & 2032
- Figure 19: South America Industrial Thermoplastic Polyurethane Elastomer Revenue (million), by Types 2024 & 2032
- Figure 20: South America Industrial Thermoplastic Polyurethane Elastomer Volume (K), by Types 2024 & 2032
- Figure 21: South America Industrial Thermoplastic Polyurethane Elastomer Revenue Share (%), by Types 2024 & 2032
- Figure 22: South America Industrial Thermoplastic Polyurethane Elastomer Volume Share (%), by Types 2024 & 2032
- Figure 23: South America Industrial Thermoplastic Polyurethane Elastomer Revenue (million), by Country 2024 & 2032
- Figure 24: South America Industrial Thermoplastic Polyurethane Elastomer Volume (K), by Country 2024 & 2032
- Figure 25: South America Industrial Thermoplastic Polyurethane Elastomer Revenue Share (%), by Country 2024 & 2032
- Figure 26: South America Industrial Thermoplastic Polyurethane Elastomer Volume Share (%), by Country 2024 & 2032
- Figure 27: Europe Industrial Thermoplastic Polyurethane Elastomer Revenue (million), by Application 2024 & 2032
- Figure 28: Europe Industrial Thermoplastic Polyurethane Elastomer Volume (K), by Application 2024 & 2032
- Figure 29: Europe Industrial Thermoplastic Polyurethane Elastomer Revenue Share (%), by Application 2024 & 2032
- Figure 30: Europe Industrial Thermoplastic Polyurethane Elastomer Volume Share (%), by Application 2024 & 2032
- Figure 31: Europe Industrial Thermoplastic Polyurethane Elastomer Revenue (million), by Types 2024 & 2032
- Figure 32: Europe Industrial Thermoplastic Polyurethane Elastomer Volume (K), by Types 2024 & 2032
- Figure 33: Europe Industrial Thermoplastic Polyurethane Elastomer Revenue Share (%), by Types 2024 & 2032
- Figure 34: Europe Industrial Thermoplastic Polyurethane Elastomer Volume Share (%), by Types 2024 & 2032
- Figure 35: Europe Industrial Thermoplastic Polyurethane Elastomer Revenue (million), by Country 2024 & 2032
- Figure 36: Europe Industrial Thermoplastic Polyurethane Elastomer Volume (K), by Country 2024 & 2032
- Figure 37: Europe Industrial Thermoplastic Polyurethane Elastomer Revenue Share (%), by Country 2024 & 2032
- Figure 38: Europe Industrial Thermoplastic Polyurethane Elastomer Volume Share (%), by Country 2024 & 2032
- Figure 39: Middle East & Africa Industrial Thermoplastic Polyurethane Elastomer Revenue (million), by Application 2024 & 2032
- Figure 40: Middle East & Africa Industrial Thermoplastic Polyurethane Elastomer Volume (K), by Application 2024 & 2032
- Figure 41: Middle East & Africa Industrial Thermoplastic Polyurethane Elastomer Revenue Share (%), by Application 2024 & 2032
- Figure 42: Middle East & Africa Industrial Thermoplastic Polyurethane Elastomer Volume Share (%), by Application 2024 & 2032
- Figure 43: Middle East & Africa Industrial Thermoplastic Polyurethane Elastomer Revenue (million), by Types 2024 & 2032
- Figure 44: Middle East & Africa Industrial Thermoplastic Polyurethane Elastomer Volume (K), by Types 2024 & 2032
- Figure 45: Middle East & Africa Industrial Thermoplastic Polyurethane Elastomer Revenue Share (%), by Types 2024 & 2032
- Figure 46: Middle East & Africa Industrial Thermoplastic Polyurethane Elastomer Volume Share (%), by Types 2024 & 2032
- Figure 47: Middle East & Africa Industrial Thermoplastic Polyurethane Elastomer Revenue (million), by Country 2024 & 2032
- Figure 48: Middle East & Africa Industrial Thermoplastic Polyurethane Elastomer Volume (K), by Country 2024 & 2032
- Figure 49: Middle East & Africa Industrial Thermoplastic Polyurethane Elastomer Revenue Share (%), by Country 2024 & 2032
- Figure 50: Middle East & Africa Industrial Thermoplastic Polyurethane Elastomer Volume Share (%), by Country 2024 & 2032
- Figure 51: Asia Pacific Industrial Thermoplastic Polyurethane Elastomer Revenue (million), by Application 2024 & 2032
- Figure 52: Asia Pacific Industrial Thermoplastic Polyurethane Elastomer Volume (K), by Application 2024 & 2032
- Figure 53: Asia Pacific Industrial Thermoplastic Polyurethane Elastomer Revenue Share (%), by Application 2024 & 2032
- Figure 54: Asia Pacific Industrial Thermoplastic Polyurethane Elastomer Volume Share (%), by Application 2024 & 2032
- Figure 55: Asia Pacific Industrial Thermoplastic Polyurethane Elastomer Revenue (million), by Types 2024 & 2032
- Figure 56: Asia Pacific Industrial Thermoplastic Polyurethane Elastomer Volume (K), by Types 2024 & 2032
- Figure 57: Asia Pacific Industrial Thermoplastic Polyurethane Elastomer Revenue Share (%), by Types 2024 & 2032
- Figure 58: Asia Pacific Industrial Thermoplastic Polyurethane Elastomer Volume Share (%), by Types 2024 & 2032
- Figure 59: Asia Pacific Industrial Thermoplastic Polyurethane Elastomer Revenue (million), by Country 2024 & 2032
- Figure 60: Asia Pacific Industrial Thermoplastic Polyurethane Elastomer Volume (K), by Country 2024 & 2032
- Figure 61: Asia Pacific Industrial Thermoplastic Polyurethane Elastomer Revenue Share (%), by Country 2024 & 2032
- Figure 62: Asia Pacific Industrial Thermoplastic Polyurethane Elastomer Volume Share (%), by Country 2024 & 2032
List of Tables
- Table 1: Global Industrial Thermoplastic Polyurethane Elastomer Revenue million Forecast, by Region 2019 & 2032
- Table 2: Global Industrial Thermoplastic Polyurethane Elastomer Volume K Forecast, by Region 2019 & 2032
- Table 3: Global Industrial Thermoplastic Polyurethane Elastomer Revenue million Forecast, by Application 2019 & 2032
- Table 4: Global Industrial Thermoplastic Polyurethane Elastomer Volume K Forecast, by Application 2019 & 2032
- Table 5: Global Industrial Thermoplastic Polyurethane Elastomer Revenue million Forecast, by Types 2019 & 2032
- Table 6: Global Industrial Thermoplastic Polyurethane Elastomer Volume K Forecast, by Types 2019 & 2032
- Table 7: Global Industrial Thermoplastic Polyurethane Elastomer Revenue million Forecast, by Region 2019 & 2032
- Table 8: Global Industrial Thermoplastic Polyurethane Elastomer Volume K Forecast, by Region 2019 & 2032
- Table 9: Global Industrial Thermoplastic Polyurethane Elastomer Revenue million Forecast, by Application 2019 & 2032
- Table 10: Global Industrial Thermoplastic Polyurethane Elastomer Volume K Forecast, by Application 2019 & 2032
- Table 11: Global Industrial Thermoplastic Polyurethane Elastomer Revenue million Forecast, by Types 2019 & 2032
- Table 12: Global Industrial Thermoplastic Polyurethane Elastomer Volume K Forecast, by Types 2019 & 2032
- Table 13: Global Industrial Thermoplastic Polyurethane Elastomer Revenue million Forecast, by Country 2019 & 2032
- Table 14: Global Industrial Thermoplastic Polyurethane Elastomer Volume K Forecast, by Country 2019 & 2032
- Table 15: United States Industrial Thermoplastic Polyurethane Elastomer Revenue (million) Forecast, by Application 2019 & 2032
- Table 16: United States Industrial Thermoplastic Polyurethane Elastomer Volume (K) Forecast, by Application 2019 & 2032
- Table 17: Canada Industrial Thermoplastic Polyurethane Elastomer Revenue (million) Forecast, by Application 2019 & 2032
- Table 18: Canada Industrial Thermoplastic Polyurethane Elastomer Volume (K) Forecast, by Application 2019 & 2032
- Table 19: Mexico Industrial Thermoplastic Polyurethane Elastomer Revenue (million) Forecast, by Application 2019 & 2032
- Table 20: Mexico Industrial Thermoplastic Polyurethane Elastomer Volume (K) Forecast, by Application 2019 & 2032
- Table 21: Global Industrial Thermoplastic Polyurethane Elastomer Revenue million Forecast, by Application 2019 & 2032
- Table 22: Global Industrial Thermoplastic Polyurethane Elastomer Volume K Forecast, by Application 2019 & 2032
- Table 23: Global Industrial Thermoplastic Polyurethane Elastomer Revenue million Forecast, by Types 2019 & 2032
- Table 24: Global Industrial Thermoplastic Polyurethane Elastomer Volume K Forecast, by Types 2019 & 2032
- Table 25: Global Industrial Thermoplastic Polyurethane Elastomer Revenue million Forecast, by Country 2019 & 2032
- Table 26: Global Industrial Thermoplastic Polyurethane Elastomer Volume K Forecast, by Country 2019 & 2032
- Table 27: Brazil Industrial Thermoplastic Polyurethane Elastomer Revenue (million) Forecast, by Application 2019 & 2032
- Table 28: Brazil Industrial Thermoplastic Polyurethane Elastomer Volume (K) Forecast, by Application 2019 & 2032
- Table 29: Argentina Industrial Thermoplastic Polyurethane Elastomer Revenue (million) Forecast, by Application 2019 & 2032
- Table 30: Argentina Industrial Thermoplastic Polyurethane Elastomer Volume (K) Forecast, by Application 2019 & 2032
- Table 31: Rest of South America Industrial Thermoplastic Polyurethane Elastomer Revenue (million) Forecast, by Application 2019 & 2032
- Table 32: Rest of South America Industrial Thermoplastic Polyurethane Elastomer Volume (K) Forecast, by Application 2019 & 2032
- Table 33: Global Industrial Thermoplastic Polyurethane Elastomer Revenue million Forecast, by Application 2019 & 2032
- Table 34: Global Industrial Thermoplastic Polyurethane Elastomer Volume K Forecast, by Application 2019 & 2032
- Table 35: Global Industrial Thermoplastic Polyurethane Elastomer Revenue million Forecast, by Types 2019 & 2032
- Table 36: Global Industrial Thermoplastic Polyurethane Elastomer Volume K Forecast, by Types 2019 & 2032
- Table 37: Global Industrial Thermoplastic Polyurethane Elastomer Revenue million Forecast, by Country 2019 & 2032
- Table 38: Global Industrial Thermoplastic Polyurethane Elastomer Volume K Forecast, by Country 2019 & 2032
- Table 39: United Kingdom Industrial Thermoplastic Polyurethane Elastomer Revenue (million) Forecast, by Application 2019 & 2032
- Table 40: United Kingdom Industrial Thermoplastic Polyurethane Elastomer Volume (K) Forecast, by Application 2019 & 2032
- Table 41: Germany Industrial Thermoplastic Polyurethane Elastomer Revenue (million) Forecast, by Application 2019 & 2032
- Table 42: Germany Industrial Thermoplastic Polyurethane Elastomer Volume (K) Forecast, by Application 2019 & 2032
- Table 43: France Industrial Thermoplastic Polyurethane Elastomer Revenue (million) Forecast, by Application 2019 & 2032
- Table 44: France Industrial Thermoplastic Polyurethane Elastomer Volume (K) Forecast, by Application 2019 & 2032
- Table 45: Italy Industrial Thermoplastic Polyurethane Elastomer Revenue (million) Forecast, by Application 2019 & 2032
- Table 46: Italy Industrial Thermoplastic Polyurethane Elastomer Volume (K) Forecast, by Application 2019 & 2032
- Table 47: Spain Industrial Thermoplastic Polyurethane Elastomer Revenue (million) Forecast, by Application 2019 & 2032
- Table 48: Spain Industrial Thermoplastic Polyurethane Elastomer Volume (K) Forecast, by Application 2019 & 2032
- Table 49: Russia Industrial Thermoplastic Polyurethane Elastomer Revenue (million) Forecast, by Application 2019 & 2032
- Table 50: Russia Industrial Thermoplastic Polyurethane Elastomer Volume (K) Forecast, by Application 2019 & 2032
- Table 51: Benelux Industrial Thermoplastic Polyurethane Elastomer Revenue (million) Forecast, by Application 2019 & 2032
- Table 52: Benelux Industrial Thermoplastic Polyurethane Elastomer Volume (K) Forecast, by Application 2019 & 2032
- Table 53: Nordics Industrial Thermoplastic Polyurethane Elastomer Revenue (million) Forecast, by Application 2019 & 2032
- Table 54: Nordics Industrial Thermoplastic Polyurethane Elastomer Volume (K) Forecast, by Application 2019 & 2032
- Table 55: Rest of Europe Industrial Thermoplastic Polyurethane Elastomer Revenue (million) Forecast, by Application 2019 & 2032
- Table 56: Rest of Europe Industrial Thermoplastic Polyurethane Elastomer Volume (K) Forecast, by Application 2019 & 2032
- Table 57: Global Industrial Thermoplastic Polyurethane Elastomer Revenue million Forecast, by Application 2019 & 2032
- Table 58: Global Industrial Thermoplastic Polyurethane Elastomer Volume K Forecast, by Application 2019 & 2032
- Table 59: Global Industrial Thermoplastic Polyurethane Elastomer Revenue million Forecast, by Types 2019 & 2032
- Table 60: Global Industrial Thermoplastic Polyurethane Elastomer Volume K Forecast, by Types 2019 & 2032
- Table 61: Global Industrial Thermoplastic Polyurethane Elastomer Revenue million Forecast, by Country 2019 & 2032
- Table 62: Global Industrial Thermoplastic Polyurethane Elastomer Volume K Forecast, by Country 2019 & 2032
- Table 63: Turkey Industrial Thermoplastic Polyurethane Elastomer Revenue (million) Forecast, by Application 2019 & 2032
- Table 64: Turkey Industrial Thermoplastic Polyurethane Elastomer Volume (K) Forecast, by Application 2019 & 2032
- Table 65: Israel Industrial Thermoplastic Polyurethane Elastomer Revenue (million) Forecast, by Application 2019 & 2032
- Table 66: Israel Industrial Thermoplastic Polyurethane Elastomer Volume (K) Forecast, by Application 2019 & 2032
- Table 67: GCC Industrial Thermoplastic Polyurethane Elastomer Revenue (million) Forecast, by Application 2019 & 2032
- Table 68: GCC Industrial Thermoplastic Polyurethane Elastomer Volume (K) Forecast, by Application 2019 & 2032
- Table 69: North Africa Industrial Thermoplastic Polyurethane Elastomer Revenue (million) Forecast, by Application 2019 & 2032
- Table 70: North Africa Industrial Thermoplastic Polyurethane Elastomer Volume (K) Forecast, by Application 2019 & 2032
- Table 71: South Africa Industrial Thermoplastic Polyurethane Elastomer Revenue (million) Forecast, by Application 2019 & 2032
- Table 72: South Africa Industrial Thermoplastic Polyurethane Elastomer Volume (K) Forecast, by Application 2019 & 2032
- Table 73: Rest of Middle East & Africa Industrial Thermoplastic Polyurethane Elastomer Revenue (million) Forecast, by Application 2019 & 2032
- Table 74: Rest of Middle East & Africa Industrial Thermoplastic Polyurethane Elastomer Volume (K) Forecast, by Application 2019 & 2032
- Table 75: Global Industrial Thermoplastic Polyurethane Elastomer Revenue million Forecast, by Application 2019 & 2032
- Table 76: Global Industrial Thermoplastic Polyurethane Elastomer Volume K Forecast, by Application 2019 & 2032
- Table 77: Global Industrial Thermoplastic Polyurethane Elastomer Revenue million Forecast, by Types 2019 & 2032
- Table 78: Global Industrial Thermoplastic Polyurethane Elastomer Volume K Forecast, by Types 2019 & 2032
- Table 79: Global Industrial Thermoplastic Polyurethane Elastomer Revenue million Forecast, by Country 2019 & 2032
- Table 80: Global Industrial Thermoplastic Polyurethane Elastomer Volume K Forecast, by Country 2019 & 2032
- Table 81: China Industrial Thermoplastic Polyurethane Elastomer Revenue (million) Forecast, by Application 2019 & 2032
- Table 82: China Industrial Thermoplastic Polyurethane Elastomer Volume (K) Forecast, by Application 2019 & 2032
- Table 83: India Industrial Thermoplastic Polyurethane Elastomer Revenue (million) Forecast, by Application 2019 & 2032
- Table 84: India Industrial Thermoplastic Polyurethane Elastomer Volume (K) Forecast, by Application 2019 & 2032
- Table 85: Japan Industrial Thermoplastic Polyurethane Elastomer Revenue (million) Forecast, by Application 2019 & 2032
- Table 86: Japan Industrial Thermoplastic Polyurethane Elastomer Volume (K) Forecast, by Application 2019 & 2032
- Table 87: South Korea Industrial Thermoplastic Polyurethane Elastomer Revenue (million) Forecast, by Application 2019 & 2032
- Table 88: South Korea Industrial Thermoplastic Polyurethane Elastomer Volume (K) Forecast, by Application 2019 & 2032
- Table 89: ASEAN Industrial Thermoplastic Polyurethane Elastomer Revenue (million) Forecast, by Application 2019 & 2032
- Table 90: ASEAN Industrial Thermoplastic Polyurethane Elastomer Volume (K) Forecast, by Application 2019 & 2032
- Table 91: Oceania Industrial Thermoplastic Polyurethane Elastomer Revenue (million) Forecast, by Application 2019 & 2032
- Table 92: Oceania Industrial Thermoplastic Polyurethane Elastomer Volume (K) Forecast, by Application 2019 & 2032
- Table 93: Rest of Asia Pacific Industrial Thermoplastic Polyurethane Elastomer Revenue (million) Forecast, by Application 2019 & 2032
- Table 94: Rest of Asia Pacific Industrial Thermoplastic Polyurethane Elastomer Volume (K) Forecast, by Application 2019 & 2032
Frequently Asked Questions
1. What is the projected Compound Annual Growth Rate (CAGR) of the Industrial Thermoplastic Polyurethane Elastomer?
The projected CAGR is approximately 5%.
2. Which companies are prominent players in the Industrial Thermoplastic Polyurethane Elastomer?
Key companies in the market include Lubrizol, BASF, Covestro, Wanhua Chemical, Huntsman, Trinseo, Hexpol, Kuraray, COIM Group, Avient, Epaflex, Miracll Chemicals, Shandong INOV New Materials, Urecore, Huide Technology, Huafon Chemical.
3. What are the main segments of the Industrial Thermoplastic Polyurethane Elastomer?
The market segments include Application, Types.
4. Can you provide details about the market size?
The market size is estimated to be USD 3993 million as of 2022.
5. What are some drivers contributing to market growth?
N/A
6. What are the notable trends driving market growth?
N/A
7. Are there any restraints impacting market growth?
N/A
8. Can you provide examples of recent developments in the market?
N/A
9. What pricing options are available for accessing the report?
Pricing options include single-user, multi-user, and enterprise licenses priced at USD 3950.00, USD 5925.00, and USD 7900.00 respectively.
10. Is the market size provided in terms of value or volume?
The market size is provided in terms of value, measured in million and volume, measured in K.
11. Are there any specific market keywords associated with the report?
Yes, the market keyword associated with the report is "Industrial Thermoplastic Polyurethane Elastomer," which aids in identifying and referencing the specific market segment covered.
12. How do I determine which pricing option suits my needs best?
The pricing options vary based on user requirements and access needs. Individual users may opt for single-user licenses, while businesses requiring broader access may choose multi-user or enterprise licenses for cost-effective access to the report.
13. Are there any additional resources or data provided in the Industrial Thermoplastic Polyurethane Elastomer report?
While the report offers comprehensive insights, it's advisable to review the specific contents or supplementary materials provided to ascertain if additional resources or data are available.
14. How can I stay updated on further developments or reports in the Industrial Thermoplastic Polyurethane Elastomer?
To stay informed about further developments, trends, and reports in the Industrial Thermoplastic Polyurethane Elastomer, consider subscribing to industry newsletters, following relevant companies and organizations, or regularly checking reputable industry news sources and publications.
Methodology
Step 1 - Identification of Relevant Samples Size from Population Database


Step 2 - Approaches for Defining Global Market Size (Value, Volume* & Price*)

Note*: In applicable scenarios
Step 3 - Data Sources
Primary Research
- Web Analytics
- Survey Reports
- Research Institute
- Latest Research Reports
- Opinion Leaders
Secondary Research
- Annual Reports
- White Paper
- Latest Press Release
- Industry Association
- Paid Database
- Investor Presentations

Step 4 - Data Triangulation
Involves using different sources of information in order to increase the validity of a study
These sources are likely to be stakeholders in a program - participants, other researchers, program staff, other community members, and so on.
Then we put all data in single framework & apply various statistical tools to find out the dynamic on the market.
During the analysis stage, feedback from the stakeholder groups would be compared to determine areas of agreement as well as areas of divergence


