
Key Insights
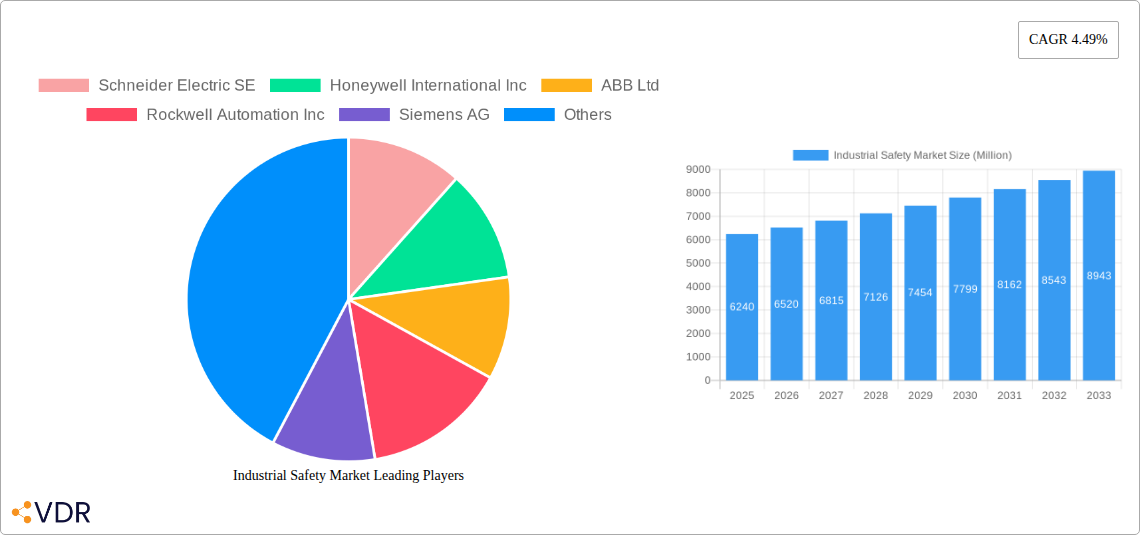
The Industrial Safety Market, valued at $6.24 billion in 2025, is projected to experience robust growth, driven by increasing automation across various industries, stringent government regulations emphasizing workplace safety, and a rising awareness of occupational hazards. The market's Compound Annual Growth Rate (CAGR) of 4.49% from 2019-2024 suggests a continued upward trajectory, further fueled by the adoption of advanced technologies like IoT sensors, AI-powered predictive maintenance, and robust safety systems. The demand for sophisticated safety solutions is especially high in sectors with inherently hazardous operations, such as manufacturing, oil & gas, and construction. Leading players like Schneider Electric, Honeywell, and ABB are continuously innovating and expanding their product portfolios to cater to the evolving needs of this market. Growth is further stimulated by the increasing integration of safety systems with broader industrial automation strategies, creating a more holistic and efficient approach to risk management.
Despite the positive outlook, several factors could potentially restrain market growth. These include the high initial investment costs associated with implementing advanced safety systems, particularly for smaller businesses. Furthermore, the complexities of integrating diverse safety technologies across legacy systems present challenges. However, these hurdles are likely to be offset by the long-term cost savings associated with reduced workplace accidents, improved productivity, and enhanced compliance with regulatory standards. The market's segmentation is likely diverse, encompassing various safety equipment types (e.g., sensors, emergency shutdown systems, personal protective equipment), services (e.g., risk assessments, safety training), and deployment models (on-premise, cloud-based). Regional variations in safety regulations and industrial development will also influence market growth across different geographic areas.
Industrial Safety Market Report: A Comprehensive Analysis (2019-2033)
This in-depth report provides a comprehensive analysis of the Industrial Safety Market, encompassing market dynamics, growth trends, regional analysis, product landscape, and key players. With a study period spanning 2019-2033, a base year of 2025, and a forecast period of 2025-2033, this report offers invaluable insights for industry professionals, investors, and strategic decision-makers. The market is segmented into various sub-sectors (specific segmentation details to be added within the report), allowing for granular analysis of growth opportunities within the broader industrial safety landscape. The total addressable market (TAM) is projected to reach XX Million by 2033.
Industrial Safety Market Market Dynamics & Structure
The industrial safety market is characterized by moderate concentration, with several major players holding significant market share. The market is driven by stringent government regulations, increasing awareness of workplace safety, and technological advancements leading to the development of sophisticated safety systems. However, high initial investment costs and integration complexities pose challenges. Mergers and acquisitions (M&A) activity is relatively high, reflecting consolidation efforts among industry players.
- Market Concentration: The top 5 players account for approximately xx% of the market share in 2025.
- Technological Innovation: Advancements in IoT, AI, and machine learning are driving the adoption of predictive maintenance and real-time safety monitoring systems.
- Regulatory Framework: Stringent safety standards and regulations (e.g., OSHA, ISO) are significant growth drivers.
- Competitive Product Substitutes: Limited viable substitutes exist, primarily due to the critical nature of industrial safety solutions.
- End-User Demographics: Key end-users include manufacturing, oil & gas, mining, construction, and transportation industries.
- M&A Trends: An average of xx M&A deals were recorded annually during the historical period (2019-2024).
Industrial Safety Market Growth Trends & Insights
The industrial safety market has experienced consistent growth over the past five years, fueled by increasing industrial automation, rising awareness of worker safety, and the implementation of stringent safety regulations across various industries. The market's Compound Annual Growth Rate (CAGR) during the historical period (2019-2024) was approximately xx%, and is projected to reach xx% during the forecast period (2025-2033), driven by factors such as increasing adoption of advanced safety technologies and expanding industrial activities globally. Market penetration is currently estimated at xx% and is projected to increase to xx% by 2033, primarily driven by adoption in emerging economies. Technological disruptions, such as the integration of AI and IoT, are expected to further enhance safety protocols and contribute to market expansion. The shift toward proactive risk management and predictive maintenance strategies significantly influences consumer behavior, increasing the demand for advanced safety solutions.

Dominant Regions, Countries, or Segments in Industrial Safety Market
North America currently dominates the industrial safety market, driven by stringent regulatory frameworks, high industrial automation rates, and substantial investments in safety infrastructure. Europe follows closely, with strong emphasis on worker safety and the presence of established safety equipment manufacturers. The Asia-Pacific region exhibits significant growth potential, fueled by rapid industrialization and increasing government focus on workplace safety.
- North America: High regulatory compliance, advanced technological adoption, and established safety culture.
- Europe: Stringent safety regulations, strong industrial base, and presence of major market players.
- Asia-Pacific: Rapid industrialization, increasing awareness of workplace safety, and significant growth potential.
- Other Regions: Growing adoption in developing countries driven by industrial expansion and improved safety standards.
Industrial Safety Market Product Landscape
The industrial safety market offers a diverse range of products, including personal protective equipment (PPE), safety sensors and systems, emergency shutdown systems, gas detection equipment, and fire protection systems. Recent innovations focus on integrating advanced technologies like IoT, AI, and machine learning to enhance safety monitoring, predictive maintenance, and real-time risk assessment. These advancements offer improved accuracy, efficiency, and proactive safety measures, significantly enhancing workplace safety. Unique selling propositions often center around increased reliability, ease of integration, and advanced analytics capabilities.
Key Drivers, Barriers & Challenges in Industrial Safety Market
Key Drivers: Stringent government regulations, increasing industrial automation, rising awareness of workplace safety, and technological advancements. Examples include the implementation of stricter safety standards in multiple industries and the growing adoption of IoT-based safety monitoring systems.
Key Challenges: High initial investment costs, complex integration processes, lack of skilled personnel for installation and maintenance, and potential supply chain disruptions due to global events. These challenges can lead to delays in project implementation and increased overall costs, potentially impacting market growth by an estimated xx% in the next 5 years.
Emerging Opportunities in Industrial Safety Market
Emerging opportunities include the growth of smart safety solutions leveraging AI and IoT, expansion into untapped markets in developing economies, and increasing demand for customized safety solutions tailored to specific industry needs. The integration of safety systems with other industrial automation systems is also creating significant opportunities for growth.
Growth Accelerators in the Industrial Safety Market Industry
Long-term growth in the industrial safety market will be accelerated by technological breakthroughs in areas such as AI-powered risk assessment, advanced sensor technology, and improved connectivity. Strategic partnerships between technology providers and industrial companies will be crucial for driving innovation and market expansion.
Key Players Shaping the Industrial Safety Market Market
- Schneider Electric SE
- Honeywell International Inc
- ABB Ltd
- Rockwell Automation Inc
- Siemens AG
- Emerson Electric Co
- Baker Hughes
- HIMA Paul Hildebrandt GmbH
- Yokogawa Electric Corporation
- Omron Corporation
- Johnson Controls
- Balluff GmbH
- Keyence Corporation
- IDEC Corporation
- SICK AG
- Mitsubishi Electric
- Banner Engineering
- Fortress Interlocks
- Automation Inc
Notable Milestones in Industrial Safety Market Sector
- January 2024: MKS Instruments Inc. received TÜV Rheinland certification for its programmable safety interlock solution.
- April 2024: Emerson launched the ASCO Series 148/149 safety valve and motorized actuator.
In-Depth Industrial Safety Market Market Outlook
The future of the industrial safety market is bright, driven by continuous technological advancements, increasing regulatory pressure, and a growing focus on worker well-being. Strategic opportunities lie in developing innovative safety solutions tailored to specific industry needs, expanding into emerging markets, and fostering collaborative partnerships to drive innovation and market penetration. The market is poised for sustained growth, offering significant potential for both established and emerging players.
Industrial Safety Market Segmentation
-
1. Component
- 1.1. Safety Sensors
- 1.2. Safety Controllers/Relays
- 1.3. Safety Valves
- 1.4. Other Components
-
2. Safety System
- 2.1. Emergency Shutdown Systems (ESD)
- 2.2. Fire and Gas Monitoring Systems
- 2.3. High Integrity Pressure Protection Systems (HIPPS)
- 2.4. Burner Management Systems (BMS)
- 2.5. Other Safety Systems
-
3. End-user Industry
- 3.1. Aerospace and Defense
- 3.2. Oil and Gas
- 3.3. Automotive
- 3.4. Energy and Power
- 3.5. Metals and Mining
- 3.6. Pharmaceutical and Healthcare
- 3.7. Food and Beverage
- 3.8. Chemical and Petrochemical
- 3.9. Other End-user Industries
Industrial Safety Market Segmentation By Geography
- 1. North America
- 2. Europe
- 3. Asia
- 4. Australia and New Zealand
- 5. Latin America
- 6. Middle East

Industrial Safety Market REPORT HIGHLIGHTS
| Aspects | Details |
|---|---|
| Study Period | 2019-2033 |
| Base Year | 2024 |
| Estimated Year | 2025 |
| Forecast Period | 2025-2033 |
| Historical Period | 2019-2024 |
| Growth Rate | CAGR of 4.49% from 2019-2033 |
| Segmentation |
|
Table of Contents
- 1. Introduction
- 1.1. Research Scope
- 1.2. Market Segmentation
- 1.3. Research Methodology
- 1.4. Definitions and Assumptions
- 2. Executive Summary
- 2.1. Introduction
- 3. Market Dynamics
- 3.1. Introduction
- 3.2. Market Drivers
- 3.2.1 Increasing Regulatory Environment in the Industry will Drive the Market Growth; The Rising Adoption of Automation
- 3.2.2 Robotics
- 3.2.3 and IoT will Increase the Demand for Industrial Safety
- 3.3. Market Restrains
- 3.3.1 Increasing Regulatory Environment in the Industry will Drive the Market Growth; The Rising Adoption of Automation
- 3.3.2 Robotics
- 3.3.3 and IoT will Increase the Demand for Industrial Safety
- 3.4. Market Trends
- 3.4.1. Safety Sensors Segment is Expected to Hold Significant Market Share
- 4. Market Factor Analysis
- 4.1. Porters Five Forces
- 4.2. Supply/Value Chain
- 4.3. PESTEL analysis
- 4.4. Market Entropy
- 4.5. Patent/Trademark Analysis
- 5. Global Industrial Safety Market Analysis, Insights and Forecast, 2019-2031
- 5.1. Market Analysis, Insights and Forecast - by Component
- 5.1.1. Safety Sensors
- 5.1.2. Safety Controllers/Relays
- 5.1.3. Safety Valves
- 5.1.4. Other Components
- 5.2. Market Analysis, Insights and Forecast - by Safety System
- 5.2.1. Emergency Shutdown Systems (ESD)
- 5.2.2. Fire and Gas Monitoring Systems
- 5.2.3. High Integrity Pressure Protection Systems (HIPPS)
- 5.2.4. Burner Management Systems (BMS)
- 5.2.5. Other Safety Systems
- 5.3. Market Analysis, Insights and Forecast - by End-user Industry
- 5.3.1. Aerospace and Defense
- 5.3.2. Oil and Gas
- 5.3.3. Automotive
- 5.3.4. Energy and Power
- 5.3.5. Metals and Mining
- 5.3.6. Pharmaceutical and Healthcare
- 5.3.7. Food and Beverage
- 5.3.8. Chemical and Petrochemical
- 5.3.9. Other End-user Industries
- 5.4. Market Analysis, Insights and Forecast - by Region
- 5.4.1. North America
- 5.4.2. Europe
- 5.4.3. Asia
- 5.4.4. Australia and New Zealand
- 5.4.5. Latin America
- 5.4.6. Middle East
- 5.1. Market Analysis, Insights and Forecast - by Component
- 6. North America Industrial Safety Market Analysis, Insights and Forecast, 2019-2031
- 6.1. Market Analysis, Insights and Forecast - by Component
- 6.1.1. Safety Sensors
- 6.1.2. Safety Controllers/Relays
- 6.1.3. Safety Valves
- 6.1.4. Other Components
- 6.2. Market Analysis, Insights and Forecast - by Safety System
- 6.2.1. Emergency Shutdown Systems (ESD)
- 6.2.2. Fire and Gas Monitoring Systems
- 6.2.3. High Integrity Pressure Protection Systems (HIPPS)
- 6.2.4. Burner Management Systems (BMS)
- 6.2.5. Other Safety Systems
- 6.3. Market Analysis, Insights and Forecast - by End-user Industry
- 6.3.1. Aerospace and Defense
- 6.3.2. Oil and Gas
- 6.3.3. Automotive
- 6.3.4. Energy and Power
- 6.3.5. Metals and Mining
- 6.3.6. Pharmaceutical and Healthcare
- 6.3.7. Food and Beverage
- 6.3.8. Chemical and Petrochemical
- 6.3.9. Other End-user Industries
- 6.1. Market Analysis, Insights and Forecast - by Component
- 7. Europe Industrial Safety Market Analysis, Insights and Forecast, 2019-2031
- 7.1. Market Analysis, Insights and Forecast - by Component
- 7.1.1. Safety Sensors
- 7.1.2. Safety Controllers/Relays
- 7.1.3. Safety Valves
- 7.1.4. Other Components
- 7.2. Market Analysis, Insights and Forecast - by Safety System
- 7.2.1. Emergency Shutdown Systems (ESD)
- 7.2.2. Fire and Gas Monitoring Systems
- 7.2.3. High Integrity Pressure Protection Systems (HIPPS)
- 7.2.4. Burner Management Systems (BMS)
- 7.2.5. Other Safety Systems
- 7.3. Market Analysis, Insights and Forecast - by End-user Industry
- 7.3.1. Aerospace and Defense
- 7.3.2. Oil and Gas
- 7.3.3. Automotive
- 7.3.4. Energy and Power
- 7.3.5. Metals and Mining
- 7.3.6. Pharmaceutical and Healthcare
- 7.3.7. Food and Beverage
- 7.3.8. Chemical and Petrochemical
- 7.3.9. Other End-user Industries
- 7.1. Market Analysis, Insights and Forecast - by Component
- 8. Asia Industrial Safety Market Analysis, Insights and Forecast, 2019-2031
- 8.1. Market Analysis, Insights and Forecast - by Component
- 8.1.1. Safety Sensors
- 8.1.2. Safety Controllers/Relays
- 8.1.3. Safety Valves
- 8.1.4. Other Components
- 8.2. Market Analysis, Insights and Forecast - by Safety System
- 8.2.1. Emergency Shutdown Systems (ESD)
- 8.2.2. Fire and Gas Monitoring Systems
- 8.2.3. High Integrity Pressure Protection Systems (HIPPS)
- 8.2.4. Burner Management Systems (BMS)
- 8.2.5. Other Safety Systems
- 8.3. Market Analysis, Insights and Forecast - by End-user Industry
- 8.3.1. Aerospace and Defense
- 8.3.2. Oil and Gas
- 8.3.3. Automotive
- 8.3.4. Energy and Power
- 8.3.5. Metals and Mining
- 8.3.6. Pharmaceutical and Healthcare
- 8.3.7. Food and Beverage
- 8.3.8. Chemical and Petrochemical
- 8.3.9. Other End-user Industries
- 8.1. Market Analysis, Insights and Forecast - by Component
- 9. Australia and New Zealand Industrial Safety Market Analysis, Insights and Forecast, 2019-2031
- 9.1. Market Analysis, Insights and Forecast - by Component
- 9.1.1. Safety Sensors
- 9.1.2. Safety Controllers/Relays
- 9.1.3. Safety Valves
- 9.1.4. Other Components
- 9.2. Market Analysis, Insights and Forecast - by Safety System
- 9.2.1. Emergency Shutdown Systems (ESD)
- 9.2.2. Fire and Gas Monitoring Systems
- 9.2.3. High Integrity Pressure Protection Systems (HIPPS)
- 9.2.4. Burner Management Systems (BMS)
- 9.2.5. Other Safety Systems
- 9.3. Market Analysis, Insights and Forecast - by End-user Industry
- 9.3.1. Aerospace and Defense
- 9.3.2. Oil and Gas
- 9.3.3. Automotive
- 9.3.4. Energy and Power
- 9.3.5. Metals and Mining
- 9.3.6. Pharmaceutical and Healthcare
- 9.3.7. Food and Beverage
- 9.3.8. Chemical and Petrochemical
- 9.3.9. Other End-user Industries
- 9.1. Market Analysis, Insights and Forecast - by Component
- 10. Latin America Industrial Safety Market Analysis, Insights and Forecast, 2019-2031
- 10.1. Market Analysis, Insights and Forecast - by Component
- 10.1.1. Safety Sensors
- 10.1.2. Safety Controllers/Relays
- 10.1.3. Safety Valves
- 10.1.4. Other Components
- 10.2. Market Analysis, Insights and Forecast - by Safety System
- 10.2.1. Emergency Shutdown Systems (ESD)
- 10.2.2. Fire and Gas Monitoring Systems
- 10.2.3. High Integrity Pressure Protection Systems (HIPPS)
- 10.2.4. Burner Management Systems (BMS)
- 10.2.5. Other Safety Systems
- 10.3. Market Analysis, Insights and Forecast - by End-user Industry
- 10.3.1. Aerospace and Defense
- 10.3.2. Oil and Gas
- 10.3.3. Automotive
- 10.3.4. Energy and Power
- 10.3.5. Metals and Mining
- 10.3.6. Pharmaceutical and Healthcare
- 10.3.7. Food and Beverage
- 10.3.8. Chemical and Petrochemical
- 10.3.9. Other End-user Industries
- 10.1. Market Analysis, Insights and Forecast - by Component
- 11. Middle East Industrial Safety Market Analysis, Insights and Forecast, 2019-2031
- 11.1. Market Analysis, Insights and Forecast - by Component
- 11.1.1. Safety Sensors
- 11.1.2. Safety Controllers/Relays
- 11.1.3. Safety Valves
- 11.1.4. Other Components
- 11.2. Market Analysis, Insights and Forecast - by Safety System
- 11.2.1. Emergency Shutdown Systems (ESD)
- 11.2.2. Fire and Gas Monitoring Systems
- 11.2.3. High Integrity Pressure Protection Systems (HIPPS)
- 11.2.4. Burner Management Systems (BMS)
- 11.2.5. Other Safety Systems
- 11.3. Market Analysis, Insights and Forecast - by End-user Industry
- 11.3.1. Aerospace and Defense
- 11.3.2. Oil and Gas
- 11.3.3. Automotive
- 11.3.4. Energy and Power
- 11.3.5. Metals and Mining
- 11.3.6. Pharmaceutical and Healthcare
- 11.3.7. Food and Beverage
- 11.3.8. Chemical and Petrochemical
- 11.3.9. Other End-user Industries
- 11.1. Market Analysis, Insights and Forecast - by Component
- 12. Competitive Analysis
- 12.1. Global Market Share Analysis 2024
- 12.2. Company Profiles
- 12.2.1 Schneider Electric SE
- 12.2.1.1. Overview
- 12.2.1.2. Products
- 12.2.1.3. SWOT Analysis
- 12.2.1.4. Recent Developments
- 12.2.1.5. Financials (Based on Availability)
- 12.2.2 Honeywell International Inc
- 12.2.2.1. Overview
- 12.2.2.2. Products
- 12.2.2.3. SWOT Analysis
- 12.2.2.4. Recent Developments
- 12.2.2.5. Financials (Based on Availability)
- 12.2.3 ABB Ltd
- 12.2.3.1. Overview
- 12.2.3.2. Products
- 12.2.3.3. SWOT Analysis
- 12.2.3.4. Recent Developments
- 12.2.3.5. Financials (Based on Availability)
- 12.2.4 Rockwell Automation Inc
- 12.2.4.1. Overview
- 12.2.4.2. Products
- 12.2.4.3. SWOT Analysis
- 12.2.4.4. Recent Developments
- 12.2.4.5. Financials (Based on Availability)
- 12.2.5 Siemens AG
- 12.2.5.1. Overview
- 12.2.5.2. Products
- 12.2.5.3. SWOT Analysis
- 12.2.5.4. Recent Developments
- 12.2.5.5. Financials (Based on Availability)
- 12.2.6 Emerson Electric Co
- 12.2.6.1. Overview
- 12.2.6.2. Products
- 12.2.6.3. SWOT Analysis
- 12.2.6.4. Recent Developments
- 12.2.6.5. Financials (Based on Availability)
- 12.2.7 Baker Hughes
- 12.2.7.1. Overview
- 12.2.7.2. Products
- 12.2.7.3. SWOT Analysis
- 12.2.7.4. Recent Developments
- 12.2.7.5. Financials (Based on Availability)
- 12.2.8 HIMA Paul Hildebrandt GmbH
- 12.2.8.1. Overview
- 12.2.8.2. Products
- 12.2.8.3. SWOT Analysis
- 12.2.8.4. Recent Developments
- 12.2.8.5. Financials (Based on Availability)
- 12.2.9 Yokogawa Electric Corporation
- 12.2.9.1. Overview
- 12.2.9.2. Products
- 12.2.9.3. SWOT Analysis
- 12.2.9.4. Recent Developments
- 12.2.9.5. Financials (Based on Availability)
- 12.2.10 Omron Corporation
- 12.2.10.1. Overview
- 12.2.10.2. Products
- 12.2.10.3. SWOT Analysis
- 12.2.10.4. Recent Developments
- 12.2.10.5. Financials (Based on Availability)
- 12.2.11 Johnson Controls
- 12.2.11.1. Overview
- 12.2.11.2. Products
- 12.2.11.3. SWOT Analysis
- 12.2.11.4. Recent Developments
- 12.2.11.5. Financials (Based on Availability)
- 12.2.12 Balluff GmbH
- 12.2.12.1. Overview
- 12.2.12.2. Products
- 12.2.12.3. SWOT Analysis
- 12.2.12.4. Recent Developments
- 12.2.12.5. Financials (Based on Availability)
- 12.2.13 Keyence Corporation
- 12.2.13.1. Overview
- 12.2.13.2. Products
- 12.2.13.3. SWOT Analysis
- 12.2.13.4. Recent Developments
- 12.2.13.5. Financials (Based on Availability)
- 12.2.14 IDEC Corporation
- 12.2.14.1. Overview
- 12.2.14.2. Products
- 12.2.14.3. SWOT Analysis
- 12.2.14.4. Recent Developments
- 12.2.14.5. Financials (Based on Availability)
- 12.2.15 SICK AG
- 12.2.15.1. Overview
- 12.2.15.2. Products
- 12.2.15.3. SWOT Analysis
- 12.2.15.4. Recent Developments
- 12.2.15.5. Financials (Based on Availability)
- 12.2.16 Mitsubishi Electric
- 12.2.16.1. Overview
- 12.2.16.2. Products
- 12.2.16.3. SWOT Analysis
- 12.2.16.4. Recent Developments
- 12.2.16.5. Financials (Based on Availability)
- 12.2.17 Banner Engineering
- 12.2.17.1. Overview
- 12.2.17.2. Products
- 12.2.17.3. SWOT Analysis
- 12.2.17.4. Recent Developments
- 12.2.17.5. Financials (Based on Availability)
- 12.2.18 Fortress Interlocks
- 12.2.18.1. Overview
- 12.2.18.2. Products
- 12.2.18.3. SWOT Analysis
- 12.2.18.4. Recent Developments
- 12.2.18.5. Financials (Based on Availability)
- 12.2.19 Automation Inc
- 12.2.19.1. Overview
- 12.2.19.2. Products
- 12.2.19.3. SWOT Analysis
- 12.2.19.4. Recent Developments
- 12.2.19.5. Financials (Based on Availability)
- 12.2.1 Schneider Electric SE
List of Figures
- Figure 1: Global Industrial Safety Market Revenue Breakdown (Million, %) by Region 2024 & 2032
- Figure 2: Global Industrial Safety Market Volume Breakdown (Billion, %) by Region 2024 & 2032
- Figure 3: North America Industrial Safety Market Revenue (Million), by Component 2024 & 2032
- Figure 4: North America Industrial Safety Market Volume (Billion), by Component 2024 & 2032
- Figure 5: North America Industrial Safety Market Revenue Share (%), by Component 2024 & 2032
- Figure 6: North America Industrial Safety Market Volume Share (%), by Component 2024 & 2032
- Figure 7: North America Industrial Safety Market Revenue (Million), by Safety System 2024 & 2032
- Figure 8: North America Industrial Safety Market Volume (Billion), by Safety System 2024 & 2032
- Figure 9: North America Industrial Safety Market Revenue Share (%), by Safety System 2024 & 2032
- Figure 10: North America Industrial Safety Market Volume Share (%), by Safety System 2024 & 2032
- Figure 11: North America Industrial Safety Market Revenue (Million), by End-user Industry 2024 & 2032
- Figure 12: North America Industrial Safety Market Volume (Billion), by End-user Industry 2024 & 2032
- Figure 13: North America Industrial Safety Market Revenue Share (%), by End-user Industry 2024 & 2032
- Figure 14: North America Industrial Safety Market Volume Share (%), by End-user Industry 2024 & 2032
- Figure 15: North America Industrial Safety Market Revenue (Million), by Country 2024 & 2032
- Figure 16: North America Industrial Safety Market Volume (Billion), by Country 2024 & 2032
- Figure 17: North America Industrial Safety Market Revenue Share (%), by Country 2024 & 2032
- Figure 18: North America Industrial Safety Market Volume Share (%), by Country 2024 & 2032
- Figure 19: Europe Industrial Safety Market Revenue (Million), by Component 2024 & 2032
- Figure 20: Europe Industrial Safety Market Volume (Billion), by Component 2024 & 2032
- Figure 21: Europe Industrial Safety Market Revenue Share (%), by Component 2024 & 2032
- Figure 22: Europe Industrial Safety Market Volume Share (%), by Component 2024 & 2032
- Figure 23: Europe Industrial Safety Market Revenue (Million), by Safety System 2024 & 2032
- Figure 24: Europe Industrial Safety Market Volume (Billion), by Safety System 2024 & 2032
- Figure 25: Europe Industrial Safety Market Revenue Share (%), by Safety System 2024 & 2032
- Figure 26: Europe Industrial Safety Market Volume Share (%), by Safety System 2024 & 2032
- Figure 27: Europe Industrial Safety Market Revenue (Million), by End-user Industry 2024 & 2032
- Figure 28: Europe Industrial Safety Market Volume (Billion), by End-user Industry 2024 & 2032
- Figure 29: Europe Industrial Safety Market Revenue Share (%), by End-user Industry 2024 & 2032
- Figure 30: Europe Industrial Safety Market Volume Share (%), by End-user Industry 2024 & 2032
- Figure 31: Europe Industrial Safety Market Revenue (Million), by Country 2024 & 2032
- Figure 32: Europe Industrial Safety Market Volume (Billion), by Country 2024 & 2032
- Figure 33: Europe Industrial Safety Market Revenue Share (%), by Country 2024 & 2032
- Figure 34: Europe Industrial Safety Market Volume Share (%), by Country 2024 & 2032
- Figure 35: Asia Industrial Safety Market Revenue (Million), by Component 2024 & 2032
- Figure 36: Asia Industrial Safety Market Volume (Billion), by Component 2024 & 2032
- Figure 37: Asia Industrial Safety Market Revenue Share (%), by Component 2024 & 2032
- Figure 38: Asia Industrial Safety Market Volume Share (%), by Component 2024 & 2032
- Figure 39: Asia Industrial Safety Market Revenue (Million), by Safety System 2024 & 2032
- Figure 40: Asia Industrial Safety Market Volume (Billion), by Safety System 2024 & 2032
- Figure 41: Asia Industrial Safety Market Revenue Share (%), by Safety System 2024 & 2032
- Figure 42: Asia Industrial Safety Market Volume Share (%), by Safety System 2024 & 2032
- Figure 43: Asia Industrial Safety Market Revenue (Million), by End-user Industry 2024 & 2032
- Figure 44: Asia Industrial Safety Market Volume (Billion), by End-user Industry 2024 & 2032
- Figure 45: Asia Industrial Safety Market Revenue Share (%), by End-user Industry 2024 & 2032
- Figure 46: Asia Industrial Safety Market Volume Share (%), by End-user Industry 2024 & 2032
- Figure 47: Asia Industrial Safety Market Revenue (Million), by Country 2024 & 2032
- Figure 48: Asia Industrial Safety Market Volume (Billion), by Country 2024 & 2032
- Figure 49: Asia Industrial Safety Market Revenue Share (%), by Country 2024 & 2032
- Figure 50: Asia Industrial Safety Market Volume Share (%), by Country 2024 & 2032
- Figure 51: Australia and New Zealand Industrial Safety Market Revenue (Million), by Component 2024 & 2032
- Figure 52: Australia and New Zealand Industrial Safety Market Volume (Billion), by Component 2024 & 2032
- Figure 53: Australia and New Zealand Industrial Safety Market Revenue Share (%), by Component 2024 & 2032
- Figure 54: Australia and New Zealand Industrial Safety Market Volume Share (%), by Component 2024 & 2032
- Figure 55: Australia and New Zealand Industrial Safety Market Revenue (Million), by Safety System 2024 & 2032
- Figure 56: Australia and New Zealand Industrial Safety Market Volume (Billion), by Safety System 2024 & 2032
- Figure 57: Australia and New Zealand Industrial Safety Market Revenue Share (%), by Safety System 2024 & 2032
- Figure 58: Australia and New Zealand Industrial Safety Market Volume Share (%), by Safety System 2024 & 2032
- Figure 59: Australia and New Zealand Industrial Safety Market Revenue (Million), by End-user Industry 2024 & 2032
- Figure 60: Australia and New Zealand Industrial Safety Market Volume (Billion), by End-user Industry 2024 & 2032
- Figure 61: Australia and New Zealand Industrial Safety Market Revenue Share (%), by End-user Industry 2024 & 2032
- Figure 62: Australia and New Zealand Industrial Safety Market Volume Share (%), by End-user Industry 2024 & 2032
- Figure 63: Australia and New Zealand Industrial Safety Market Revenue (Million), by Country 2024 & 2032
- Figure 64: Australia and New Zealand Industrial Safety Market Volume (Billion), by Country 2024 & 2032
- Figure 65: Australia and New Zealand Industrial Safety Market Revenue Share (%), by Country 2024 & 2032
- Figure 66: Australia and New Zealand Industrial Safety Market Volume Share (%), by Country 2024 & 2032
- Figure 67: Latin America Industrial Safety Market Revenue (Million), by Component 2024 & 2032
- Figure 68: Latin America Industrial Safety Market Volume (Billion), by Component 2024 & 2032
- Figure 69: Latin America Industrial Safety Market Revenue Share (%), by Component 2024 & 2032
- Figure 70: Latin America Industrial Safety Market Volume Share (%), by Component 2024 & 2032
- Figure 71: Latin America Industrial Safety Market Revenue (Million), by Safety System 2024 & 2032
- Figure 72: Latin America Industrial Safety Market Volume (Billion), by Safety System 2024 & 2032
- Figure 73: Latin America Industrial Safety Market Revenue Share (%), by Safety System 2024 & 2032
- Figure 74: Latin America Industrial Safety Market Volume Share (%), by Safety System 2024 & 2032
- Figure 75: Latin America Industrial Safety Market Revenue (Million), by End-user Industry 2024 & 2032
- Figure 76: Latin America Industrial Safety Market Volume (Billion), by End-user Industry 2024 & 2032
- Figure 77: Latin America Industrial Safety Market Revenue Share (%), by End-user Industry 2024 & 2032
- Figure 78: Latin America Industrial Safety Market Volume Share (%), by End-user Industry 2024 & 2032
- Figure 79: Latin America Industrial Safety Market Revenue (Million), by Country 2024 & 2032
- Figure 80: Latin America Industrial Safety Market Volume (Billion), by Country 2024 & 2032
- Figure 81: Latin America Industrial Safety Market Revenue Share (%), by Country 2024 & 2032
- Figure 82: Latin America Industrial Safety Market Volume Share (%), by Country 2024 & 2032
- Figure 83: Middle East Industrial Safety Market Revenue (Million), by Component 2024 & 2032
- Figure 84: Middle East Industrial Safety Market Volume (Billion), by Component 2024 & 2032
- Figure 85: Middle East Industrial Safety Market Revenue Share (%), by Component 2024 & 2032
- Figure 86: Middle East Industrial Safety Market Volume Share (%), by Component 2024 & 2032
- Figure 87: Middle East Industrial Safety Market Revenue (Million), by Safety System 2024 & 2032
- Figure 88: Middle East Industrial Safety Market Volume (Billion), by Safety System 2024 & 2032
- Figure 89: Middle East Industrial Safety Market Revenue Share (%), by Safety System 2024 & 2032
- Figure 90: Middle East Industrial Safety Market Volume Share (%), by Safety System 2024 & 2032
- Figure 91: Middle East Industrial Safety Market Revenue (Million), by End-user Industry 2024 & 2032
- Figure 92: Middle East Industrial Safety Market Volume (Billion), by End-user Industry 2024 & 2032
- Figure 93: Middle East Industrial Safety Market Revenue Share (%), by End-user Industry 2024 & 2032
- Figure 94: Middle East Industrial Safety Market Volume Share (%), by End-user Industry 2024 & 2032
- Figure 95: Middle East Industrial Safety Market Revenue (Million), by Country 2024 & 2032
- Figure 96: Middle East Industrial Safety Market Volume (Billion), by Country 2024 & 2032
- Figure 97: Middle East Industrial Safety Market Revenue Share (%), by Country 2024 & 2032
- Figure 98: Middle East Industrial Safety Market Volume Share (%), by Country 2024 & 2032
List of Tables
- Table 1: Global Industrial Safety Market Revenue Million Forecast, by Region 2019 & 2032
- Table 2: Global Industrial Safety Market Volume Billion Forecast, by Region 2019 & 2032
- Table 3: Global Industrial Safety Market Revenue Million Forecast, by Component 2019 & 2032
- Table 4: Global Industrial Safety Market Volume Billion Forecast, by Component 2019 & 2032
- Table 5: Global Industrial Safety Market Revenue Million Forecast, by Safety System 2019 & 2032
- Table 6: Global Industrial Safety Market Volume Billion Forecast, by Safety System 2019 & 2032
- Table 7: Global Industrial Safety Market Revenue Million Forecast, by End-user Industry 2019 & 2032
- Table 8: Global Industrial Safety Market Volume Billion Forecast, by End-user Industry 2019 & 2032
- Table 9: Global Industrial Safety Market Revenue Million Forecast, by Region 2019 & 2032
- Table 10: Global Industrial Safety Market Volume Billion Forecast, by Region 2019 & 2032
- Table 11: Global Industrial Safety Market Revenue Million Forecast, by Component 2019 & 2032
- Table 12: Global Industrial Safety Market Volume Billion Forecast, by Component 2019 & 2032
- Table 13: Global Industrial Safety Market Revenue Million Forecast, by Safety System 2019 & 2032
- Table 14: Global Industrial Safety Market Volume Billion Forecast, by Safety System 2019 & 2032
- Table 15: Global Industrial Safety Market Revenue Million Forecast, by End-user Industry 2019 & 2032
- Table 16: Global Industrial Safety Market Volume Billion Forecast, by End-user Industry 2019 & 2032
- Table 17: Global Industrial Safety Market Revenue Million Forecast, by Country 2019 & 2032
- Table 18: Global Industrial Safety Market Volume Billion Forecast, by Country 2019 & 2032
- Table 19: Global Industrial Safety Market Revenue Million Forecast, by Component 2019 & 2032
- Table 20: Global Industrial Safety Market Volume Billion Forecast, by Component 2019 & 2032
- Table 21: Global Industrial Safety Market Revenue Million Forecast, by Safety System 2019 & 2032
- Table 22: Global Industrial Safety Market Volume Billion Forecast, by Safety System 2019 & 2032
- Table 23: Global Industrial Safety Market Revenue Million Forecast, by End-user Industry 2019 & 2032
- Table 24: Global Industrial Safety Market Volume Billion Forecast, by End-user Industry 2019 & 2032
- Table 25: Global Industrial Safety Market Revenue Million Forecast, by Country 2019 & 2032
- Table 26: Global Industrial Safety Market Volume Billion Forecast, by Country 2019 & 2032
- Table 27: Global Industrial Safety Market Revenue Million Forecast, by Component 2019 & 2032
- Table 28: Global Industrial Safety Market Volume Billion Forecast, by Component 2019 & 2032
- Table 29: Global Industrial Safety Market Revenue Million Forecast, by Safety System 2019 & 2032
- Table 30: Global Industrial Safety Market Volume Billion Forecast, by Safety System 2019 & 2032
- Table 31: Global Industrial Safety Market Revenue Million Forecast, by End-user Industry 2019 & 2032
- Table 32: Global Industrial Safety Market Volume Billion Forecast, by End-user Industry 2019 & 2032
- Table 33: Global Industrial Safety Market Revenue Million Forecast, by Country 2019 & 2032
- Table 34: Global Industrial Safety Market Volume Billion Forecast, by Country 2019 & 2032
- Table 35: Global Industrial Safety Market Revenue Million Forecast, by Component 2019 & 2032
- Table 36: Global Industrial Safety Market Volume Billion Forecast, by Component 2019 & 2032
- Table 37: Global Industrial Safety Market Revenue Million Forecast, by Safety System 2019 & 2032
- Table 38: Global Industrial Safety Market Volume Billion Forecast, by Safety System 2019 & 2032
- Table 39: Global Industrial Safety Market Revenue Million Forecast, by End-user Industry 2019 & 2032
- Table 40: Global Industrial Safety Market Volume Billion Forecast, by End-user Industry 2019 & 2032
- Table 41: Global Industrial Safety Market Revenue Million Forecast, by Country 2019 & 2032
- Table 42: Global Industrial Safety Market Volume Billion Forecast, by Country 2019 & 2032
- Table 43: Global Industrial Safety Market Revenue Million Forecast, by Component 2019 & 2032
- Table 44: Global Industrial Safety Market Volume Billion Forecast, by Component 2019 & 2032
- Table 45: Global Industrial Safety Market Revenue Million Forecast, by Safety System 2019 & 2032
- Table 46: Global Industrial Safety Market Volume Billion Forecast, by Safety System 2019 & 2032
- Table 47: Global Industrial Safety Market Revenue Million Forecast, by End-user Industry 2019 & 2032
- Table 48: Global Industrial Safety Market Volume Billion Forecast, by End-user Industry 2019 & 2032
- Table 49: Global Industrial Safety Market Revenue Million Forecast, by Country 2019 & 2032
- Table 50: Global Industrial Safety Market Volume Billion Forecast, by Country 2019 & 2032
- Table 51: Global Industrial Safety Market Revenue Million Forecast, by Component 2019 & 2032
- Table 52: Global Industrial Safety Market Volume Billion Forecast, by Component 2019 & 2032
- Table 53: Global Industrial Safety Market Revenue Million Forecast, by Safety System 2019 & 2032
- Table 54: Global Industrial Safety Market Volume Billion Forecast, by Safety System 2019 & 2032
- Table 55: Global Industrial Safety Market Revenue Million Forecast, by End-user Industry 2019 & 2032
- Table 56: Global Industrial Safety Market Volume Billion Forecast, by End-user Industry 2019 & 2032
- Table 57: Global Industrial Safety Market Revenue Million Forecast, by Country 2019 & 2032
- Table 58: Global Industrial Safety Market Volume Billion Forecast, by Country 2019 & 2032
Frequently Asked Questions
1. What is the projected Compound Annual Growth Rate (CAGR) of the Industrial Safety Market?
The projected CAGR is approximately 4.49%.
2. Which companies are prominent players in the Industrial Safety Market?
Key companies in the market include Schneider Electric SE, Honeywell International Inc, ABB Ltd, Rockwell Automation Inc, Siemens AG, Emerson Electric Co, Baker Hughes, HIMA Paul Hildebrandt GmbH, Yokogawa Electric Corporation, Omron Corporation, Johnson Controls, Balluff GmbH, Keyence Corporation, IDEC Corporation, SICK AG, Mitsubishi Electric, Banner Engineering, Fortress Interlocks, Automation Inc.
3. What are the main segments of the Industrial Safety Market?
The market segments include Component, Safety System, End-user Industry.
4. Can you provide details about the market size?
The market size is estimated to be USD 6.24 Million as of 2022.
5. What are some drivers contributing to market growth?
Increasing Regulatory Environment in the Industry will Drive the Market Growth; The Rising Adoption of Automation. Robotics. and IoT will Increase the Demand for Industrial Safety.
6. What are the notable trends driving market growth?
Safety Sensors Segment is Expected to Hold Significant Market Share.
7. Are there any restraints impacting market growth?
Increasing Regulatory Environment in the Industry will Drive the Market Growth; The Rising Adoption of Automation. Robotics. and IoT will Increase the Demand for Industrial Safety.
8. Can you provide examples of recent developments in the market?
April 2024 - Emerson launched the ASCO Series 148/149 safety valve and motorized actuator, specifically engineered for industrial fuel oil burner recirculation and safety shutoff functions. This innovative solution offers industrial users a dependable and adaptable instrument to mitigate risks of overpressure, leaks, and system failures that may result in health and safety hazards, with a single configuration applicable to various combustion system applications.
9. What pricing options are available for accessing the report?
Pricing options include single-user, multi-user, and enterprise licenses priced at USD 4750, USD 5250, and USD 8750 respectively.
10. Is the market size provided in terms of value or volume?
The market size is provided in terms of value, measured in Million and volume, measured in Billion.
11. Are there any specific market keywords associated with the report?
Yes, the market keyword associated with the report is "Industrial Safety Market," which aids in identifying and referencing the specific market segment covered.
12. How do I determine which pricing option suits my needs best?
The pricing options vary based on user requirements and access needs. Individual users may opt for single-user licenses, while businesses requiring broader access may choose multi-user or enterprise licenses for cost-effective access to the report.
13. Are there any additional resources or data provided in the Industrial Safety Market report?
While the report offers comprehensive insights, it's advisable to review the specific contents or supplementary materials provided to ascertain if additional resources or data are available.
14. How can I stay updated on further developments or reports in the Industrial Safety Market?
To stay informed about further developments, trends, and reports in the Industrial Safety Market, consider subscribing to industry newsletters, following relevant companies and organizations, or regularly checking reputable industry news sources and publications.
Methodology
Step 1 - Identification of Relevant Samples Size from Population Database


Step 2 - Approaches for Defining Global Market Size (Value, Volume* & Price*)

Note*: In applicable scenarios
Step 3 - Data Sources
Primary Research
- Web Analytics
- Survey Reports
- Research Institute
- Latest Research Reports
- Opinion Leaders
Secondary Research
- Annual Reports
- White Paper
- Latest Press Release
- Industry Association
- Paid Database
- Investor Presentations

Step 4 - Data Triangulation
Involves using different sources of information in order to increase the validity of a study
These sources are likely to be stakeholders in a program - participants, other researchers, program staff, other community members, and so on.
Then we put all data in single framework & apply various statistical tools to find out the dynamic on the market.
During the analysis stage, feedback from the stakeholder groups would be compared to determine areas of agreement as well as areas of divergence


