
Key Insights
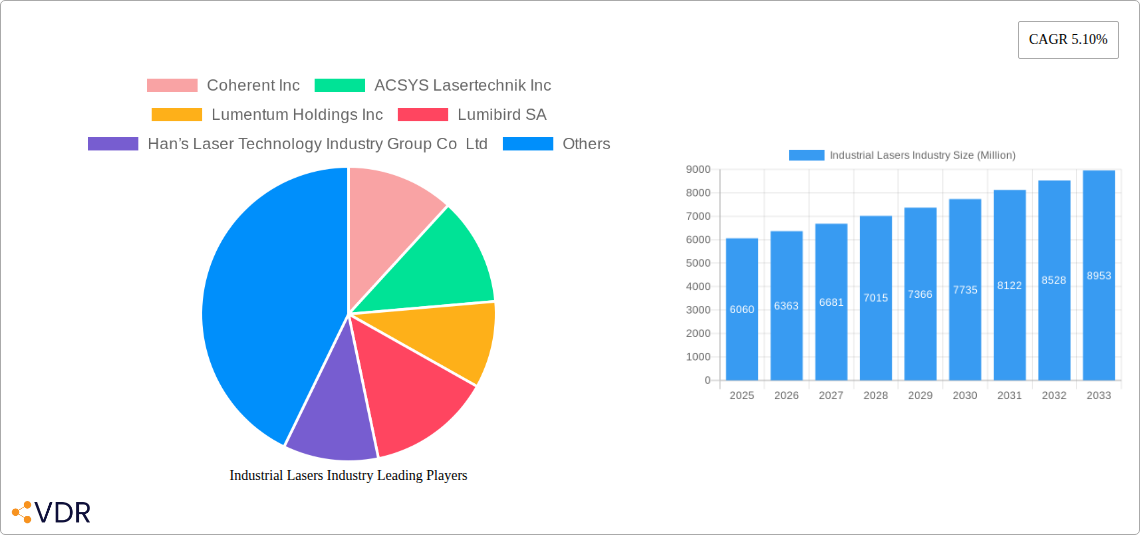
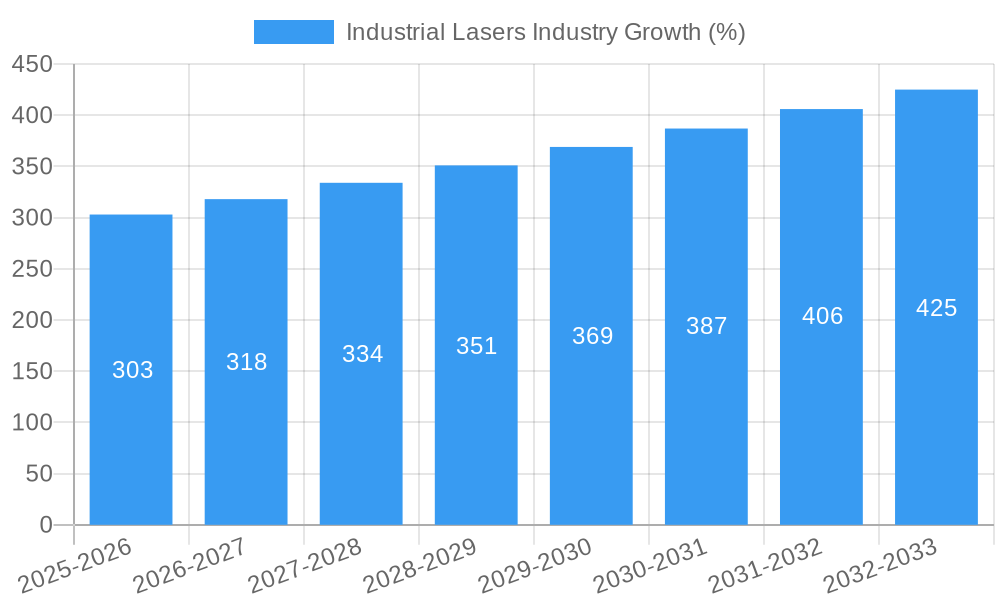
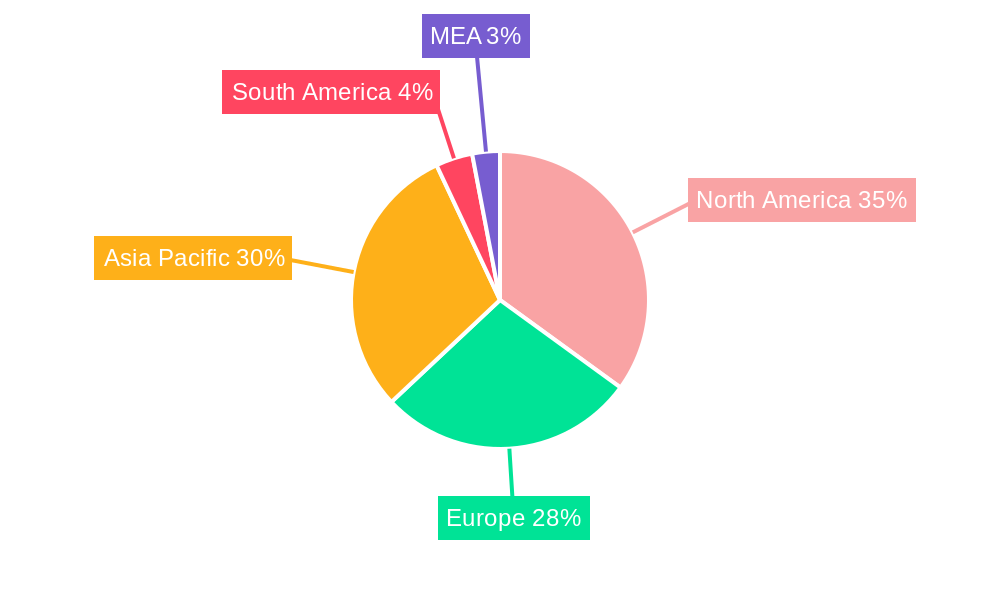
The industrial lasers market, valued at $6.06 billion in 2025, is projected to experience robust growth, driven by increasing automation across various sectors and advancements in laser technology. The Compound Annual Growth Rate (CAGR) of 5.10% from 2025 to 2033 indicates a significant expansion, reaching an estimated market size of approximately $9.7 billion by 2033. Key drivers include the rising demand for precision cutting and welding in automotive manufacturing, the adoption of laser-based additive manufacturing (3D printing) in aerospace and medical device production, and the increasing use of lasers for marking and engraving applications in consumer electronics. Fiber lasers are expected to dominate the market due to their high efficiency, versatility, and cost-effectiveness. The automotive and aerospace & defense sectors will remain major end-user industries, fueled by the need for high-speed, high-precision manufacturing processes. However, challenges such as the high initial investment costs associated with laser systems and potential safety concerns could act as restraints on market growth. Growth will be geographically diverse, with North America and Asia Pacific anticipated to be major contributors, reflecting their strong manufacturing bases and technological advancements.
Continued growth hinges on technological innovations, particularly in areas like ultrashort pulsed lasers for improved material processing capabilities and the development of more environmentally friendly laser systems. The market is witnessing increased competition, with both established players and emerging companies focusing on developing innovative solutions and expanding their global reach. Strategic partnerships and mergers and acquisitions are likely to shape the competitive landscape in the coming years. Applications such as micromachining for intricate components and laser-based surface treatment are also expected to contribute to market expansion. The market's success will depend on the continued integration of advanced laser technology into various manufacturing processes, as well as the development of more cost-effective and user-friendly laser systems.
Industrial Lasers Industry Market Report: 2019-2033
This comprehensive report provides an in-depth analysis of the Industrial Lasers market, covering market dynamics, growth trends, regional dominance, product landscape, key players, and future outlook. The study period spans 2019-2033, with 2025 as the base and estimated year. The report utilizes data from the historical period (2019-2024) and forecasts the market until 2033. Key market segments analyzed include Fiber Laser, Solid-state Laser, CO2 Laser, and Other Types, categorized by applications (Cutting, Welding, Marking, Drilling, Additive Manufacturing, and Other Applications) and end-user industries (Aerospace & Defense, Automotive, Healthcare, Consumer Electronics, Semiconductors, and Others).
Industrial Lasers Industry Market Dynamics & Structure
The industrial lasers market is experiencing robust growth, driven by technological advancements and increasing adoption across diverse sectors. Market concentration is moderate, with key players like IPG Photonics, Coherent Inc., and Trumpf Group holding significant market share, but a competitive landscape exists with numerous regional and specialized players. Technological innovation, particularly in fiber lasers and their applications in additive manufacturing, is a major growth driver. Regulatory frameworks related to safety and environmental impact play a significant role, shaping product development and market access. Competitive product substitutes, such as traditional machining techniques, face ongoing pressure from the increasing efficiency and precision of laser systems. End-user demographics show a shift towards automation and higher-precision manufacturing needs in industries like automotive and electronics. Mergers and acquisitions (M&A) activity is noteworthy, with an estimated xx million USD in deal volume over the past five years, indicating consolidation and strategic expansion within the sector.
- Market Concentration: Moderate, with top 5 players holding approximately xx% market share in 2024.
- Technological Innovation: Fiber laser advancements are significantly impacting market growth, particularly in high-power applications.
- Regulatory Landscape: Safety standards and environmental regulations influence product design and market entry.
- M&A Activity: xx million USD in deal volume (2019-2024), indicating industry consolidation.
- Innovation Barriers: High R&D costs and the need for specialized expertise.
Industrial Lasers Industry Growth Trends & Insights
The industrial lasers market is projected to exhibit a Compound Annual Growth Rate (CAGR) of xx% during the forecast period (2025-2033), driven by several factors. Market size is estimated to reach xx million units by 2025 and xx million units by 2033. The increasing adoption of automation in manufacturing, particularly across the automotive and consumer electronics sectors, is a major growth driver. Technological advancements such as the development of higher-power fiber lasers and improved beam quality are leading to greater efficiency and precision in laser processing applications. Consumer behavior shifts toward customized and high-precision products fuel demand for advanced laser technologies. Market penetration of fiber lasers continues to increase, surpassing xx% in 2024 and expected to reach xx% by 2033. Disruptive technologies, such as ultrafast lasers for micromachining, are creating new application niches and expanding the market’s scope.
Dominant Regions, Countries, or Segments in Industrial Lasers Industry
North America and Asia-Pacific currently dominate the industrial lasers market, fueled by robust manufacturing sectors and technological innovation. Within these regions, China and the United States are key growth drivers. The fiber laser segment holds the largest market share due to its high efficiency and versatility, exceeding xx% in 2024 and anticipated to reach xx% by 2033. Within applications, cutting and welding are major revenue generators, reflecting the prevalence of laser-based material processing in numerous industries. The automotive sector is a dominant end-user industry, accounting for xx% of market share in 2024, driven by the increasing demand for lightweight and high-precision automotive components.
- Key Growth Drivers:
- Strong manufacturing sectors in North America and Asia-Pacific.
- Government initiatives promoting industrial automation and technological advancement.
- Rapid growth in the consumer electronics and automotive industries.
- Dominant Segments:
- Fiber Lasers: Superior efficiency and versatility drive market dominance.
- Automotive Industry: High demand for precise and automated manufacturing processes.
- Cutting & Welding Applications: Wide adoption in various manufacturing processes.
Industrial Lasers Industry Product Landscape
The industrial lasers market offers a diverse range of products, including fiber lasers, solid-state lasers, CO2 lasers, and other specialized laser systems. Recent product innovations focus on increased power output, improved beam quality, and enhanced system integration. Fiber lasers, in particular, dominate the market due to their high efficiency, compact size, and suitability for various applications, including cutting, welding, marking, and additive manufacturing. These systems are increasingly equipped with advanced control software and machine vision capabilities, optimizing processing precision and automation. Unique selling propositions include speed, precision, and cost-effectiveness compared to traditional manufacturing methods.
Key Drivers, Barriers & Challenges in Industrial Lasers Industry
Key Drivers:
- Increasing automation in manufacturing across various industries.
- Advancements in laser technology, leading to higher power, efficiency, and precision.
- Growing demand for high-precision and customized products.
Key Challenges:
- High initial investment costs associated with laser systems.
- Skilled labor requirements for operation and maintenance.
- Potential safety concerns related to laser operation and emissions. The industry faces xx% of reported accidents in 2024 due to improper safety protocols, impacting market growth.
Emerging Opportunities in Industrial Lasers Industry
The industrial lasers market presents significant opportunities in several areas. The rise of additive manufacturing (3D printing) is creating significant demand for high-power lasers capable of rapid prototyping and mass production. The development of novel laser-based material processing techniques, particularly for advanced materials, promises to expand the market's scope. Untapped markets exist in developing economies, where the adoption of advanced manufacturing technologies is increasing.
Growth Accelerators in the Industrial Lasers Industry
Technological breakthroughs, especially in the development of high-power, compact, and cost-effective fiber lasers, are significantly accelerating market growth. Strategic partnerships between laser manufacturers and end-users are facilitating the adoption of advanced laser technologies in specific applications. Market expansion strategies, such as targeting new industries and emerging applications, are contributing to the market's expansion.
Key Players Shaping the Industrial Lasers Industry Market
- Coherent Inc
- ACSYS Lasertechnik Inc
- Lumentum Holdings Inc
- Lumibird SA
- Han’s Laser Technology Industry Group Co Ltd
- Newport Corporation (MKS Instruments Inc )
- Trumpf Group
- Jenoptik A
- Clark-MXR Inc
- IPG Photonics
Notable Milestones in Industrial Lasers Industry Sector
- January 2024: IPG Photonics showcased new fiber laser solutions at Photonics West, highlighting advancements in laser sources and integrated systems.
- January 2024: Coherent Corp. launched the ExactWeld 410 laser welding system for medical device manufacturing, emphasizing ease of use and process validation.
In-Depth Industrial Lasers Industry Market Outlook
The industrial lasers market is poised for continued growth, driven by technological advancements, automation trends, and expanding applications across diverse industries. The long-term outlook remains positive, with significant opportunities for market expansion through the development of novel laser technologies, strategic partnerships, and penetration into new markets. Focusing on high-growth segments like additive manufacturing and emerging applications will be key to capturing the market's full potential.
Industrial Lasers Industry Segmentation
-
1. Type
- 1.1. Fiber Laser
- 1.2. Solid-state Laser
- 1.3. CO2 Laser
- 1.4. Other Types
-
2. Application
- 2.1. Cutting
- 2.2. Welding
- 2.3. Marking
- 2.4. Drilling
- 2.5. Additive Manufacturing
- 2.6. Other Applications
-
3. End-user Industry
- 3.1. Aerospace and Defense
- 3.2. Automotive
- 3.3. Healthcare
- 3.4. Consumer Electronics
- 3.5. Semiconductors
- 3.6. Other End-user Industries
Industrial Lasers Industry Segmentation By Geography
- 1. North America
- 2. Europe
- 3. Asia Pacific
- 4. Latin America
- 5. Middle East and Africa
Industrial Lasers Industry REPORT HIGHLIGHTS
| Aspects | Details |
|---|---|
| Study Period | 2019-2033 |
| Base Year | 2024 |
| Estimated Year | 2025 |
| Forecast Period | 2025-2033 |
| Historical Period | 2019-2024 |
| Growth Rate | CAGR of 5.10% from 2019-2033 |
| Segmentation |
|
Table of Contents
- 1. Introduction
- 1.1. Research Scope
- 1.2. Market Segmentation
- 1.3. Research Methodology
- 1.4. Definitions and Assumptions
- 2. Executive Summary
- 2.1. Introduction
- 3. Market Dynamics
- 3.1. Introduction
- 3.2. Market Drivers
- 3.2.1. Enhanced Precision and Accuracy over Conventional Alternatives; Miniaturization of Component Parts
- 3.3. Market Restrains
- 3.3.1. Regulation Compliance Associated with Laser Usage
- 3.4. Market Trends
- 3.4.1. Consumer Electronics to Witness Major Growth
- 4. Market Factor Analysis
- 4.1. Porters Five Forces
- 4.2. Supply/Value Chain
- 4.3. PESTEL analysis
- 4.4. Market Entropy
- 4.5. Patent/Trademark Analysis
- 5. Global Industrial Lasers Industry Analysis, Insights and Forecast, 2019-2031
- 5.1. Market Analysis, Insights and Forecast - by Type
- 5.1.1. Fiber Laser
- 5.1.2. Solid-state Laser
- 5.1.3. CO2 Laser
- 5.1.4. Other Types
- 5.2. Market Analysis, Insights and Forecast - by Application
- 5.2.1. Cutting
- 5.2.2. Welding
- 5.2.3. Marking
- 5.2.4. Drilling
- 5.2.5. Additive Manufacturing
- 5.2.6. Other Applications
- 5.3. Market Analysis, Insights and Forecast - by End-user Industry
- 5.3.1. Aerospace and Defense
- 5.3.2. Automotive
- 5.3.3. Healthcare
- 5.3.4. Consumer Electronics
- 5.3.5. Semiconductors
- 5.3.6. Other End-user Industries
- 5.4. Market Analysis, Insights and Forecast - by Region
- 5.4.1. North America
- 5.4.2. Europe
- 5.4.3. Asia Pacific
- 5.4.4. Latin America
- 5.4.5. Middle East and Africa
- 5.1. Market Analysis, Insights and Forecast - by Type
- 6. North America Industrial Lasers Industry Analysis, Insights and Forecast, 2019-2031
- 6.1. Market Analysis, Insights and Forecast - by Type
- 6.1.1. Fiber Laser
- 6.1.2. Solid-state Laser
- 6.1.3. CO2 Laser
- 6.1.4. Other Types
- 6.2. Market Analysis, Insights and Forecast - by Application
- 6.2.1. Cutting
- 6.2.2. Welding
- 6.2.3. Marking
- 6.2.4. Drilling
- 6.2.5. Additive Manufacturing
- 6.2.6. Other Applications
- 6.3. Market Analysis, Insights and Forecast - by End-user Industry
- 6.3.1. Aerospace and Defense
- 6.3.2. Automotive
- 6.3.3. Healthcare
- 6.3.4. Consumer Electronics
- 6.3.5. Semiconductors
- 6.3.6. Other End-user Industries
- 6.1. Market Analysis, Insights and Forecast - by Type
- 7. Europe Industrial Lasers Industry Analysis, Insights and Forecast, 2019-2031
- 7.1. Market Analysis, Insights and Forecast - by Type
- 7.1.1. Fiber Laser
- 7.1.2. Solid-state Laser
- 7.1.3. CO2 Laser
- 7.1.4. Other Types
- 7.2. Market Analysis, Insights and Forecast - by Application
- 7.2.1. Cutting
- 7.2.2. Welding
- 7.2.3. Marking
- 7.2.4. Drilling
- 7.2.5. Additive Manufacturing
- 7.2.6. Other Applications
- 7.3. Market Analysis, Insights and Forecast - by End-user Industry
- 7.3.1. Aerospace and Defense
- 7.3.2. Automotive
- 7.3.3. Healthcare
- 7.3.4. Consumer Electronics
- 7.3.5. Semiconductors
- 7.3.6. Other End-user Industries
- 7.1. Market Analysis, Insights and Forecast - by Type
- 8. Asia Pacific Industrial Lasers Industry Analysis, Insights and Forecast, 2019-2031
- 8.1. Market Analysis, Insights and Forecast - by Type
- 8.1.1. Fiber Laser
- 8.1.2. Solid-state Laser
- 8.1.3. CO2 Laser
- 8.1.4. Other Types
- 8.2. Market Analysis, Insights and Forecast - by Application
- 8.2.1. Cutting
- 8.2.2. Welding
- 8.2.3. Marking
- 8.2.4. Drilling
- 8.2.5. Additive Manufacturing
- 8.2.6. Other Applications
- 8.3. Market Analysis, Insights and Forecast - by End-user Industry
- 8.3.1. Aerospace and Defense
- 8.3.2. Automotive
- 8.3.3. Healthcare
- 8.3.4. Consumer Electronics
- 8.3.5. Semiconductors
- 8.3.6. Other End-user Industries
- 8.1. Market Analysis, Insights and Forecast - by Type
- 9. Latin America Industrial Lasers Industry Analysis, Insights and Forecast, 2019-2031
- 9.1. Market Analysis, Insights and Forecast - by Type
- 9.1.1. Fiber Laser
- 9.1.2. Solid-state Laser
- 9.1.3. CO2 Laser
- 9.1.4. Other Types
- 9.2. Market Analysis, Insights and Forecast - by Application
- 9.2.1. Cutting
- 9.2.2. Welding
- 9.2.3. Marking
- 9.2.4. Drilling
- 9.2.5. Additive Manufacturing
- 9.2.6. Other Applications
- 9.3. Market Analysis, Insights and Forecast - by End-user Industry
- 9.3.1. Aerospace and Defense
- 9.3.2. Automotive
- 9.3.3. Healthcare
- 9.3.4. Consumer Electronics
- 9.3.5. Semiconductors
- 9.3.6. Other End-user Industries
- 9.1. Market Analysis, Insights and Forecast - by Type
- 10. Middle East and Africa Industrial Lasers Industry Analysis, Insights and Forecast, 2019-2031
- 10.1. Market Analysis, Insights and Forecast - by Type
- 10.1.1. Fiber Laser
- 10.1.2. Solid-state Laser
- 10.1.3. CO2 Laser
- 10.1.4. Other Types
- 10.2. Market Analysis, Insights and Forecast - by Application
- 10.2.1. Cutting
- 10.2.2. Welding
- 10.2.3. Marking
- 10.2.4. Drilling
- 10.2.5. Additive Manufacturing
- 10.2.6. Other Applications
- 10.3. Market Analysis, Insights and Forecast - by End-user Industry
- 10.3.1. Aerospace and Defense
- 10.3.2. Automotive
- 10.3.3. Healthcare
- 10.3.4. Consumer Electronics
- 10.3.5. Semiconductors
- 10.3.6. Other End-user Industries
- 10.1. Market Analysis, Insights and Forecast - by Type
- 11. North America Industrial Lasers Industry Analysis, Insights and Forecast, 2019-2031
- 11.1. Market Analysis, Insights and Forecast - By Country/Sub-region
- 11.1.1. undefined
- 12. Europe Industrial Lasers Industry Analysis, Insights and Forecast, 2019-2031
- 12.1. Market Analysis, Insights and Forecast - By Country/Sub-region
- 12.1.1. undefined
- 13. Asia Pacific Industrial Lasers Industry Analysis, Insights and Forecast, 2019-2031
- 13.1. Market Analysis, Insights and Forecast - By Country/Sub-region
- 13.1.1. undefined
- 14. South America Industrial Lasers Industry Analysis, Insights and Forecast, 2019-2031
- 14.1. Market Analysis, Insights and Forecast - By Country/Sub-region
- 14.1.1. undefined
- 15. North America Industrial Lasers Industry Analysis, Insights and Forecast, 2019-2031
- 15.1. Market Analysis, Insights and Forecast - By Country/Sub-region
- 15.1.1. undefined
- 16. MEA Industrial Lasers Industry Analysis, Insights and Forecast, 2019-2031
- 16.1. Market Analysis, Insights and Forecast - By Country/Sub-region
- 16.1.1. undefined
- 17. Competitive Analysis
- 17.1. Global Market Share Analysis 2024
- 17.2. Company Profiles
- 17.2.1 Coherent Inc
- 17.2.1.1. Overview
- 17.2.1.2. Products
- 17.2.1.3. SWOT Analysis
- 17.2.1.4. Recent Developments
- 17.2.1.5. Financials (Based on Availability)
- 17.2.2 ACSYS Lasertechnik Inc
- 17.2.2.1. Overview
- 17.2.2.2. Products
- 17.2.2.3. SWOT Analysis
- 17.2.2.4. Recent Developments
- 17.2.2.5. Financials (Based on Availability)
- 17.2.3 Lumentum Holdings Inc
- 17.2.3.1. Overview
- 17.2.3.2. Products
- 17.2.3.3. SWOT Analysis
- 17.2.3.4. Recent Developments
- 17.2.3.5. Financials (Based on Availability)
- 17.2.4 Lumibird SA
- 17.2.4.1. Overview
- 17.2.4.2. Products
- 17.2.4.3. SWOT Analysis
- 17.2.4.4. Recent Developments
- 17.2.4.5. Financials (Based on Availability)
- 17.2.5 Han’s Laser Technology Industry Group Co Ltd
- 17.2.5.1. Overview
- 17.2.5.2. Products
- 17.2.5.3. SWOT Analysis
- 17.2.5.4. Recent Developments
- 17.2.5.5. Financials (Based on Availability)
- 17.2.6 Newport Corporation (MKS Instruments Inc )
- 17.2.6.1. Overview
- 17.2.6.2. Products
- 17.2.6.3. SWOT Analysis
- 17.2.6.4. Recent Developments
- 17.2.6.5. Financials (Based on Availability)
- 17.2.7 Trumpf Group
- 17.2.7.1. Overview
- 17.2.7.2. Products
- 17.2.7.3. SWOT Analysis
- 17.2.7.4. Recent Developments
- 17.2.7.5. Financials (Based on Availability)
- 17.2.8 Jenoptik A
- 17.2.8.1. Overview
- 17.2.8.2. Products
- 17.2.8.3. SWOT Analysis
- 17.2.8.4. Recent Developments
- 17.2.8.5. Financials (Based on Availability)
- 17.2.9 Clark-MXR Inc
- 17.2.9.1. Overview
- 17.2.9.2. Products
- 17.2.9.3. SWOT Analysis
- 17.2.9.4. Recent Developments
- 17.2.9.5. Financials (Based on Availability)
- 17.2.10 IPG Photonics
- 17.2.10.1. Overview
- 17.2.10.2. Products
- 17.2.10.3. SWOT Analysis
- 17.2.10.4. Recent Developments
- 17.2.10.5. Financials (Based on Availability)
- 17.2.1 Coherent Inc
List of Figures
- Figure 1: Global Industrial Lasers Industry Revenue Breakdown (Million, %) by Region 2024 & 2032
- Figure 2: Global Industrial Lasers Industry Volume Breakdown (K Unit, %) by Region 2024 & 2032
- Figure 3: North America Industrial Lasers Industry Revenue (Million), by Country 2024 & 2032
- Figure 4: North America Industrial Lasers Industry Volume (K Unit), by Country 2024 & 2032
- Figure 5: North America Industrial Lasers Industry Revenue Share (%), by Country 2024 & 2032
- Figure 6: North America Industrial Lasers Industry Volume Share (%), by Country 2024 & 2032
- Figure 7: Europe Industrial Lasers Industry Revenue (Million), by Country 2024 & 2032
- Figure 8: Europe Industrial Lasers Industry Volume (K Unit), by Country 2024 & 2032
- Figure 9: Europe Industrial Lasers Industry Revenue Share (%), by Country 2024 & 2032
- Figure 10: Europe Industrial Lasers Industry Volume Share (%), by Country 2024 & 2032
- Figure 11: Asia Pacific Industrial Lasers Industry Revenue (Million), by Country 2024 & 2032
- Figure 12: Asia Pacific Industrial Lasers Industry Volume (K Unit), by Country 2024 & 2032
- Figure 13: Asia Pacific Industrial Lasers Industry Revenue Share (%), by Country 2024 & 2032
- Figure 14: Asia Pacific Industrial Lasers Industry Volume Share (%), by Country 2024 & 2032
- Figure 15: South America Industrial Lasers Industry Revenue (Million), by Country 2024 & 2032
- Figure 16: South America Industrial Lasers Industry Volume (K Unit), by Country 2024 & 2032
- Figure 17: South America Industrial Lasers Industry Revenue Share (%), by Country 2024 & 2032
- Figure 18: South America Industrial Lasers Industry Volume Share (%), by Country 2024 & 2032
- Figure 19: North America Industrial Lasers Industry Revenue (Million), by Country 2024 & 2032
- Figure 20: North America Industrial Lasers Industry Volume (K Unit), by Country 2024 & 2032
- Figure 21: North America Industrial Lasers Industry Revenue Share (%), by Country 2024 & 2032
- Figure 22: North America Industrial Lasers Industry Volume Share (%), by Country 2024 & 2032
- Figure 23: MEA Industrial Lasers Industry Revenue (Million), by Country 2024 & 2032
- Figure 24: MEA Industrial Lasers Industry Volume (K Unit), by Country 2024 & 2032
- Figure 25: MEA Industrial Lasers Industry Revenue Share (%), by Country 2024 & 2032
- Figure 26: MEA Industrial Lasers Industry Volume Share (%), by Country 2024 & 2032
- Figure 27: North America Industrial Lasers Industry Revenue (Million), by Type 2024 & 2032
- Figure 28: North America Industrial Lasers Industry Volume (K Unit), by Type 2024 & 2032
- Figure 29: North America Industrial Lasers Industry Revenue Share (%), by Type 2024 & 2032
- Figure 30: North America Industrial Lasers Industry Volume Share (%), by Type 2024 & 2032
- Figure 31: North America Industrial Lasers Industry Revenue (Million), by Application 2024 & 2032
- Figure 32: North America Industrial Lasers Industry Volume (K Unit), by Application 2024 & 2032
- Figure 33: North America Industrial Lasers Industry Revenue Share (%), by Application 2024 & 2032
- Figure 34: North America Industrial Lasers Industry Volume Share (%), by Application 2024 & 2032
- Figure 35: North America Industrial Lasers Industry Revenue (Million), by End-user Industry 2024 & 2032
- Figure 36: North America Industrial Lasers Industry Volume (K Unit), by End-user Industry 2024 & 2032
- Figure 37: North America Industrial Lasers Industry Revenue Share (%), by End-user Industry 2024 & 2032
- Figure 38: North America Industrial Lasers Industry Volume Share (%), by End-user Industry 2024 & 2032
- Figure 39: North America Industrial Lasers Industry Revenue (Million), by Country 2024 & 2032
- Figure 40: North America Industrial Lasers Industry Volume (K Unit), by Country 2024 & 2032
- Figure 41: North America Industrial Lasers Industry Revenue Share (%), by Country 2024 & 2032
- Figure 42: North America Industrial Lasers Industry Volume Share (%), by Country 2024 & 2032
- Figure 43: Europe Industrial Lasers Industry Revenue (Million), by Type 2024 & 2032
- Figure 44: Europe Industrial Lasers Industry Volume (K Unit), by Type 2024 & 2032
- Figure 45: Europe Industrial Lasers Industry Revenue Share (%), by Type 2024 & 2032
- Figure 46: Europe Industrial Lasers Industry Volume Share (%), by Type 2024 & 2032
- Figure 47: Europe Industrial Lasers Industry Revenue (Million), by Application 2024 & 2032
- Figure 48: Europe Industrial Lasers Industry Volume (K Unit), by Application 2024 & 2032
- Figure 49: Europe Industrial Lasers Industry Revenue Share (%), by Application 2024 & 2032
- Figure 50: Europe Industrial Lasers Industry Volume Share (%), by Application 2024 & 2032
- Figure 51: Europe Industrial Lasers Industry Revenue (Million), by End-user Industry 2024 & 2032
- Figure 52: Europe Industrial Lasers Industry Volume (K Unit), by End-user Industry 2024 & 2032
- Figure 53: Europe Industrial Lasers Industry Revenue Share (%), by End-user Industry 2024 & 2032
- Figure 54: Europe Industrial Lasers Industry Volume Share (%), by End-user Industry 2024 & 2032
- Figure 55: Europe Industrial Lasers Industry Revenue (Million), by Country 2024 & 2032
- Figure 56: Europe Industrial Lasers Industry Volume (K Unit), by Country 2024 & 2032
- Figure 57: Europe Industrial Lasers Industry Revenue Share (%), by Country 2024 & 2032
- Figure 58: Europe Industrial Lasers Industry Volume Share (%), by Country 2024 & 2032
- Figure 59: Asia Pacific Industrial Lasers Industry Revenue (Million), by Type 2024 & 2032
- Figure 60: Asia Pacific Industrial Lasers Industry Volume (K Unit), by Type 2024 & 2032
- Figure 61: Asia Pacific Industrial Lasers Industry Revenue Share (%), by Type 2024 & 2032
- Figure 62: Asia Pacific Industrial Lasers Industry Volume Share (%), by Type 2024 & 2032
- Figure 63: Asia Pacific Industrial Lasers Industry Revenue (Million), by Application 2024 & 2032
- Figure 64: Asia Pacific Industrial Lasers Industry Volume (K Unit), by Application 2024 & 2032
- Figure 65: Asia Pacific Industrial Lasers Industry Revenue Share (%), by Application 2024 & 2032
- Figure 66: Asia Pacific Industrial Lasers Industry Volume Share (%), by Application 2024 & 2032
- Figure 67: Asia Pacific Industrial Lasers Industry Revenue (Million), by End-user Industry 2024 & 2032
- Figure 68: Asia Pacific Industrial Lasers Industry Volume (K Unit), by End-user Industry 2024 & 2032
- Figure 69: Asia Pacific Industrial Lasers Industry Revenue Share (%), by End-user Industry 2024 & 2032
- Figure 70: Asia Pacific Industrial Lasers Industry Volume Share (%), by End-user Industry 2024 & 2032
- Figure 71: Asia Pacific Industrial Lasers Industry Revenue (Million), by Country 2024 & 2032
- Figure 72: Asia Pacific Industrial Lasers Industry Volume (K Unit), by Country 2024 & 2032
- Figure 73: Asia Pacific Industrial Lasers Industry Revenue Share (%), by Country 2024 & 2032
- Figure 74: Asia Pacific Industrial Lasers Industry Volume Share (%), by Country 2024 & 2032
- Figure 75: Latin America Industrial Lasers Industry Revenue (Million), by Type 2024 & 2032
- Figure 76: Latin America Industrial Lasers Industry Volume (K Unit), by Type 2024 & 2032
- Figure 77: Latin America Industrial Lasers Industry Revenue Share (%), by Type 2024 & 2032
- Figure 78: Latin America Industrial Lasers Industry Volume Share (%), by Type 2024 & 2032
- Figure 79: Latin America Industrial Lasers Industry Revenue (Million), by Application 2024 & 2032
- Figure 80: Latin America Industrial Lasers Industry Volume (K Unit), by Application 2024 & 2032
- Figure 81: Latin America Industrial Lasers Industry Revenue Share (%), by Application 2024 & 2032
- Figure 82: Latin America Industrial Lasers Industry Volume Share (%), by Application 2024 & 2032
- Figure 83: Latin America Industrial Lasers Industry Revenue (Million), by End-user Industry 2024 & 2032
- Figure 84: Latin America Industrial Lasers Industry Volume (K Unit), by End-user Industry 2024 & 2032
- Figure 85: Latin America Industrial Lasers Industry Revenue Share (%), by End-user Industry 2024 & 2032
- Figure 86: Latin America Industrial Lasers Industry Volume Share (%), by End-user Industry 2024 & 2032
- Figure 87: Latin America Industrial Lasers Industry Revenue (Million), by Country 2024 & 2032
- Figure 88: Latin America Industrial Lasers Industry Volume (K Unit), by Country 2024 & 2032
- Figure 89: Latin America Industrial Lasers Industry Revenue Share (%), by Country 2024 & 2032
- Figure 90: Latin America Industrial Lasers Industry Volume Share (%), by Country 2024 & 2032
- Figure 91: Middle East and Africa Industrial Lasers Industry Revenue (Million), by Type 2024 & 2032
- Figure 92: Middle East and Africa Industrial Lasers Industry Volume (K Unit), by Type 2024 & 2032
- Figure 93: Middle East and Africa Industrial Lasers Industry Revenue Share (%), by Type 2024 & 2032
- Figure 94: Middle East and Africa Industrial Lasers Industry Volume Share (%), by Type 2024 & 2032
- Figure 95: Middle East and Africa Industrial Lasers Industry Revenue (Million), by Application 2024 & 2032
- Figure 96: Middle East and Africa Industrial Lasers Industry Volume (K Unit), by Application 2024 & 2032
- Figure 97: Middle East and Africa Industrial Lasers Industry Revenue Share (%), by Application 2024 & 2032
- Figure 98: Middle East and Africa Industrial Lasers Industry Volume Share (%), by Application 2024 & 2032
- Figure 99: Middle East and Africa Industrial Lasers Industry Revenue (Million), by End-user Industry 2024 & 2032
- Figure 100: Middle East and Africa Industrial Lasers Industry Volume (K Unit), by End-user Industry 2024 & 2032
- Figure 101: Middle East and Africa Industrial Lasers Industry Revenue Share (%), by End-user Industry 2024 & 2032
- Figure 102: Middle East and Africa Industrial Lasers Industry Volume Share (%), by End-user Industry 2024 & 2032
- Figure 103: Middle East and Africa Industrial Lasers Industry Revenue (Million), by Country 2024 & 2032
- Figure 104: Middle East and Africa Industrial Lasers Industry Volume (K Unit), by Country 2024 & 2032
- Figure 105: Middle East and Africa Industrial Lasers Industry Revenue Share (%), by Country 2024 & 2032
- Figure 106: Middle East and Africa Industrial Lasers Industry Volume Share (%), by Country 2024 & 2032
List of Tables
- Table 1: Global Industrial Lasers Industry Revenue Million Forecast, by Region 2019 & 2032
- Table 2: Global Industrial Lasers Industry Volume K Unit Forecast, by Region 2019 & 2032
- Table 3: Global Industrial Lasers Industry Revenue Million Forecast, by Type 2019 & 2032
- Table 4: Global Industrial Lasers Industry Volume K Unit Forecast, by Type 2019 & 2032
- Table 5: Global Industrial Lasers Industry Revenue Million Forecast, by Application 2019 & 2032
- Table 6: Global Industrial Lasers Industry Volume K Unit Forecast, by Application 2019 & 2032
- Table 7: Global Industrial Lasers Industry Revenue Million Forecast, by End-user Industry 2019 & 2032
- Table 8: Global Industrial Lasers Industry Volume K Unit Forecast, by End-user Industry 2019 & 2032
- Table 9: Global Industrial Lasers Industry Revenue Million Forecast, by Region 2019 & 2032
- Table 10: Global Industrial Lasers Industry Volume K Unit Forecast, by Region 2019 & 2032
- Table 11: Global Industrial Lasers Industry Revenue Million Forecast, by Country 2019 & 2032
- Table 12: Global Industrial Lasers Industry Volume K Unit Forecast, by Country 2019 & 2032
- Table 13: Global Industrial Lasers Industry Revenue Million Forecast, by Country 2019 & 2032
- Table 14: Global Industrial Lasers Industry Volume K Unit Forecast, by Country 2019 & 2032
- Table 15: Global Industrial Lasers Industry Revenue Million Forecast, by Country 2019 & 2032
- Table 16: Global Industrial Lasers Industry Volume K Unit Forecast, by Country 2019 & 2032
- Table 17: Global Industrial Lasers Industry Revenue Million Forecast, by Country 2019 & 2032
- Table 18: Global Industrial Lasers Industry Volume K Unit Forecast, by Country 2019 & 2032
- Table 19: Global Industrial Lasers Industry Revenue Million Forecast, by Country 2019 & 2032
- Table 20: Global Industrial Lasers Industry Volume K Unit Forecast, by Country 2019 & 2032
- Table 21: Global Industrial Lasers Industry Revenue Million Forecast, by Country 2019 & 2032
- Table 22: Global Industrial Lasers Industry Volume K Unit Forecast, by Country 2019 & 2032
- Table 23: Global Industrial Lasers Industry Revenue Million Forecast, by Type 2019 & 2032
- Table 24: Global Industrial Lasers Industry Volume K Unit Forecast, by Type 2019 & 2032
- Table 25: Global Industrial Lasers Industry Revenue Million Forecast, by Application 2019 & 2032
- Table 26: Global Industrial Lasers Industry Volume K Unit Forecast, by Application 2019 & 2032
- Table 27: Global Industrial Lasers Industry Revenue Million Forecast, by End-user Industry 2019 & 2032
- Table 28: Global Industrial Lasers Industry Volume K Unit Forecast, by End-user Industry 2019 & 2032
- Table 29: Global Industrial Lasers Industry Revenue Million Forecast, by Country 2019 & 2032
- Table 30: Global Industrial Lasers Industry Volume K Unit Forecast, by Country 2019 & 2032
- Table 31: Global Industrial Lasers Industry Revenue Million Forecast, by Type 2019 & 2032
- Table 32: Global Industrial Lasers Industry Volume K Unit Forecast, by Type 2019 & 2032
- Table 33: Global Industrial Lasers Industry Revenue Million Forecast, by Application 2019 & 2032
- Table 34: Global Industrial Lasers Industry Volume K Unit Forecast, by Application 2019 & 2032
- Table 35: Global Industrial Lasers Industry Revenue Million Forecast, by End-user Industry 2019 & 2032
- Table 36: Global Industrial Lasers Industry Volume K Unit Forecast, by End-user Industry 2019 & 2032
- Table 37: Global Industrial Lasers Industry Revenue Million Forecast, by Country 2019 & 2032
- Table 38: Global Industrial Lasers Industry Volume K Unit Forecast, by Country 2019 & 2032
- Table 39: Global Industrial Lasers Industry Revenue Million Forecast, by Type 2019 & 2032
- Table 40: Global Industrial Lasers Industry Volume K Unit Forecast, by Type 2019 & 2032
- Table 41: Global Industrial Lasers Industry Revenue Million Forecast, by Application 2019 & 2032
- Table 42: Global Industrial Lasers Industry Volume K Unit Forecast, by Application 2019 & 2032
- Table 43: Global Industrial Lasers Industry Revenue Million Forecast, by End-user Industry 2019 & 2032
- Table 44: Global Industrial Lasers Industry Volume K Unit Forecast, by End-user Industry 2019 & 2032
- Table 45: Global Industrial Lasers Industry Revenue Million Forecast, by Country 2019 & 2032
- Table 46: Global Industrial Lasers Industry Volume K Unit Forecast, by Country 2019 & 2032
- Table 47: Global Industrial Lasers Industry Revenue Million Forecast, by Type 2019 & 2032
- Table 48: Global Industrial Lasers Industry Volume K Unit Forecast, by Type 2019 & 2032
- Table 49: Global Industrial Lasers Industry Revenue Million Forecast, by Application 2019 & 2032
- Table 50: Global Industrial Lasers Industry Volume K Unit Forecast, by Application 2019 & 2032
- Table 51: Global Industrial Lasers Industry Revenue Million Forecast, by End-user Industry 2019 & 2032
- Table 52: Global Industrial Lasers Industry Volume K Unit Forecast, by End-user Industry 2019 & 2032
- Table 53: Global Industrial Lasers Industry Revenue Million Forecast, by Country 2019 & 2032
- Table 54: Global Industrial Lasers Industry Volume K Unit Forecast, by Country 2019 & 2032
- Table 55: Global Industrial Lasers Industry Revenue Million Forecast, by Type 2019 & 2032
- Table 56: Global Industrial Lasers Industry Volume K Unit Forecast, by Type 2019 & 2032
- Table 57: Global Industrial Lasers Industry Revenue Million Forecast, by Application 2019 & 2032
- Table 58: Global Industrial Lasers Industry Volume K Unit Forecast, by Application 2019 & 2032
- Table 59: Global Industrial Lasers Industry Revenue Million Forecast, by End-user Industry 2019 & 2032
- Table 60: Global Industrial Lasers Industry Volume K Unit Forecast, by End-user Industry 2019 & 2032
- Table 61: Global Industrial Lasers Industry Revenue Million Forecast, by Country 2019 & 2032
- Table 62: Global Industrial Lasers Industry Volume K Unit Forecast, by Country 2019 & 2032
Frequently Asked Questions
1. What is the projected Compound Annual Growth Rate (CAGR) of the Industrial Lasers Industry?
The projected CAGR is approximately 5.10%.
2. Which companies are prominent players in the Industrial Lasers Industry?
Key companies in the market include Coherent Inc, ACSYS Lasertechnik Inc, Lumentum Holdings Inc, Lumibird SA, Han’s Laser Technology Industry Group Co Ltd, Newport Corporation (MKS Instruments Inc ), Trumpf Group, Jenoptik A, Clark-MXR Inc, IPG Photonics.
3. What are the main segments of the Industrial Lasers Industry?
The market segments include Type, Application, End-user Industry.
4. Can you provide details about the market size?
The market size is estimated to be USD 6.06 Million as of 2022.
5. What are some drivers contributing to market growth?
Enhanced Precision and Accuracy over Conventional Alternatives; Miniaturization of Component Parts.
6. What are the notable trends driving market growth?
Consumer Electronics to Witness Major Growth.
7. Are there any restraints impacting market growth?
Regulation Compliance Associated with Laser Usage.
8. Can you provide examples of recent developments in the market?
January 2024 - IPG Photonics Corporation highlighted new and innovative fiber laser solutions in San Francisco at Photonics West January 30 - February 01, 2024. The 2,000-square-foot booth displays include a wide range of laser sources, integrated systems, and industry-specific solutions, along with numerous showcases of application samples.
9. What pricing options are available for accessing the report?
Pricing options include single-user, multi-user, and enterprise licenses priced at USD 4750, USD 5250, and USD 8750 respectively.
10. Is the market size provided in terms of value or volume?
The market size is provided in terms of value, measured in Million and volume, measured in K Unit.
11. Are there any specific market keywords associated with the report?
Yes, the market keyword associated with the report is "Industrial Lasers Industry," which aids in identifying and referencing the specific market segment covered.
12. How do I determine which pricing option suits my needs best?
The pricing options vary based on user requirements and access needs. Individual users may opt for single-user licenses, while businesses requiring broader access may choose multi-user or enterprise licenses for cost-effective access to the report.
13. Are there any additional resources or data provided in the Industrial Lasers Industry report?
While the report offers comprehensive insights, it's advisable to review the specific contents or supplementary materials provided to ascertain if additional resources or data are available.
14. How can I stay updated on further developments or reports in the Industrial Lasers Industry?
To stay informed about further developments, trends, and reports in the Industrial Lasers Industry, consider subscribing to industry newsletters, following relevant companies and organizations, or regularly checking reputable industry news sources and publications.
Methodology
Step 1 - Identification of Relevant Samples Size from Population Database


Step 2 - Approaches for Defining Global Market Size (Value, Volume* & Price*)

Note*: In applicable scenarios
Step 3 - Data Sources
Primary Research
- Web Analytics
- Survey Reports
- Research Institute
- Latest Research Reports
- Opinion Leaders
Secondary Research
- Annual Reports
- White Paper
- Latest Press Release
- Industry Association
- Paid Database
- Investor Presentations

Step 4 - Data Triangulation
Involves using different sources of information in order to increase the validity of a study
These sources are likely to be stakeholders in a program - participants, other researchers, program staff, other community members, and so on.
Then we put all data in single framework & apply various statistical tools to find out the dynamic on the market.
During the analysis stage, feedback from the stakeholder groups would be compared to determine areas of agreement as well as areas of divergence


