
Key Insights
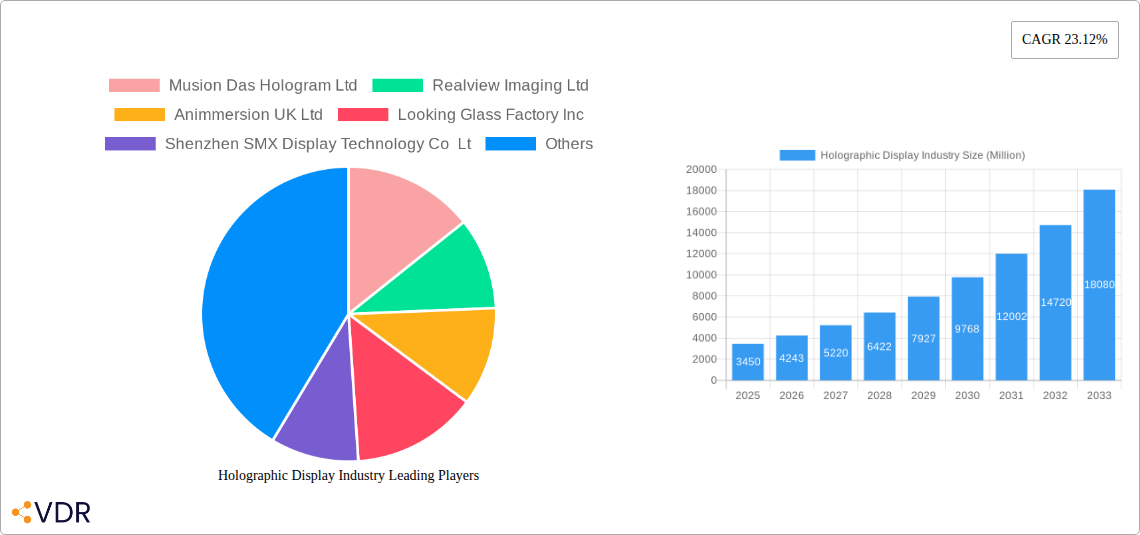
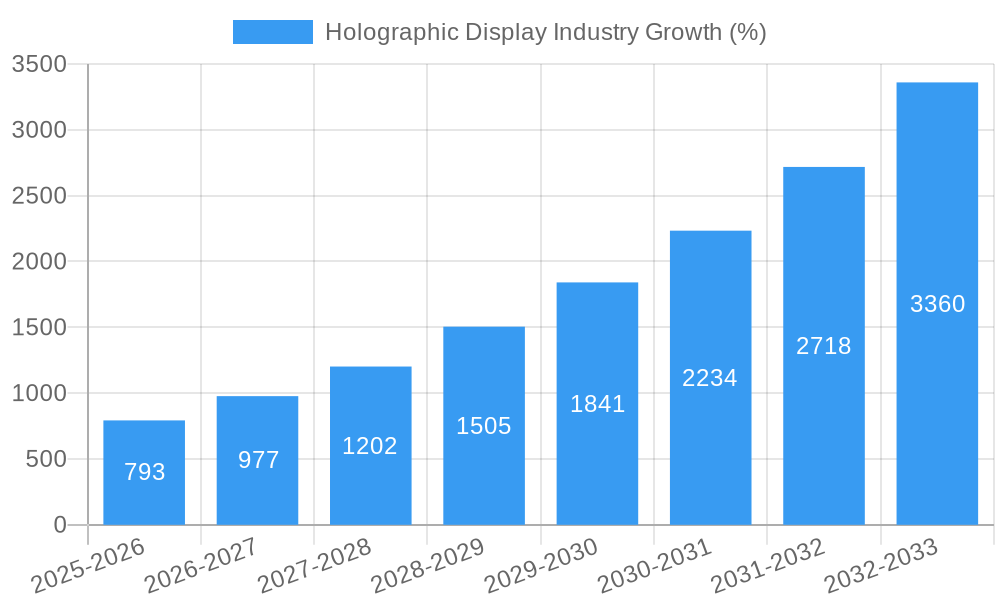
The holographic display market is experiencing rapid growth, projected to reach a market size of $3.45 billion in 2025, expanding at a compound annual growth rate (CAGR) of 23.12%. Several factors fuel this expansion. Firstly, advancements in display technology, such as improved resolution, brightness, and viewing angles, are making holographic displays more commercially viable and attractive to a broader range of applications. Secondly, the increasing demand for immersive and interactive experiences across diverse sectors, including entertainment (concerts, gaming), retail (virtual try-ons, product demonstrations), and healthcare (medical training, diagnostics), is driving adoption. Furthermore, the decreasing cost of production and the integration of holographic displays with other technologies, like augmented reality (AR) and virtual reality (VR), are further contributing to market expansion. The market is segmented by end-user verticals, with consumer electronics, retail, and media & entertainment showing significant growth potential. Companies like Musion Das Hologram Ltd, Realview Imaging Ltd, and Looking Glass Factory Inc. are key players, constantly innovating to enhance capabilities and expand market reach. Geographic expansion, particularly in regions with robust technological infrastructure and high consumer spending, is also boosting market growth.
Despite the significant growth potential, the holographic display market faces certain challenges. High initial investment costs associated with production and integration can hinder widespread adoption, particularly among smaller companies. Furthermore, limitations in the size and resolution of holographic displays, and the need for specialized software and expertise for content creation, pose significant barriers to entry for some industries. However, ongoing technological advancements and cost reductions are expected to mitigate these restraints. Future growth will depend on overcoming these technical and cost-related challenges and tapping into emerging applications, especially those integrating AI for more realistic and interactive experiences. A focus on developing user-friendly software solutions and standardized formats for holographic content will also be crucial in accelerating market penetration.
Holographic Display Industry Market Report: 2019-2033
This comprehensive report provides a detailed analysis of the holographic display market, encompassing market dynamics, growth trends, regional dominance, product landscape, key players, and future opportunities. The study period covers 2019-2033, with 2025 as the base and estimated year, and a forecast period of 2025-2033. The report leverages extensive primary and secondary research to deliver actionable insights for industry professionals, investors, and strategists. The market is segmented by end-user verticals, including consumer electronics, retail, media and entertainment, military and defense, healthcare, automotive, and others. The report projects a market size of xx million units by 2033.
Holographic Display Industry Market Dynamics & Structure
The holographic display market is characterized by moderate concentration, with several key players vying for market share. Technological innovation, particularly in areas like improved resolution, brightness, and cost-effectiveness, is a major driver. Regulatory frameworks concerning data privacy and safety standards are emerging and will influence market growth. The market faces competition from traditional display technologies like LCD and LED, although holographic displays offer unique advantages in terms of immersive experiences. Mergers and acquisitions (M&A) activity is expected to increase, consolidating the market and fostering innovation.
- Market Concentration: Moderately concentrated, with top 5 players holding xx% market share in 2024.
- Technological Innovation: Focus on improving resolution, brightness, reducing latency and cost.
- Regulatory Framework: Emerging regulations concerning data privacy and safety standards impacting adoption rates.
- Competitive Substitutes: LCD, LED, and other advanced display technologies pose competition.
- End-User Demographics: Increasing adoption across various sectors, driven by consumer demand and technological advancements.
- M&A Trends: Growing number of acquisitions expected in the coming years, driving market consolidation. xx M&A deals projected for 2025-2028.
Holographic Display Industry Growth Trends & Insights
The holographic display market is experiencing significant growth, driven by increasing demand across various sectors. Adoption rates are rising steadily, particularly in entertainment and advertising, with the CAGR projected at xx% from 2025 to 2033. Technological advancements like improved light sources, better image processing, and reduced manufacturing costs are contributing to market expansion. Shifting consumer preferences towards immersive and interactive experiences are further fueling market growth. Market penetration is expected to reach xx% by 2033 in key segments like retail and entertainment.
Dominant Regions, Countries, or Segments in Holographic Display Industry
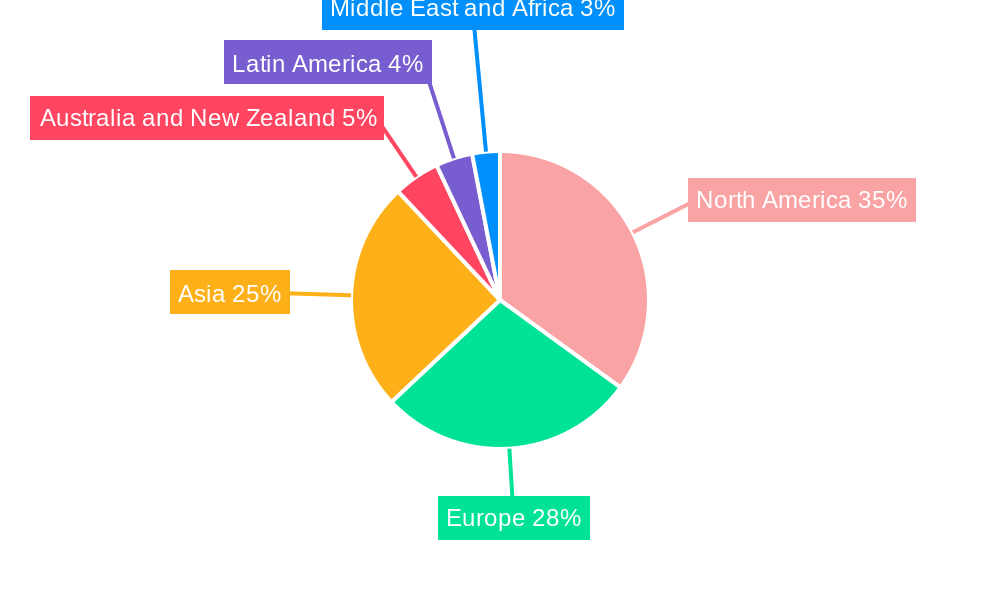
North America and Asia Pacific are currently leading the holographic display market, driven by strong technological advancements and high consumer demand. The Media and Entertainment and Retail segments are exhibiting the highest growth rates, propelled by the increasing use of holographic displays for advertising, immersive experiences, and interactive installations. Government initiatives and investments in research and development further bolster market growth in these regions.
- Key Drivers (North America): Strong technological base, high consumer spending, and supportive regulatory environment.
- Key Drivers (Asia Pacific): Rapid technological advancements, increasing investments in R&D, and growing consumer electronics market.
- Key Drivers (Media & Entertainment): High demand for immersive experiences, increased investments in entertainment technologies, and the rising popularity of virtual and augmented reality.
- Key Drivers (Retail): Growing demand for interactive displays, improved customer engagement, and innovative marketing strategies.
Holographic Display Industry Product Landscape
Holographic displays are evolving rapidly, with new products offering improved resolution, brightness, and viewing angles. Advancements in display technologies, light sources, and image processing have led to more realistic and immersive holographic experiences. Unique selling propositions include depth perception, 3D imagery, and interactive elements unavailable in traditional displays. Future innovations may include flexible and transparent holographic displays, as evidenced by Hyundai Mobis' recent transparent holographic display for vehicles.
Key Drivers, Barriers & Challenges in Holographic Display Industry
Key Drivers:
- Rising demand for immersive experiences in entertainment and advertising.
- Technological advancements leading to higher resolution and brightness.
- Growing investments in R&D by both private and public entities.
Key Challenges:
- High manufacturing costs limiting widespread adoption.
- Limited availability of skilled labor for development and maintenance.
- Competition from alternative display technologies.
- xx million units supply chain deficit projected by 2028.
Emerging Opportunities in Holographic Display Industry
Emerging opportunities exist in untapped markets such as healthcare, education, and industrial applications. The integration of holographic displays with AI and other emerging technologies presents further growth prospects. Evolving consumer preferences towards personalized and interactive experiences create new opportunities for personalized holographic advertisements and interactive entertainment.
Growth Accelerators in the Holographic Display Industry
Technological breakthroughs in display materials, light sources, and image processing are accelerating market growth. Strategic partnerships between display manufacturers, software developers, and content creators are fostering innovation and expanding market reach. Market expansion strategies targeting emerging markets and new applications are further driving growth.
Key Players Shaping the Holographic Display Market
- Musion Das Hologram Ltd
- Realview Imaging Ltd
- Animmersion UK Ltd
- Looking Glass Factory Inc
- Shenzhen SMX Display Technology Co Lt
- Kino-mo Limited (HYPERVSN)
- RealFiction Holding AB
- Provision Holding Inc
Notable Milestones in Holographic Display Industry Sector
- January 2024: Hyundai Mobis unveils the world's first transparent holographic display for next-generation vehicles. This demonstrates significant advancement in the automotive application of holographic technology.
- January 2024: ARHT Media Inc. partners with a global luxury retail brand to install ARHT Capsule hologram displays across multiple continents, signifying a major step toward wider adoption in retail spaces.
In-Depth Holographic Display Industry Market Outlook
The holographic display market is poised for significant expansion in the coming years, driven by technological innovation, increasing adoption across various sectors, and the emergence of new applications. Strategic partnerships and investments in R&D will further accelerate market growth. The market offers promising opportunities for companies with the expertise and resources to capitalize on emerging trends and develop innovative holographic display solutions.
Holographic Display Industry Segmentation
-
1. End-user Verticals
- 1.1. Consumer Electronics
- 1.2. Retail
- 1.3. Media and Entertainment
- 1.4. Military and Defense
- 1.5. Healthcare
- 1.6. Automotive
- 1.7. Other End-user Verticals
Holographic Display Industry Segmentation By Geography
- 1. North America
- 2. Europe
- 3. Asia
- 4. Australia and New Zealand
- 5. Latin America
- 6. Middle East and Africa
Holographic Display Industry REPORT HIGHLIGHTS
| Aspects | Details |
|---|---|
| Study Period | 2019-2033 |
| Base Year | 2024 |
| Estimated Year | 2025 |
| Forecast Period | 2025-2033 |
| Historical Period | 2019-2024 |
| Growth Rate | CAGR of 23.12% from 2019-2033 |
| Segmentation |
|
Table of Contents
- 1. Introduction
- 1.1. Research Scope
- 1.2. Market Segmentation
- 1.3. Research Methodology
- 1.4. Definitions and Assumptions
- 2. Executive Summary
- 2.1. Introduction
- 3. Market Dynamics
- 3.1. Introduction
- 3.2. Market Drivers
- 3.2.1. Increasing Investments in 3D Technology; Advancements in Screenless Displays
- 3.3. Market Restrains
- 3.3.1. High Cost of Assembling Holographic Display Devices; Presence of Substitute Display Products
- 3.4. Market Trends
- 3.4.1. Automotive Segment is Expected to Witness Significant Growth
- 4. Market Factor Analysis
- 4.1. Porters Five Forces
- 4.2. Supply/Value Chain
- 4.3. PESTEL analysis
- 4.4. Market Entropy
- 4.5. Patent/Trademark Analysis
- 5. Global Holographic Display Industry Analysis, Insights and Forecast, 2019-2031
- 5.1. Market Analysis, Insights and Forecast - by End-user Verticals
- 5.1.1. Consumer Electronics
- 5.1.2. Retail
- 5.1.3. Media and Entertainment
- 5.1.4. Military and Defense
- 5.1.5. Healthcare
- 5.1.6. Automotive
- 5.1.7. Other End-user Verticals
- 5.2. Market Analysis, Insights and Forecast - by Region
- 5.2.1. North America
- 5.2.2. Europe
- 5.2.3. Asia
- 5.2.4. Australia and New Zealand
- 5.2.5. Latin America
- 5.2.6. Middle East and Africa
- 5.1. Market Analysis, Insights and Forecast - by End-user Verticals
- 6. North America Holographic Display Industry Analysis, Insights and Forecast, 2019-2031
- 6.1. Market Analysis, Insights and Forecast - by End-user Verticals
- 6.1.1. Consumer Electronics
- 6.1.2. Retail
- 6.1.3. Media and Entertainment
- 6.1.4. Military and Defense
- 6.1.5. Healthcare
- 6.1.6. Automotive
- 6.1.7. Other End-user Verticals
- 6.1. Market Analysis, Insights and Forecast - by End-user Verticals
- 7. Europe Holographic Display Industry Analysis, Insights and Forecast, 2019-2031
- 7.1. Market Analysis, Insights and Forecast - by End-user Verticals
- 7.1.1. Consumer Electronics
- 7.1.2. Retail
- 7.1.3. Media and Entertainment
- 7.1.4. Military and Defense
- 7.1.5. Healthcare
- 7.1.6. Automotive
- 7.1.7. Other End-user Verticals
- 7.1. Market Analysis, Insights and Forecast - by End-user Verticals
- 8. Asia Holographic Display Industry Analysis, Insights and Forecast, 2019-2031
- 8.1. Market Analysis, Insights and Forecast - by End-user Verticals
- 8.1.1. Consumer Electronics
- 8.1.2. Retail
- 8.1.3. Media and Entertainment
- 8.1.4. Military and Defense
- 8.1.5. Healthcare
- 8.1.6. Automotive
- 8.1.7. Other End-user Verticals
- 8.1. Market Analysis, Insights and Forecast - by End-user Verticals
- 9. Australia and New Zealand Holographic Display Industry Analysis, Insights and Forecast, 2019-2031
- 9.1. Market Analysis, Insights and Forecast - by End-user Verticals
- 9.1.1. Consumer Electronics
- 9.1.2. Retail
- 9.1.3. Media and Entertainment
- 9.1.4. Military and Defense
- 9.1.5. Healthcare
- 9.1.6. Automotive
- 9.1.7. Other End-user Verticals
- 9.1. Market Analysis, Insights and Forecast - by End-user Verticals
- 10. Latin America Holographic Display Industry Analysis, Insights and Forecast, 2019-2031
- 10.1. Market Analysis, Insights and Forecast - by End-user Verticals
- 10.1.1. Consumer Electronics
- 10.1.2. Retail
- 10.1.3. Media and Entertainment
- 10.1.4. Military and Defense
- 10.1.5. Healthcare
- 10.1.6. Automotive
- 10.1.7. Other End-user Verticals
- 10.1. Market Analysis, Insights and Forecast - by End-user Verticals
- 11. Middle East and Africa Holographic Display Industry Analysis, Insights and Forecast, 2019-2031
- 11.1. Market Analysis, Insights and Forecast - by End-user Verticals
- 11.1.1. Consumer Electronics
- 11.1.2. Retail
- 11.1.3. Media and Entertainment
- 11.1.4. Military and Defense
- 11.1.5. Healthcare
- 11.1.6. Automotive
- 11.1.7. Other End-user Verticals
- 11.1. Market Analysis, Insights and Forecast - by End-user Verticals
- 12. North America Holographic Display Industry Analysis, Insights and Forecast, 2019-2031
- 12.1. Market Analysis, Insights and Forecast - By Country/Sub-region
- 12.1.1.
- 13. Europe Holographic Display Industry Analysis, Insights and Forecast, 2019-2031
- 13.1. Market Analysis, Insights and Forecast - By Country/Sub-region
- 13.1.1.
- 14. Asia Holographic Display Industry Analysis, Insights and Forecast, 2019-2031
- 14.1. Market Analysis, Insights and Forecast - By Country/Sub-region
- 14.1.1.
- 15. Australia and New Zealand Holographic Display Industry Analysis, Insights and Forecast, 2019-2031
- 15.1. Market Analysis, Insights and Forecast - By Country/Sub-region
- 15.1.1.
- 16. Latin America Holographic Display Industry Analysis, Insights and Forecast, 2019-2031
- 16.1. Market Analysis, Insights and Forecast - By Country/Sub-region
- 16.1.1.
- 17. Middle East and Africa Holographic Display Industry Analysis, Insights and Forecast, 2019-2031
- 17.1. Market Analysis, Insights and Forecast - By Country/Sub-region
- 17.1.1.
- 18. Competitive Analysis
- 18.1. Global Market Share Analysis 2024
- 18.2. Company Profiles
- 18.2.1 Musion Das Hologram Ltd
- 18.2.1.1. Overview
- 18.2.1.2. Products
- 18.2.1.3. SWOT Analysis
- 18.2.1.4. Recent Developments
- 18.2.1.5. Financials (Based on Availability)
- 18.2.2 Realview Imaging Ltd
- 18.2.2.1. Overview
- 18.2.2.2. Products
- 18.2.2.3. SWOT Analysis
- 18.2.2.4. Recent Developments
- 18.2.2.5. Financials (Based on Availability)
- 18.2.3 Animmersion UK Ltd
- 18.2.3.1. Overview
- 18.2.3.2. Products
- 18.2.3.3. SWOT Analysis
- 18.2.3.4. Recent Developments
- 18.2.3.5. Financials (Based on Availability)
- 18.2.4 Looking Glass Factory Inc
- 18.2.4.1. Overview
- 18.2.4.2. Products
- 18.2.4.3. SWOT Analysis
- 18.2.4.4. Recent Developments
- 18.2.4.5. Financials (Based on Availability)
- 18.2.5 Shenzhen SMX Display Technology Co Lt
- 18.2.5.1. Overview
- 18.2.5.2. Products
- 18.2.5.3. SWOT Analysis
- 18.2.5.4. Recent Developments
- 18.2.5.5. Financials (Based on Availability)
- 18.2.6 Kino-mo Limited (HYPERVSN)
- 18.2.6.1. Overview
- 18.2.6.2. Products
- 18.2.6.3. SWOT Analysis
- 18.2.6.4. Recent Developments
- 18.2.6.5. Financials (Based on Availability)
- 18.2.7 RealFiction Holding AB
- 18.2.7.1. Overview
- 18.2.7.2. Products
- 18.2.7.3. SWOT Analysis
- 18.2.7.4. Recent Developments
- 18.2.7.5. Financials (Based on Availability)
- 18.2.8 Provision Holding Inc
- 18.2.8.1. Overview
- 18.2.8.2. Products
- 18.2.8.3. SWOT Analysis
- 18.2.8.4. Recent Developments
- 18.2.8.5. Financials (Based on Availability)
- 18.2.1 Musion Das Hologram Ltd
List of Figures
- Figure 1: Global Holographic Display Industry Revenue Breakdown (Million, %) by Region 2024 & 2032
- Figure 2: North America Holographic Display Industry Revenue (Million), by Country 2024 & 2032
- Figure 3: North America Holographic Display Industry Revenue Share (%), by Country 2024 & 2032
- Figure 4: Europe Holographic Display Industry Revenue (Million), by Country 2024 & 2032
- Figure 5: Europe Holographic Display Industry Revenue Share (%), by Country 2024 & 2032
- Figure 6: Asia Holographic Display Industry Revenue (Million), by Country 2024 & 2032
- Figure 7: Asia Holographic Display Industry Revenue Share (%), by Country 2024 & 2032
- Figure 8: Australia and New Zealand Holographic Display Industry Revenue (Million), by Country 2024 & 2032
- Figure 9: Australia and New Zealand Holographic Display Industry Revenue Share (%), by Country 2024 & 2032
- Figure 10: Latin America Holographic Display Industry Revenue (Million), by Country 2024 & 2032
- Figure 11: Latin America Holographic Display Industry Revenue Share (%), by Country 2024 & 2032
- Figure 12: Middle East and Africa Holographic Display Industry Revenue (Million), by Country 2024 & 2032
- Figure 13: Middle East and Africa Holographic Display Industry Revenue Share (%), by Country 2024 & 2032
- Figure 14: North America Holographic Display Industry Revenue (Million), by End-user Verticals 2024 & 2032
- Figure 15: North America Holographic Display Industry Revenue Share (%), by End-user Verticals 2024 & 2032
- Figure 16: North America Holographic Display Industry Revenue (Million), by Country 2024 & 2032
- Figure 17: North America Holographic Display Industry Revenue Share (%), by Country 2024 & 2032
- Figure 18: Europe Holographic Display Industry Revenue (Million), by End-user Verticals 2024 & 2032
- Figure 19: Europe Holographic Display Industry Revenue Share (%), by End-user Verticals 2024 & 2032
- Figure 20: Europe Holographic Display Industry Revenue (Million), by Country 2024 & 2032
- Figure 21: Europe Holographic Display Industry Revenue Share (%), by Country 2024 & 2032
- Figure 22: Asia Holographic Display Industry Revenue (Million), by End-user Verticals 2024 & 2032
- Figure 23: Asia Holographic Display Industry Revenue Share (%), by End-user Verticals 2024 & 2032
- Figure 24: Asia Holographic Display Industry Revenue (Million), by Country 2024 & 2032
- Figure 25: Asia Holographic Display Industry Revenue Share (%), by Country 2024 & 2032
- Figure 26: Australia and New Zealand Holographic Display Industry Revenue (Million), by End-user Verticals 2024 & 2032
- Figure 27: Australia and New Zealand Holographic Display Industry Revenue Share (%), by End-user Verticals 2024 & 2032
- Figure 28: Australia and New Zealand Holographic Display Industry Revenue (Million), by Country 2024 & 2032
- Figure 29: Australia and New Zealand Holographic Display Industry Revenue Share (%), by Country 2024 & 2032
- Figure 30: Latin America Holographic Display Industry Revenue (Million), by End-user Verticals 2024 & 2032
- Figure 31: Latin America Holographic Display Industry Revenue Share (%), by End-user Verticals 2024 & 2032
- Figure 32: Latin America Holographic Display Industry Revenue (Million), by Country 2024 & 2032
- Figure 33: Latin America Holographic Display Industry Revenue Share (%), by Country 2024 & 2032
- Figure 34: Middle East and Africa Holographic Display Industry Revenue (Million), by End-user Verticals 2024 & 2032
- Figure 35: Middle East and Africa Holographic Display Industry Revenue Share (%), by End-user Verticals 2024 & 2032
- Figure 36: Middle East and Africa Holographic Display Industry Revenue (Million), by Country 2024 & 2032
- Figure 37: Middle East and Africa Holographic Display Industry Revenue Share (%), by Country 2024 & 2032
List of Tables
- Table 1: Global Holographic Display Industry Revenue Million Forecast, by Region 2019 & 2032
- Table 2: Global Holographic Display Industry Revenue Million Forecast, by End-user Verticals 2019 & 2032
- Table 3: Global Holographic Display Industry Revenue Million Forecast, by Region 2019 & 2032
- Table 4: Global Holographic Display Industry Revenue Million Forecast, by Country 2019 & 2032
- Table 5: Holographic Display Industry Revenue (Million) Forecast, by Application 2019 & 2032
- Table 6: Global Holographic Display Industry Revenue Million Forecast, by Country 2019 & 2032
- Table 7: Holographic Display Industry Revenue (Million) Forecast, by Application 2019 & 2032
- Table 8: Global Holographic Display Industry Revenue Million Forecast, by Country 2019 & 2032
- Table 9: Holographic Display Industry Revenue (Million) Forecast, by Application 2019 & 2032
- Table 10: Global Holographic Display Industry Revenue Million Forecast, by Country 2019 & 2032
- Table 11: Holographic Display Industry Revenue (Million) Forecast, by Application 2019 & 2032
- Table 12: Global Holographic Display Industry Revenue Million Forecast, by Country 2019 & 2032
- Table 13: Holographic Display Industry Revenue (Million) Forecast, by Application 2019 & 2032
- Table 14: Global Holographic Display Industry Revenue Million Forecast, by Country 2019 & 2032
- Table 15: Holographic Display Industry Revenue (Million) Forecast, by Application 2019 & 2032
- Table 16: Global Holographic Display Industry Revenue Million Forecast, by End-user Verticals 2019 & 2032
- Table 17: Global Holographic Display Industry Revenue Million Forecast, by Country 2019 & 2032
- Table 18: Global Holographic Display Industry Revenue Million Forecast, by End-user Verticals 2019 & 2032
- Table 19: Global Holographic Display Industry Revenue Million Forecast, by Country 2019 & 2032
- Table 20: Global Holographic Display Industry Revenue Million Forecast, by End-user Verticals 2019 & 2032
- Table 21: Global Holographic Display Industry Revenue Million Forecast, by Country 2019 & 2032
- Table 22: Global Holographic Display Industry Revenue Million Forecast, by End-user Verticals 2019 & 2032
- Table 23: Global Holographic Display Industry Revenue Million Forecast, by Country 2019 & 2032
- Table 24: Global Holographic Display Industry Revenue Million Forecast, by End-user Verticals 2019 & 2032
- Table 25: Global Holographic Display Industry Revenue Million Forecast, by Country 2019 & 2032
- Table 26: Global Holographic Display Industry Revenue Million Forecast, by End-user Verticals 2019 & 2032
- Table 27: Global Holographic Display Industry Revenue Million Forecast, by Country 2019 & 2032
Frequently Asked Questions
1. What is the projected Compound Annual Growth Rate (CAGR) of the Holographic Display Industry?
The projected CAGR is approximately 23.12%.
2. Which companies are prominent players in the Holographic Display Industry?
Key companies in the market include Musion Das Hologram Ltd, Realview Imaging Ltd, Animmersion UK Ltd, Looking Glass Factory Inc, Shenzhen SMX Display Technology Co Lt, Kino-mo Limited (HYPERVSN), RealFiction Holding AB, Provision Holding Inc.
3. What are the main segments of the Holographic Display Industry?
The market segments include End-user Verticals.
4. Can you provide details about the market size?
The market size is estimated to be USD 3.45 Million as of 2022.
5. What are some drivers contributing to market growth?
Increasing Investments in 3D Technology; Advancements in Screenless Displays.
6. What are the notable trends driving market growth?
Automotive Segment is Expected to Witness Significant Growth.
7. Are there any restraints impacting market growth?
High Cost of Assembling Holographic Display Devices; Presence of Substitute Display Products.
8. Can you provide examples of recent developments in the market?
Jan 2024: Hyundai Mobis, Hyundai’s largest supplier, unveiled its latest EV tech. It uses the first transparent display screen using holographic tech. The company revealed its “innovative display series” for next-gen vehicles, which included the “world’s first rollable display and swivel display.” Hyundai Mobis presented a transparent display that uses holographic elements. The display appears on a transparent panel, making it easier for drivers to keep their eyes on the road.
9. What pricing options are available for accessing the report?
Pricing options include single-user, multi-user, and enterprise licenses priced at USD 4750, USD 5250, and USD 8750 respectively.
10. Is the market size provided in terms of value or volume?
The market size is provided in terms of value, measured in Million.
11. Are there any specific market keywords associated with the report?
Yes, the market keyword associated with the report is "Holographic Display Industry," which aids in identifying and referencing the specific market segment covered.
12. How do I determine which pricing option suits my needs best?
The pricing options vary based on user requirements and access needs. Individual users may opt for single-user licenses, while businesses requiring broader access may choose multi-user or enterprise licenses for cost-effective access to the report.
13. Are there any additional resources or data provided in the Holographic Display Industry report?
While the report offers comprehensive insights, it's advisable to review the specific contents or supplementary materials provided to ascertain if additional resources or data are available.
14. How can I stay updated on further developments or reports in the Holographic Display Industry?
To stay informed about further developments, trends, and reports in the Holographic Display Industry, consider subscribing to industry newsletters, following relevant companies and organizations, or regularly checking reputable industry news sources and publications.
Methodology
Step 1 - Identification of Relevant Samples Size from Population Database


Step 2 - Approaches for Defining Global Market Size (Value, Volume* & Price*)

Note*: In applicable scenarios
Step 3 - Data Sources
Primary Research
- Web Analytics
- Survey Reports
- Research Institute
- Latest Research Reports
- Opinion Leaders
Secondary Research
- Annual Reports
- White Paper
- Latest Press Release
- Industry Association
- Paid Database
- Investor Presentations

Step 4 - Data Triangulation
Involves using different sources of information in order to increase the validity of a study
These sources are likely to be stakeholders in a program - participants, other researchers, program staff, other community members, and so on.
Then we put all data in single framework & apply various statistical tools to find out the dynamic on the market.
During the analysis stage, feedback from the stakeholder groups would be compared to determine areas of agreement as well as areas of divergence


