
Key Insights
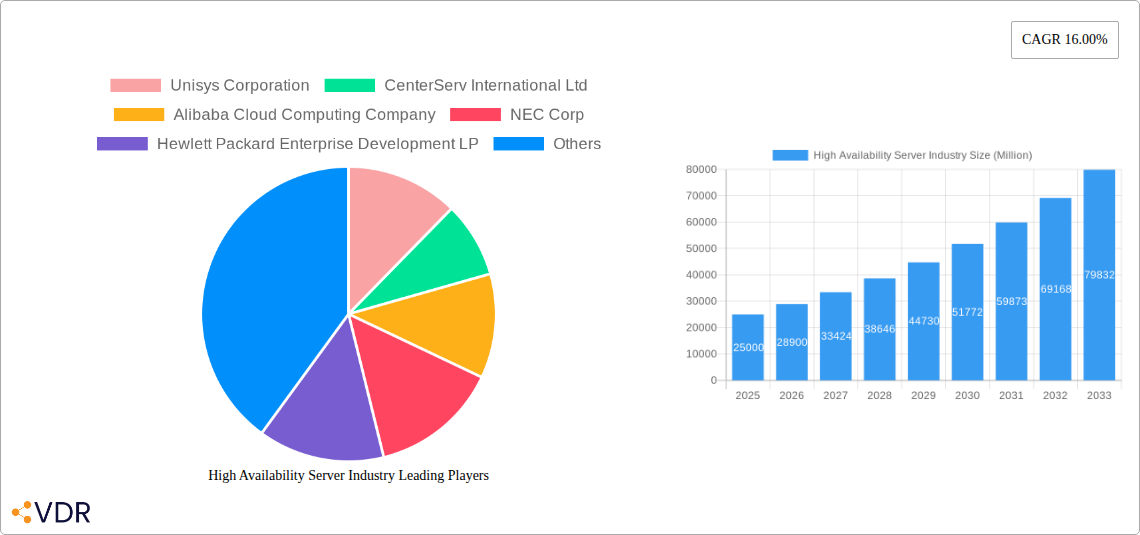
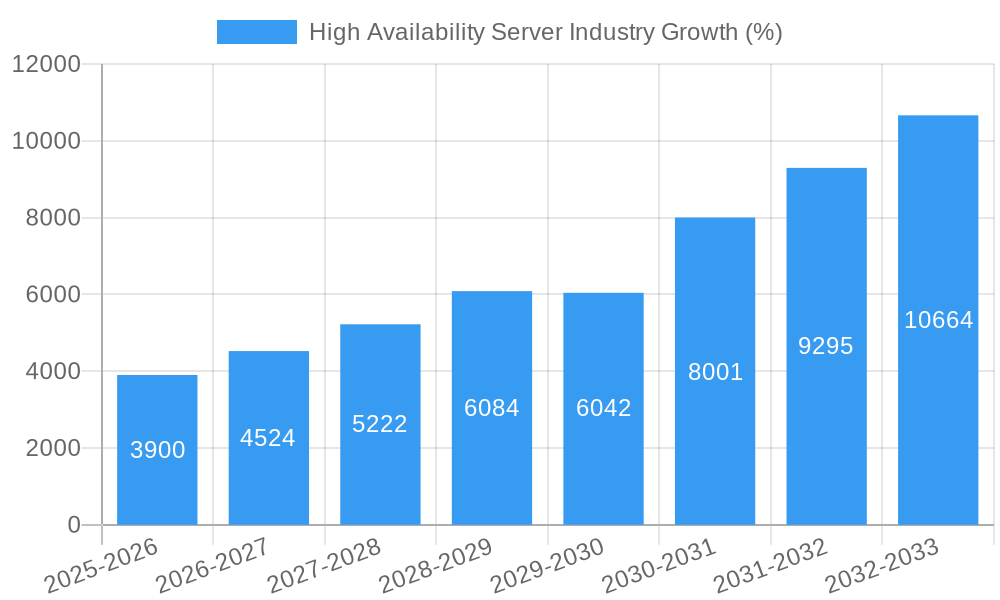
The High Availability Server market is experiencing robust growth, projected to reach a significant size by 2033. A 16% CAGR indicates strong demand driven by several key factors. The increasing reliance on mission-critical applications across diverse sectors like IT & Telecommunications, BFSI, and Healthcare fuels the need for uninterrupted service, making high-availability servers indispensable. Cloud-based deployments are gaining significant traction, offering scalability and cost-effectiveness, while on-premise solutions remain relevant for organizations prioritizing data security and control. The preference for specific operating systems like Windows and Linux reflects established industry standards and compatibility requirements. While the market faces potential restraints such as high initial investment costs and the complexity of implementation, technological advancements and the growing adoption of virtualization are mitigating these challenges. Competition among major players like Unisys, IBM, Hewlett Packard Enterprise, and cloud providers like AWS and Alibaba fuels innovation and drives down costs, ultimately benefiting end-users.
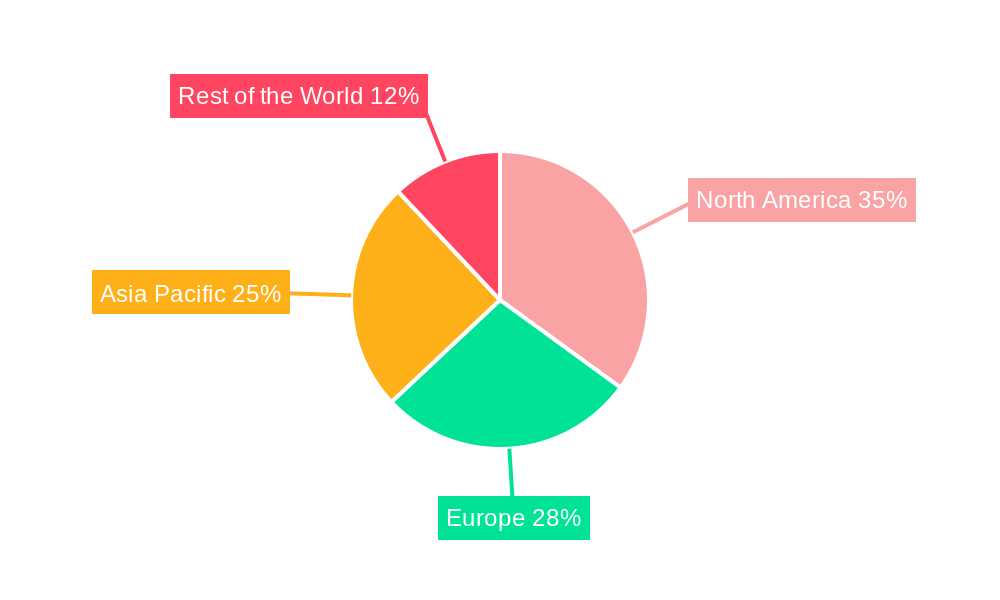
The market segmentation reveals valuable insights into specific growth areas. While the IT & Telecommunication sector currently dominates, the BFSI and Healthcare sectors are experiencing rapid expansion due to increasing digitization and the need for secure data management. The geographic distribution shows robust growth across North America and Asia Pacific, driven by strong technological adoption and economic growth in these regions. Europe also presents a substantial market, though potentially with a slightly slower growth trajectory compared to the other mentioned regions. The forecast period (2025-2033) presents a significant opportunity for market expansion, particularly given ongoing technological advancements and the growing demand for reliable and resilient IT infrastructure across industries. This growth will be further spurred by the increasing adoption of hybrid cloud models, which combine the benefits of both on-premise and cloud-based deployments.
High Availability Server Industry Market Report: 2019-2033
This comprehensive report provides an in-depth analysis of the High Availability Server industry, encompassing market dynamics, growth trends, dominant segments, competitive landscape, and future outlook. The study period covers 2019-2033, with 2025 as the base and estimated year. The forecast period spans 2025-2033, while the historical period encompasses 2019-2024. This report is crucial for industry professionals, investors, and strategic decision-makers seeking to understand and capitalize on opportunities within this rapidly evolving market. The total market size in 2025 is estimated at xx Million.
High Availability Server Industry Market Dynamics & Structure
The High Availability Server market is characterized by a moderately consolidated structure, with key players like Unisys Corporation, Hewlett Packard Enterprise Development LP, IBM Corp, Fujitsu Limited, Juniper Networks Inc, Amazon Web Services Inc, Dell Inc, Cisco System Inc, and Oracle Corp holding significant market share. Technological innovation, particularly in areas like virtualization, cloud computing, and AI-driven management, is a primary growth driver. Stringent data security and compliance regulations influence market dynamics, while the increasing adoption of cloud-based solutions presents both opportunities and challenges. Competitive pressures stem from both established players and emerging niche providers. Mergers and acquisitions (M&A) activity has been moderate in recent years, with approximately xx M&A deals recorded between 2019 and 2024, primarily focused on expanding capabilities and market reach.
- Market Concentration: Moderately consolidated, with top 10 players holding approximately 60% market share in 2025.
- Technological Innovation: Cloud computing, virtualization, AI-driven management are key drivers.
- Regulatory Framework: Compliance standards (e.g., GDPR, HIPAA) impact adoption and vendor selection.
- Competitive Substitutes: Traditional server architectures face competition from cloud-based alternatives.
- End-User Demographics: Growth is fueled by increasing digital transformation across diverse industries.
- M&A Trends: Moderate activity, focused on expanding capabilities and geographical reach.
High Availability Server Industry Growth Trends & Insights
The High Availability Server market experienced robust growth during the historical period (2019-2024), with a CAGR of xx%. This growth is attributed to several factors, including the increasing adoption of cloud computing, the growing demand for data center modernization, and the rising need for business continuity and disaster recovery solutions across various industries. The market is expected to continue its upward trajectory during the forecast period (2025-2033), driven by increasing digital transformation initiatives, the expansion of 5G networks, and the growing adoption of edge computing. However, challenges such as the rising cost of hardware, skilled labor shortages, and security concerns could potentially impede market growth. The market penetration rate is expected to reach xx% by 2033. Technological disruptions like the introduction of serverless computing and advancements in serverless architectures are continuously reshaping consumer behavior, pushing the demand for higher availability, performance, and scalability.
Dominant Regions, Countries, or Segments in High Availability Server Industry
North America and Europe currently hold the largest market shares in the High Availability Server industry, driven by robust IT infrastructure, high technological adoption, and a strong presence of major players. However, the Asia-Pacific region is projected to witness the fastest growth during the forecast period, fueled by rapid economic growth, increasing digitalization, and government initiatives promoting cloud adoption. Within segments, the cloud-based deployment model is experiencing significant growth, surpassing on-premise deployments. Linux operating systems are gaining traction due to their open-source nature and cost-effectiveness. The IT & Telecommunication sector remains the largest end-user industry, followed by BFSI.
Key Drivers:
- North America & Europe: Mature IT infrastructure, high technological adoption.
- Asia-Pacific: Rapid economic growth, increasing digitalization, government initiatives.
- Cloud-based Deployment: Cost-effectiveness, scalability, and flexibility.
- Linux OS: Open-source nature, cost-effectiveness.
- IT & Telecommunication: High demand for reliable and scalable solutions.
Dominance Factors: Market size, growth potential, technological advancements, regulatory environment.
High Availability Server Industry Product Landscape
High Availability Server products are evolving rapidly, incorporating advanced features such as virtualization, containerization, and AI-powered management tools. Key performance metrics include uptime, fault tolerance, scalability, and energy efficiency. Unique selling propositions often center around specialized features designed to meet specific industry requirements, such as real-time processing capabilities for financial transactions or high-bandwidth solutions for telecommunications. The market is witnessing a shift towards modular and composable server designs, which offer enhanced flexibility and scalability.
Key Drivers, Barriers & Challenges in High Availability Server Industry
Key Drivers: Increasing demand for data center modernization, growing adoption of cloud computing and edge computing, stringent data security and compliance regulations, rising need for business continuity and disaster recovery solutions.
Challenges: Rising hardware costs, skilled labor shortages, security concerns, competition from cloud providers. Supply chain disruptions impacting production timelines and increasing costs. Stringent regulatory compliance requirements add to deployment complexity and cost. Intense competition among established players and new entrants exert downward pressure on pricing.
Emerging Opportunities in High Availability Server Industry
Untapped markets in developing economies, particularly in Africa and Latin America, present significant growth opportunities. The growing adoption of IoT and edge computing is creating demand for specialized high-availability servers optimized for resource-constrained environments. The development of sustainable and energy-efficient server solutions is a growing trend, aligning with environmental concerns and increasing energy costs.
Growth Accelerators in the High Availability Server Industry
Technological breakthroughs in areas like serverless computing, AI-powered management, and advanced virtualization will continue to drive market growth. Strategic partnerships between server manufacturers and cloud providers enhance market reach and product integration. Expanding into new markets, particularly in developing economies, offers considerable potential for market expansion.
Key Players Shaping the High Availability Server Industry Market
- Unisys Corporation
- CenterServ International Ltd
- Alibaba Cloud Computing Company
- NEC Corp
- Hewlett Packard Enterprise Development LP
- IBM Corp
- Fujitsu Limited
- Juniper Networks Inc
- Amazon Web Services Inc
- Dell Inc
- Cisco System Inc
- Oracle Corp
Notable Milestones in High Availability Server Industry Sector
- 2020, Q4: Amazon Web Services launched a new generation of high-availability EC2 instances.
- 2021, Q1: Hewlett Packard Enterprise acquired a smaller server technology company specializing in edge computing.
- 2022, Q2: New industry standards were released for server virtualization security.
- 2023, Q3: Significant investments were made in research and development related to serverless computing. (Further details would require specific data).
In-Depth High Availability Server Industry Market Outlook
The High Availability Server market is poised for continued growth over the next decade, driven by the ongoing digital transformation across various industries, increasing demand for cloud services, and advancements in server technologies. Strategic opportunities exist for companies that can offer innovative solutions tailored to specific industry needs, prioritize energy efficiency, and effectively navigate the complexities of global supply chains. The long-term potential of the market remains strong, with ample room for innovation and expansion.
High Availability Server Industry Segmentation
-
1. Deployment
- 1.1. Cloud-based
- 1.2. On-premise
-
2. Operating System
- 2.1. Windows
- 2.2. Linux
- 2.3. Other Operating System ( (UNIX, BSD)
-
3. End-user Industry
- 3.1. IT & Telecommunication
- 3.2. BFSI
- 3.3. Retail
- 3.4. Healthcare
- 3.5. Industrial
- 3.6. Other End-user Industries
High Availability Server Industry Segmentation By Geography
- 1. North America
- 2. Europe
- 3. Asia Pacific
- 4. Rest of the World
High Availability Server Industry REPORT HIGHLIGHTS
| Aspects | Details |
|---|---|
| Study Period | 2019-2033 |
| Base Year | 2024 |
| Estimated Year | 2025 |
| Forecast Period | 2025-2033 |
| Historical Period | 2019-2024 |
| Growth Rate | CAGR of 16.00% from 2019-2033 |
| Segmentation |
|
Table of Contents
- 1. Introduction
- 1.1. Research Scope
- 1.2. Market Segmentation
- 1.3. Research Methodology
- 1.4. Definitions and Assumptions
- 2. Executive Summary
- 2.1. Introduction
- 3. Market Dynamics
- 3.1. Introduction
- 3.2. Market Drivers
- 3.2.1. ; High Adoption Rate of High Availability Server Across BFSI Sector; Growing Demand for Modular & Micro Data Center with the Increasing Application of IoT Devices
- 3.3. Market Restrains
- 3.3.1. ; Lack of Awareness Among Professionals; High Cost for Initial Installation/Deployment
- 3.4. Market Trends
- 3.4.1. BFSI Sector is Expected to Have a Significant Growth Rate
- 4. Market Factor Analysis
- 4.1. Porters Five Forces
- 4.2. Supply/Value Chain
- 4.3. PESTEL analysis
- 4.4. Market Entropy
- 4.5. Patent/Trademark Analysis
- 5. Global High Availability Server Industry Analysis, Insights and Forecast, 2019-2031
- 5.1. Market Analysis, Insights and Forecast - by Deployment
- 5.1.1. Cloud-based
- 5.1.2. On-premise
- 5.2. Market Analysis, Insights and Forecast - by Operating System
- 5.2.1. Windows
- 5.2.2. Linux
- 5.2.3. Other Operating System ( (UNIX, BSD)
- 5.3. Market Analysis, Insights and Forecast - by End-user Industry
- 5.3.1. IT & Telecommunication
- 5.3.2. BFSI
- 5.3.3. Retail
- 5.3.4. Healthcare
- 5.3.5. Industrial
- 5.3.6. Other End-user Industries
- 5.4. Market Analysis, Insights and Forecast - by Region
- 5.4.1. North America
- 5.4.2. Europe
- 5.4.3. Asia Pacific
- 5.4.4. Rest of the World
- 5.1. Market Analysis, Insights and Forecast - by Deployment
- 6. North America High Availability Server Industry Analysis, Insights and Forecast, 2019-2031
- 6.1. Market Analysis, Insights and Forecast - by Deployment
- 6.1.1. Cloud-based
- 6.1.2. On-premise
- 6.2. Market Analysis, Insights and Forecast - by Operating System
- 6.2.1. Windows
- 6.2.2. Linux
- 6.2.3. Other Operating System ( (UNIX, BSD)
- 6.3. Market Analysis, Insights and Forecast - by End-user Industry
- 6.3.1. IT & Telecommunication
- 6.3.2. BFSI
- 6.3.3. Retail
- 6.3.4. Healthcare
- 6.3.5. Industrial
- 6.3.6. Other End-user Industries
- 6.1. Market Analysis, Insights and Forecast - by Deployment
- 7. Europe High Availability Server Industry Analysis, Insights and Forecast, 2019-2031
- 7.1. Market Analysis, Insights and Forecast - by Deployment
- 7.1.1. Cloud-based
- 7.1.2. On-premise
- 7.2. Market Analysis, Insights and Forecast - by Operating System
- 7.2.1. Windows
- 7.2.2. Linux
- 7.2.3. Other Operating System ( (UNIX, BSD)
- 7.3. Market Analysis, Insights and Forecast - by End-user Industry
- 7.3.1. IT & Telecommunication
- 7.3.2. BFSI
- 7.3.3. Retail
- 7.3.4. Healthcare
- 7.3.5. Industrial
- 7.3.6. Other End-user Industries
- 7.1. Market Analysis, Insights and Forecast - by Deployment
- 8. Asia Pacific High Availability Server Industry Analysis, Insights and Forecast, 2019-2031
- 8.1. Market Analysis, Insights and Forecast - by Deployment
- 8.1.1. Cloud-based
- 8.1.2. On-premise
- 8.2. Market Analysis, Insights and Forecast - by Operating System
- 8.2.1. Windows
- 8.2.2. Linux
- 8.2.3. Other Operating System ( (UNIX, BSD)
- 8.3. Market Analysis, Insights and Forecast - by End-user Industry
- 8.3.1. IT & Telecommunication
- 8.3.2. BFSI
- 8.3.3. Retail
- 8.3.4. Healthcare
- 8.3.5. Industrial
- 8.3.6. Other End-user Industries
- 8.1. Market Analysis, Insights and Forecast - by Deployment
- 9. Rest of the World High Availability Server Industry Analysis, Insights and Forecast, 2019-2031
- 9.1. Market Analysis, Insights and Forecast - by Deployment
- 9.1.1. Cloud-based
- 9.1.2. On-premise
- 9.2. Market Analysis, Insights and Forecast - by Operating System
- 9.2.1. Windows
- 9.2.2. Linux
- 9.2.3. Other Operating System ( (UNIX, BSD)
- 9.3. Market Analysis, Insights and Forecast - by End-user Industry
- 9.3.1. IT & Telecommunication
- 9.3.2. BFSI
- 9.3.3. Retail
- 9.3.4. Healthcare
- 9.3.5. Industrial
- 9.3.6. Other End-user Industries
- 9.1. Market Analysis, Insights and Forecast - by Deployment
- 10. North America High Availability Server Industry Analysis, Insights and Forecast, 2019-2031
- 10.1. Market Analysis, Insights and Forecast - By Country/Sub-region
- 10.1.1.
- 11. Europe High Availability Server Industry Analysis, Insights and Forecast, 2019-2031
- 11.1. Market Analysis, Insights and Forecast - By Country/Sub-region
- 11.1.1.
- 12. Asia Pacific High Availability Server Industry Analysis, Insights and Forecast, 2019-2031
- 12.1. Market Analysis, Insights and Forecast - By Country/Sub-region
- 12.1.1.
- 13. Rest of the World High Availability Server Industry Analysis, Insights and Forecast, 2019-2031
- 13.1. Market Analysis, Insights and Forecast - By Country/Sub-region
- 13.1.1.
- 14. Competitive Analysis
- 14.1. Global Market Share Analysis 2024
- 14.2. Company Profiles
- 14.2.1 Unisys Corporation
- 14.2.1.1. Overview
- 14.2.1.2. Products
- 14.2.1.3. SWOT Analysis
- 14.2.1.4. Recent Developments
- 14.2.1.5. Financials (Based on Availability)
- 14.2.2 CenterServ International Ltd
- 14.2.2.1. Overview
- 14.2.2.2. Products
- 14.2.2.3. SWOT Analysis
- 14.2.2.4. Recent Developments
- 14.2.2.5. Financials (Based on Availability)
- 14.2.3 Alibaba Cloud Computing Company
- 14.2.3.1. Overview
- 14.2.3.2. Products
- 14.2.3.3. SWOT Analysis
- 14.2.3.4. Recent Developments
- 14.2.3.5. Financials (Based on Availability)
- 14.2.4 NEC Corp
- 14.2.4.1. Overview
- 14.2.4.2. Products
- 14.2.4.3. SWOT Analysis
- 14.2.4.4. Recent Developments
- 14.2.4.5. Financials (Based on Availability)
- 14.2.5 Hewlett Packard Enterprise Development LP
- 14.2.5.1. Overview
- 14.2.5.2. Products
- 14.2.5.3. SWOT Analysis
- 14.2.5.4. Recent Developments
- 14.2.5.5. Financials (Based on Availability)
- 14.2.6 IBM Corp
- 14.2.6.1. Overview
- 14.2.6.2. Products
- 14.2.6.3. SWOT Analysis
- 14.2.6.4. Recent Developments
- 14.2.6.5. Financials (Based on Availability)
- 14.2.7 Fujitsu Limited
- 14.2.7.1. Overview
- 14.2.7.2. Products
- 14.2.7.3. SWOT Analysis
- 14.2.7.4. Recent Developments
- 14.2.7.5. Financials (Based on Availability)
- 14.2.8 Juniper Networks Inc
- 14.2.8.1. Overview
- 14.2.8.2. Products
- 14.2.8.3. SWOT Analysis
- 14.2.8.4. Recent Developments
- 14.2.8.5. Financials (Based on Availability)
- 14.2.9 Amazon Web Services Inc
- 14.2.9.1. Overview
- 14.2.9.2. Products
- 14.2.9.3. SWOT Analysis
- 14.2.9.4. Recent Developments
- 14.2.9.5. Financials (Based on Availability)
- 14.2.10 Dell Inc
- 14.2.10.1. Overview
- 14.2.10.2. Products
- 14.2.10.3. SWOT Analysis
- 14.2.10.4. Recent Developments
- 14.2.10.5. Financials (Based on Availability)
- 14.2.11 Cisco System Inc
- 14.2.11.1. Overview
- 14.2.11.2. Products
- 14.2.11.3. SWOT Analysis
- 14.2.11.4. Recent Developments
- 14.2.11.5. Financials (Based on Availability)
- 14.2.12 Oracle Corp
- 14.2.12.1. Overview
- 14.2.12.2. Products
- 14.2.12.3. SWOT Analysis
- 14.2.12.4. Recent Developments
- 14.2.12.5. Financials (Based on Availability)
- 14.2.1 Unisys Corporation
List of Figures
- Figure 1: Global High Availability Server Industry Revenue Breakdown (Million, %) by Region 2024 & 2032
- Figure 2: North America High Availability Server Industry Revenue (Million), by Country 2024 & 2032
- Figure 3: North America High Availability Server Industry Revenue Share (%), by Country 2024 & 2032
- Figure 4: Europe High Availability Server Industry Revenue (Million), by Country 2024 & 2032
- Figure 5: Europe High Availability Server Industry Revenue Share (%), by Country 2024 & 2032
- Figure 6: Asia Pacific High Availability Server Industry Revenue (Million), by Country 2024 & 2032
- Figure 7: Asia Pacific High Availability Server Industry Revenue Share (%), by Country 2024 & 2032
- Figure 8: Rest of the World High Availability Server Industry Revenue (Million), by Country 2024 & 2032
- Figure 9: Rest of the World High Availability Server Industry Revenue Share (%), by Country 2024 & 2032
- Figure 10: North America High Availability Server Industry Revenue (Million), by Deployment 2024 & 2032
- Figure 11: North America High Availability Server Industry Revenue Share (%), by Deployment 2024 & 2032
- Figure 12: North America High Availability Server Industry Revenue (Million), by Operating System 2024 & 2032
- Figure 13: North America High Availability Server Industry Revenue Share (%), by Operating System 2024 & 2032
- Figure 14: North America High Availability Server Industry Revenue (Million), by End-user Industry 2024 & 2032
- Figure 15: North America High Availability Server Industry Revenue Share (%), by End-user Industry 2024 & 2032
- Figure 16: North America High Availability Server Industry Revenue (Million), by Country 2024 & 2032
- Figure 17: North America High Availability Server Industry Revenue Share (%), by Country 2024 & 2032
- Figure 18: Europe High Availability Server Industry Revenue (Million), by Deployment 2024 & 2032
- Figure 19: Europe High Availability Server Industry Revenue Share (%), by Deployment 2024 & 2032
- Figure 20: Europe High Availability Server Industry Revenue (Million), by Operating System 2024 & 2032
- Figure 21: Europe High Availability Server Industry Revenue Share (%), by Operating System 2024 & 2032
- Figure 22: Europe High Availability Server Industry Revenue (Million), by End-user Industry 2024 & 2032
- Figure 23: Europe High Availability Server Industry Revenue Share (%), by End-user Industry 2024 & 2032
- Figure 24: Europe High Availability Server Industry Revenue (Million), by Country 2024 & 2032
- Figure 25: Europe High Availability Server Industry Revenue Share (%), by Country 2024 & 2032
- Figure 26: Asia Pacific High Availability Server Industry Revenue (Million), by Deployment 2024 & 2032
- Figure 27: Asia Pacific High Availability Server Industry Revenue Share (%), by Deployment 2024 & 2032
- Figure 28: Asia Pacific High Availability Server Industry Revenue (Million), by Operating System 2024 & 2032
- Figure 29: Asia Pacific High Availability Server Industry Revenue Share (%), by Operating System 2024 & 2032
- Figure 30: Asia Pacific High Availability Server Industry Revenue (Million), by End-user Industry 2024 & 2032
- Figure 31: Asia Pacific High Availability Server Industry Revenue Share (%), by End-user Industry 2024 & 2032
- Figure 32: Asia Pacific High Availability Server Industry Revenue (Million), by Country 2024 & 2032
- Figure 33: Asia Pacific High Availability Server Industry Revenue Share (%), by Country 2024 & 2032
- Figure 34: Rest of the World High Availability Server Industry Revenue (Million), by Deployment 2024 & 2032
- Figure 35: Rest of the World High Availability Server Industry Revenue Share (%), by Deployment 2024 & 2032
- Figure 36: Rest of the World High Availability Server Industry Revenue (Million), by Operating System 2024 & 2032
- Figure 37: Rest of the World High Availability Server Industry Revenue Share (%), by Operating System 2024 & 2032
- Figure 38: Rest of the World High Availability Server Industry Revenue (Million), by End-user Industry 2024 & 2032
- Figure 39: Rest of the World High Availability Server Industry Revenue Share (%), by End-user Industry 2024 & 2032
- Figure 40: Rest of the World High Availability Server Industry Revenue (Million), by Country 2024 & 2032
- Figure 41: Rest of the World High Availability Server Industry Revenue Share (%), by Country 2024 & 2032
List of Tables
- Table 1: Global High Availability Server Industry Revenue Million Forecast, by Region 2019 & 2032
- Table 2: Global High Availability Server Industry Revenue Million Forecast, by Deployment 2019 & 2032
- Table 3: Global High Availability Server Industry Revenue Million Forecast, by Operating System 2019 & 2032
- Table 4: Global High Availability Server Industry Revenue Million Forecast, by End-user Industry 2019 & 2032
- Table 5: Global High Availability Server Industry Revenue Million Forecast, by Region 2019 & 2032
- Table 6: Global High Availability Server Industry Revenue Million Forecast, by Country 2019 & 2032
- Table 7: High Availability Server Industry Revenue (Million) Forecast, by Application 2019 & 2032
- Table 8: Global High Availability Server Industry Revenue Million Forecast, by Country 2019 & 2032
- Table 9: High Availability Server Industry Revenue (Million) Forecast, by Application 2019 & 2032
- Table 10: Global High Availability Server Industry Revenue Million Forecast, by Country 2019 & 2032
- Table 11: High Availability Server Industry Revenue (Million) Forecast, by Application 2019 & 2032
- Table 12: Global High Availability Server Industry Revenue Million Forecast, by Country 2019 & 2032
- Table 13: High Availability Server Industry Revenue (Million) Forecast, by Application 2019 & 2032
- Table 14: Global High Availability Server Industry Revenue Million Forecast, by Deployment 2019 & 2032
- Table 15: Global High Availability Server Industry Revenue Million Forecast, by Operating System 2019 & 2032
- Table 16: Global High Availability Server Industry Revenue Million Forecast, by End-user Industry 2019 & 2032
- Table 17: Global High Availability Server Industry Revenue Million Forecast, by Country 2019 & 2032
- Table 18: Global High Availability Server Industry Revenue Million Forecast, by Deployment 2019 & 2032
- Table 19: Global High Availability Server Industry Revenue Million Forecast, by Operating System 2019 & 2032
- Table 20: Global High Availability Server Industry Revenue Million Forecast, by End-user Industry 2019 & 2032
- Table 21: Global High Availability Server Industry Revenue Million Forecast, by Country 2019 & 2032
- Table 22: Global High Availability Server Industry Revenue Million Forecast, by Deployment 2019 & 2032
- Table 23: Global High Availability Server Industry Revenue Million Forecast, by Operating System 2019 & 2032
- Table 24: Global High Availability Server Industry Revenue Million Forecast, by End-user Industry 2019 & 2032
- Table 25: Global High Availability Server Industry Revenue Million Forecast, by Country 2019 & 2032
- Table 26: Global High Availability Server Industry Revenue Million Forecast, by Deployment 2019 & 2032
- Table 27: Global High Availability Server Industry Revenue Million Forecast, by Operating System 2019 & 2032
- Table 28: Global High Availability Server Industry Revenue Million Forecast, by End-user Industry 2019 & 2032
- Table 29: Global High Availability Server Industry Revenue Million Forecast, by Country 2019 & 2032
Frequently Asked Questions
1. What is the projected Compound Annual Growth Rate (CAGR) of the High Availability Server Industry?
The projected CAGR is approximately 16.00%.
2. Which companies are prominent players in the High Availability Server Industry?
Key companies in the market include Unisys Corporation, CenterServ International Ltd, Alibaba Cloud Computing Company, NEC Corp, Hewlett Packard Enterprise Development LP, IBM Corp, Fujitsu Limited, Juniper Networks Inc, Amazon Web Services Inc, Dell Inc, Cisco System Inc, Oracle Corp.
3. What are the main segments of the High Availability Server Industry?
The market segments include Deployment, Operating System, End-user Industry.
4. Can you provide details about the market size?
The market size is estimated to be USD XX Million as of 2022.
5. What are some drivers contributing to market growth?
; High Adoption Rate of High Availability Server Across BFSI Sector; Growing Demand for Modular & Micro Data Center with the Increasing Application of IoT Devices.
6. What are the notable trends driving market growth?
BFSI Sector is Expected to Have a Significant Growth Rate.
7. Are there any restraints impacting market growth?
; Lack of Awareness Among Professionals; High Cost for Initial Installation/Deployment.
8. Can you provide examples of recent developments in the market?
N/A
9. What pricing options are available for accessing the report?
Pricing options include single-user, multi-user, and enterprise licenses priced at USD 4750, USD 5250, and USD 8750 respectively.
10. Is the market size provided in terms of value or volume?
The market size is provided in terms of value, measured in Million.
11. Are there any specific market keywords associated with the report?
Yes, the market keyword associated with the report is "High Availability Server Industry," which aids in identifying and referencing the specific market segment covered.
12. How do I determine which pricing option suits my needs best?
The pricing options vary based on user requirements and access needs. Individual users may opt for single-user licenses, while businesses requiring broader access may choose multi-user or enterprise licenses for cost-effective access to the report.
13. Are there any additional resources or data provided in the High Availability Server Industry report?
While the report offers comprehensive insights, it's advisable to review the specific contents or supplementary materials provided to ascertain if additional resources or data are available.
14. How can I stay updated on further developments or reports in the High Availability Server Industry?
To stay informed about further developments, trends, and reports in the High Availability Server Industry, consider subscribing to industry newsletters, following relevant companies and organizations, or regularly checking reputable industry news sources and publications.
Methodology
Step 1 - Identification of Relevant Samples Size from Population Database


Step 2 - Approaches for Defining Global Market Size (Value, Volume* & Price*)

Note*: In applicable scenarios
Step 3 - Data Sources
Primary Research
- Web Analytics
- Survey Reports
- Research Institute
- Latest Research Reports
- Opinion Leaders
Secondary Research
- Annual Reports
- White Paper
- Latest Press Release
- Industry Association
- Paid Database
- Investor Presentations

Step 4 - Data Triangulation
Involves using different sources of information in order to increase the validity of a study
These sources are likely to be stakeholders in a program - participants, other researchers, program staff, other community members, and so on.
Then we put all data in single framework & apply various statistical tools to find out the dynamic on the market.
During the analysis stage, feedback from the stakeholder groups would be compared to determine areas of agreement as well as areas of divergence


