
Key Insights
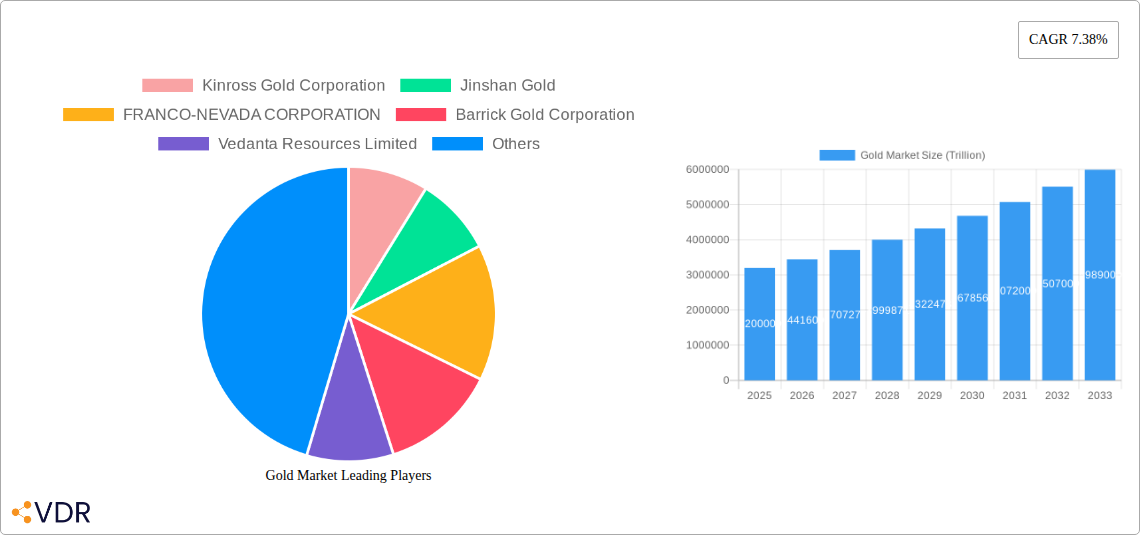
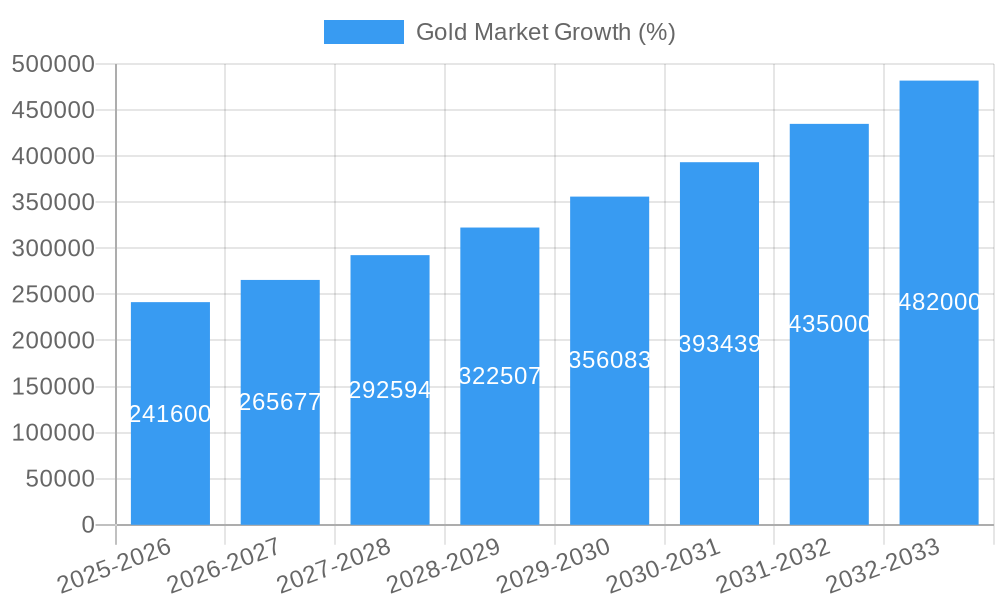
The global gold market, valued at $3.2 trillion in 2025, is projected to experience robust growth, driven by a compound annual growth rate (CAGR) of 7.38% from 2025 to 2033. This expansion is fueled by several key factors. Firstly, the enduring appeal of gold as a safe-haven asset during economic uncertainty continues to stimulate investment demand. Secondly, the burgeoning jewelry industry, particularly in emerging Asian markets like India and China, significantly contributes to gold consumption. Technological advancements in electronics manufacturing are also increasing the demand for gold in various applications, from smartphones to high-tech components. The growth is further supported by the persistent demand for gold in awards, status symbols, and niche applications like dentistry and aerospace. However, factors such as fluctuating gold prices, regulatory changes impacting mining operations, and the increasing focus on sustainable and ethical sourcing of gold present potential restraints on market growth. The market is segmented by type (alloyed gold, layered gold) and application (jewelry, electronics, awards, other applications), allowing for a nuanced understanding of specific growth drivers within each segment. Major players, including Kinross Gold Corporation, Barrick Gold Corporation, and Zijin Mining Group, are strategically positioned to capitalize on this expanding market, though competition remains intense. Geographical analysis reveals significant regional variations in market share, with Asia-Pacific anticipated to maintain a dominant position due to strong domestic demand and considerable manufacturing activities.
The forecast for the gold market through 2033 paints a picture of sustained expansion, albeit with potential challenges. Continued economic uncertainty globally could further bolster gold's appeal as a safe haven, driving investment. However, potential regulatory hurdles related to mining and environmental concerns need to be navigated effectively. Innovation within the electronics sector and expansion of the luxury goods market will be key drivers for future demand, as will the ongoing exploration and development of new gold reserves globally. Companies are increasingly focusing on sustainable practices and ethical sourcing to address growing consumer awareness and enhance their brand reputation. Therefore, strategic adaptation to emerging trends and challenges will be critical for success in this dynamic market. The long-term outlook suggests continued strong growth, though the rate of expansion may vary depending on macroeconomic factors and industry developments.
Gold Market: A Comprehensive Market Report (2019-2033)
This in-depth report provides a comprehensive analysis of the global gold market, encompassing market dynamics, growth trends, regional segmentation, key players, and future outlook. With a study period spanning 2019-2033, a base year of 2025, and a forecast period of 2025-2033, this report is an indispensable resource for industry professionals, investors, and researchers seeking to understand the complexities and opportunities within this dynamic market. The total market size is predicted to reach xx trillion by 2033.
Gold Market Dynamics & Structure
The gold market, a multi-trillion-dollar industry, is characterized by a complex interplay of factors influencing its growth and structure. Market concentration is moderate, with several major players holding significant market share, yet numerous smaller players contribute significantly to the overall volume. Technological innovation, particularly in mining and refining processes, is a key driver, pushing efficiency and reducing costs. Stringent regulatory frameworks concerning environmental impact and ethical sourcing exert influence on operations. While platinum and silver offer some substitutability in specific applications, gold’s unique properties maintain its dominance in jewelry and electronics. End-user demographics play a crucial role; with emerging economies showing increasing demand, particularly in jewelry. M&A activity remains a significant dynamic, with larger corporations seeking to consolidate market share and expand their geographical reach. Recent transactions, like the Pan American Silver-Yamana Gold merger, highlight this trend.
- Market Concentration: Moderate, with top 5 players holding approximately xx% market share (2024).
- Technological Innovation: Focus on automation, enhanced recovery techniques, and sustainable practices.
- Regulatory Framework: Stringent environmental regulations and ethical sourcing standards.
- M&A Activity: Significant increase in mergers and acquisitions in recent years, with xx trillion in deal value between 2019-2024.
- Substitute Products: Limited direct substitutes, with platinum and silver offering partial alternatives.
Gold Market Growth Trends & Insights
The gold market experienced significant growth during the historical period (2019-2024), driven by factors including increased investment demand, industrial applications, and jewelry sales. The market size reached xx trillion in 2024, exhibiting a CAGR of xx% during this period. The forecast period (2025-2033) is projected to witness continued expansion, fueled by consistent demand from both developed and developing economies. Technological advancements in gold mining and refining continue to enhance efficiency and lower production costs, influencing market dynamics. Consumer behavior shifts, influenced by economic fluctuations and investment sentiment, impact demand patterns. Increased adoption of gold in various applications, including electronics and medical devices, further strengthens market growth.
- Market Size (2024): xx trillion
- CAGR (2019-2024): xx%
- Projected Market Size (2033): xx trillion
- Key Growth Drivers: Investment demand, industrial applications, jewelry sales, technological advancements.
Dominant Regions, Countries, or Segments in Gold Market
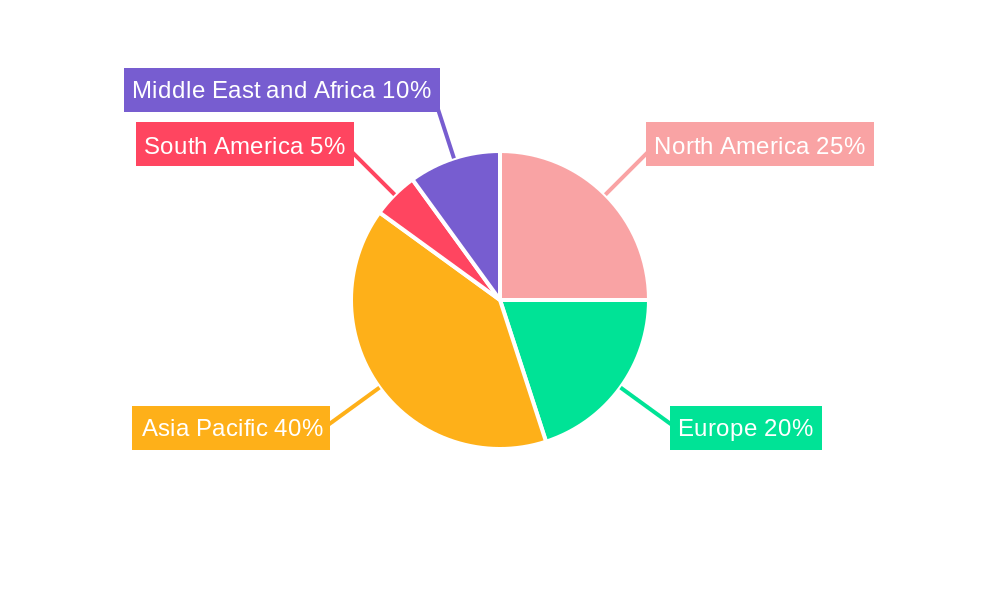
The global gold market displays regional variations in dominance. Historically, Asia-Pacific, particularly China and India, has been the largest consumer of gold due to strong cultural preferences for jewelry and investment. However, North America exhibits significant market presence due to its robust industrial applications in electronics and technological advancements in the mining sector. Among segments, jewelry remains the leading application, accounting for xx% of total market value in 2024. Electronics follows as a significant segment, driven by the increasing demand for gold in microelectronics and other technological components.
- Leading Region: Asia-Pacific (highest consumption)
- Leading Country: China (largest consumer)
- Dominant Segment: Jewellery (by application)
- High-growth Segment: Electronics (due to technological advancements)
- Key Drivers: Economic growth in emerging markets, increasing disposable income, cultural preferences (jewelry), and technological progress (electronics).
Gold Market Product Landscape
The gold market offers a range of products, including alloyed gold, layered gold, and various forms tailored for specific applications. Innovations focus on enhancing purity, improving malleability, and developing specialized alloys with enhanced properties for diverse applications. Alloyed gold, used widely in jewelry, is witnessing innovations in color and durability. Layered gold finds application in electronics, aiming for enhanced conductivity and durability. Performance metrics focus on purity, electrical conductivity, and resistance to corrosion. Unique selling propositions center on superior quality, reliability, and innovative application-specific formulations.
Key Drivers, Barriers & Challenges in Gold Market
Key Drivers: Increased investment demand, particularly during periods of economic uncertainty; rising industrial applications in electronics and other technology sectors; strong demand for gold jewelry, especially in emerging markets; technological advancements in mining and refining, leading to greater efficiency and lower production costs; supportive government policies and regulations in certain countries.
Challenges & Restraints: Volatility in gold prices; geopolitical instability and its impact on supply chains; environmental concerns related to gold mining; fluctuating currency exchange rates; stringent regulatory requirements regarding ethical sourcing and environmental impact; increased competition from substitute materials in certain applications. These factors contributed to a xx% decrease in production in the first quarter of 2024, impacting profitability.
Emerging Opportunities in Gold Market
Emerging opportunities in the gold market include increased demand for sustainably sourced gold, with consumers increasingly prioritizing ethical and environmentally conscious products. Further growth is anticipated in applications beyond traditional jewelry and electronics, including medical devices, aerospace, and specialized coatings. Untapped markets in developing economies present significant growth potential. Innovations in recycling and re-processing techniques will also enhance market sustainability and reduce reliance on primary mining.
Growth Accelerators in the Gold Market Industry
Long-term growth in the gold market will be fueled by several factors. Technological advancements, particularly in mining and refining, will lead to increased efficiency and reduced production costs. Strategic partnerships between mining companies and technology providers can accelerate innovation and drive down costs. Expansion into new markets, particularly in developing economies with rising disposable incomes, presents significant growth potential. Sustainable mining practices and environmentally conscious sourcing will become increasingly important, shaping long-term market dynamics.
Key Players Shaping the Gold Market Market
- Kinross Gold Corporation
- Jinshan Gold
- FRANCO-NEVADA CORPORATION
- Barrick Gold Corporation
- Vedanta Resources Limited
- PJSC Polyus
- Gabriel Resources Ltd
- Tertiary Minerals
- FURUKAWA CO LTD
- Johnson Matthey
- Agnico Eagle Mines Limited
- Zijin Mining Group
- New Gold Inc
- Harmony Gold Mining Company Limited
- Newmont Corporation
Notable Milestones in Gold Market Sector
- February 2023: Barrick Gold announced a 10% increase in attributable proved and probable gold mineral reserves.
- March 2023: Pan American Silver Corporation acquired Yamana Gold Inc., expanding its Latin American operations.
In-Depth Gold Market Market Outlook
The future of the gold market looks promising, driven by sustained demand from diverse sectors, ongoing technological advancements in mining and processing, and the growing importance of sustainable sourcing. Strategic partnerships, technological breakthroughs, and focused expansion into new markets will drive long-term growth. The market's resilience to economic fluctuations and its status as a safe-haven asset further enhance its long-term potential. The strategic focus on sustainable mining, along with diversification of applications, will be critical for long-term success within this dynamic market.
Gold Market Segmentation
-
1. Type
- 1.1. Alloyed Gold
- 1.2. Layered Gold
-
2. Application
- 2.1. Jewellery
- 2.2. Electronics
- 2.3. Awards and Status Symbols
- 2.4. Other Applications (Dentistry, Aerospace, etc.)
Gold Market Segmentation By Geography
-
1. Asia Pacific
- 1.1. China
- 1.2. India
- 1.3. Japan
- 1.4. South Korea
- 1.5. Rest of Asia Pacific
-
2. North America
- 2.1. United States
- 2.2. Canada
- 2.3. Mexico
-
3. Europe
- 3.1. Germany
- 3.2. United Kingdom
- 3.3. Italy
- 3.4. France
- 3.5. Rest of Europe
-
4. South America
- 4.1. Brazil
- 4.2. Argentina
- 4.3. Rest of South America
-
5. Middle East and Africa
- 5.1. Saudi Arabia
- 5.2. South Africa
- 5.3. Rest of Middle East and Africa
Gold Market REPORT HIGHLIGHTS
| Aspects | Details |
|---|---|
| Study Period | 2019-2033 |
| Base Year | 2024 |
| Estimated Year | 2025 |
| Forecast Period | 2025-2033 |
| Historical Period | 2019-2024 |
| Growth Rate | CAGR of 7.38% from 2019-2033 |
| Segmentation |
|
Table of Contents
- 1. Introduction
- 1.1. Research Scope
- 1.2. Market Segmentation
- 1.3. Research Methodology
- 1.4. Definitions and Assumptions
- 2. Executive Summary
- 2.1. Introduction
- 3. Market Dynamics
- 3.1. Introduction
- 3.2. Market Drivers
- 3.2.1. Demand for Gold in the form of Jewelry and Long-term Savings; Increasing Consumption in High-End Electronics Applications; Other Drivers
- 3.3. Market Restrains
- 3.3.1. Declining Ore Grades and Other Technical Challenges; Other Restraints
- 3.4. Market Trends
- 3.4.1. Jewelry Segment to Dominate the Demand
- 4. Market Factor Analysis
- 4.1. Porters Five Forces
- 4.2. Supply/Value Chain
- 4.3. PESTEL analysis
- 4.4. Market Entropy
- 4.5. Patent/Trademark Analysis
- 5. Global Gold Market Analysis, Insights and Forecast, 2019-2031
- 5.1. Market Analysis, Insights and Forecast - by Type
- 5.1.1. Alloyed Gold
- 5.1.2. Layered Gold
- 5.2. Market Analysis, Insights and Forecast - by Application
- 5.2.1. Jewellery
- 5.2.2. Electronics
- 5.2.3. Awards and Status Symbols
- 5.2.4. Other Applications (Dentistry, Aerospace, etc.)
- 5.3. Market Analysis, Insights and Forecast - by Region
- 5.3.1. Asia Pacific
- 5.3.2. North America
- 5.3.3. Europe
- 5.3.4. South America
- 5.3.5. Middle East and Africa
- 5.1. Market Analysis, Insights and Forecast - by Type
- 6. Asia Pacific Gold Market Analysis, Insights and Forecast, 2019-2031
- 6.1. Market Analysis, Insights and Forecast - by Type
- 6.1.1. Alloyed Gold
- 6.1.2. Layered Gold
- 6.2. Market Analysis, Insights and Forecast - by Application
- 6.2.1. Jewellery
- 6.2.2. Electronics
- 6.2.3. Awards and Status Symbols
- 6.2.4. Other Applications (Dentistry, Aerospace, etc.)
- 6.1. Market Analysis, Insights and Forecast - by Type
- 7. North America Gold Market Analysis, Insights and Forecast, 2019-2031
- 7.1. Market Analysis, Insights and Forecast - by Type
- 7.1.1. Alloyed Gold
- 7.1.2. Layered Gold
- 7.2. Market Analysis, Insights and Forecast - by Application
- 7.2.1. Jewellery
- 7.2.2. Electronics
- 7.2.3. Awards and Status Symbols
- 7.2.4. Other Applications (Dentistry, Aerospace, etc.)
- 7.1. Market Analysis, Insights and Forecast - by Type
- 8. Europe Gold Market Analysis, Insights and Forecast, 2019-2031
- 8.1. Market Analysis, Insights and Forecast - by Type
- 8.1.1. Alloyed Gold
- 8.1.2. Layered Gold
- 8.2. Market Analysis, Insights and Forecast - by Application
- 8.2.1. Jewellery
- 8.2.2. Electronics
- 8.2.3. Awards and Status Symbols
- 8.2.4. Other Applications (Dentistry, Aerospace, etc.)
- 8.1. Market Analysis, Insights and Forecast - by Type
- 9. South America Gold Market Analysis, Insights and Forecast, 2019-2031
- 9.1. Market Analysis, Insights and Forecast - by Type
- 9.1.1. Alloyed Gold
- 9.1.2. Layered Gold
- 9.2. Market Analysis, Insights and Forecast - by Application
- 9.2.1. Jewellery
- 9.2.2. Electronics
- 9.2.3. Awards and Status Symbols
- 9.2.4. Other Applications (Dentistry, Aerospace, etc.)
- 9.1. Market Analysis, Insights and Forecast - by Type
- 10. Middle East and Africa Gold Market Analysis, Insights and Forecast, 2019-2031
- 10.1. Market Analysis, Insights and Forecast - by Type
- 10.1.1. Alloyed Gold
- 10.1.2. Layered Gold
- 10.2. Market Analysis, Insights and Forecast - by Application
- 10.2.1. Jewellery
- 10.2.2. Electronics
- 10.2.3. Awards and Status Symbols
- 10.2.4. Other Applications (Dentistry, Aerospace, etc.)
- 10.1. Market Analysis, Insights and Forecast - by Type
- 11. Asia Pacific Gold Market Analysis, Insights and Forecast, 2019-2031
- 11.1. Market Analysis, Insights and Forecast - By Country/Sub-region
- 11.1.1 China
- 11.1.2 India
- 11.1.3 Japan
- 11.1.4 South Korea
- 11.1.5 Rest of Asia Pacific
- 12. North America Gold Market Analysis, Insights and Forecast, 2019-2031
- 12.1. Market Analysis, Insights and Forecast - By Country/Sub-region
- 12.1.1 United States
- 12.1.2 Canada
- 12.1.3 Mexico
- 13. Europe Gold Market Analysis, Insights and Forecast, 2019-2031
- 13.1. Market Analysis, Insights and Forecast - By Country/Sub-region
- 13.1.1 Germany
- 13.1.2 United Kingdom
- 13.1.3 Italy
- 13.1.4 France
- 13.1.5 Rest of Europe
- 14. South America Gold Market Analysis, Insights and Forecast, 2019-2031
- 14.1. Market Analysis, Insights and Forecast - By Country/Sub-region
- 14.1.1 Brazil
- 14.1.2 Argentina
- 14.1.3 Rest of South America
- 15. Middle East and Africa Gold Market Analysis, Insights and Forecast, 2019-2031
- 15.1. Market Analysis, Insights and Forecast - By Country/Sub-region
- 15.1.1 Saudi Arabia
- 15.1.2 South Africa
- 15.1.3 Rest of Middle East and Africa
- 16. Competitive Analysis
- 16.1. Global Market Share Analysis 2024
- 16.2. Company Profiles
- 16.2.1 Kinross Gold Corporation
- 16.2.1.1. Overview
- 16.2.1.2. Products
- 16.2.1.3. SWOT Analysis
- 16.2.1.4. Recent Developments
- 16.2.1.5. Financials (Based on Availability)
- 16.2.2 Jinshan Gold
- 16.2.2.1. Overview
- 16.2.2.2. Products
- 16.2.2.3. SWOT Analysis
- 16.2.2.4. Recent Developments
- 16.2.2.5. Financials (Based on Availability)
- 16.2.3 FRANCO-NEVADA CORPORATION
- 16.2.3.1. Overview
- 16.2.3.2. Products
- 16.2.3.3. SWOT Analysis
- 16.2.3.4. Recent Developments
- 16.2.3.5. Financials (Based on Availability)
- 16.2.4 Barrick Gold Corporation
- 16.2.4.1. Overview
- 16.2.4.2. Products
- 16.2.4.3. SWOT Analysis
- 16.2.4.4. Recent Developments
- 16.2.4.5. Financials (Based on Availability)
- 16.2.5 Vedanta Resources Limited
- 16.2.5.1. Overview
- 16.2.5.2. Products
- 16.2.5.3. SWOT Analysis
- 16.2.5.4. Recent Developments
- 16.2.5.5. Financials (Based on Availability)
- 16.2.6 PJSC Polyus
- 16.2.6.1. Overview
- 16.2.6.2. Products
- 16.2.6.3. SWOT Analysis
- 16.2.6.4. Recent Developments
- 16.2.6.5. Financials (Based on Availability)
- 16.2.7 Gabriel Resources Ltd
- 16.2.7.1. Overview
- 16.2.7.2. Products
- 16.2.7.3. SWOT Analysis
- 16.2.7.4. Recent Developments
- 16.2.7.5. Financials (Based on Availability)
- 16.2.8 Tertiary Minerals
- 16.2.8.1. Overview
- 16.2.8.2. Products
- 16.2.8.3. SWOT Analysis
- 16.2.8.4. Recent Developments
- 16.2.8.5. Financials (Based on Availability)
- 16.2.9 FURUKAWA CO LTD
- 16.2.9.1. Overview
- 16.2.9.2. Products
- 16.2.9.3. SWOT Analysis
- 16.2.9.4. Recent Developments
- 16.2.9.5. Financials (Based on Availability)
- 16.2.10 Johnson Matthey
- 16.2.10.1. Overview
- 16.2.10.2. Products
- 16.2.10.3. SWOT Analysis
- 16.2.10.4. Recent Developments
- 16.2.10.5. Financials (Based on Availability)
- 16.2.11 Agnico Eagle Mines Limited
- 16.2.11.1. Overview
- 16.2.11.2. Products
- 16.2.11.3. SWOT Analysis
- 16.2.11.4. Recent Developments
- 16.2.11.5. Financials (Based on Availability)
- 16.2.12 Zijin Mining Group*List Not Exhaustive
- 16.2.12.1. Overview
- 16.2.12.2. Products
- 16.2.12.3. SWOT Analysis
- 16.2.12.4. Recent Developments
- 16.2.12.5. Financials (Based on Availability)
- 16.2.13 New Gold Inc
- 16.2.13.1. Overview
- 16.2.13.2. Products
- 16.2.13.3. SWOT Analysis
- 16.2.13.4. Recent Developments
- 16.2.13.5. Financials (Based on Availability)
- 16.2.14 Harmony Gold Mining Company Limited
- 16.2.14.1. Overview
- 16.2.14.2. Products
- 16.2.14.3. SWOT Analysis
- 16.2.14.4. Recent Developments
- 16.2.14.5. Financials (Based on Availability)
- 16.2.15 Newmont Corporation
- 16.2.15.1. Overview
- 16.2.15.2. Products
- 16.2.15.3. SWOT Analysis
- 16.2.15.4. Recent Developments
- 16.2.15.5. Financials (Based on Availability)
- 16.2.1 Kinross Gold Corporation
List of Figures
- Figure 1: Global Gold Market Revenue Breakdown (Trillion, %) by Region 2024 & 2032
- Figure 2: Global Gold Market Volume Breakdown (kilotons, %) by Region 2024 & 2032
- Figure 3: Asia Pacific Gold Market Revenue (Trillion), by Country 2024 & 2032
- Figure 4: Asia Pacific Gold Market Volume (kilotons), by Country 2024 & 2032
- Figure 5: Asia Pacific Gold Market Revenue Share (%), by Country 2024 & 2032
- Figure 6: Asia Pacific Gold Market Volume Share (%), by Country 2024 & 2032
- Figure 7: North America Gold Market Revenue (Trillion), by Country 2024 & 2032
- Figure 8: North America Gold Market Volume (kilotons), by Country 2024 & 2032
- Figure 9: North America Gold Market Revenue Share (%), by Country 2024 & 2032
- Figure 10: North America Gold Market Volume Share (%), by Country 2024 & 2032
- Figure 11: Europe Gold Market Revenue (Trillion), by Country 2024 & 2032
- Figure 12: Europe Gold Market Volume (kilotons), by Country 2024 & 2032
- Figure 13: Europe Gold Market Revenue Share (%), by Country 2024 & 2032
- Figure 14: Europe Gold Market Volume Share (%), by Country 2024 & 2032
- Figure 15: South America Gold Market Revenue (Trillion), by Country 2024 & 2032
- Figure 16: South America Gold Market Volume (kilotons), by Country 2024 & 2032
- Figure 17: South America Gold Market Revenue Share (%), by Country 2024 & 2032
- Figure 18: South America Gold Market Volume Share (%), by Country 2024 & 2032
- Figure 19: Middle East and Africa Gold Market Revenue (Trillion), by Country 2024 & 2032
- Figure 20: Middle East and Africa Gold Market Volume (kilotons), by Country 2024 & 2032
- Figure 21: Middle East and Africa Gold Market Revenue Share (%), by Country 2024 & 2032
- Figure 22: Middle East and Africa Gold Market Volume Share (%), by Country 2024 & 2032
- Figure 23: Asia Pacific Gold Market Revenue (Trillion), by Type 2024 & 2032
- Figure 24: Asia Pacific Gold Market Volume (kilotons), by Type 2024 & 2032
- Figure 25: Asia Pacific Gold Market Revenue Share (%), by Type 2024 & 2032
- Figure 26: Asia Pacific Gold Market Volume Share (%), by Type 2024 & 2032
- Figure 27: Asia Pacific Gold Market Revenue (Trillion), by Application 2024 & 2032
- Figure 28: Asia Pacific Gold Market Volume (kilotons), by Application 2024 & 2032
- Figure 29: Asia Pacific Gold Market Revenue Share (%), by Application 2024 & 2032
- Figure 30: Asia Pacific Gold Market Volume Share (%), by Application 2024 & 2032
- Figure 31: Asia Pacific Gold Market Revenue (Trillion), by Country 2024 & 2032
- Figure 32: Asia Pacific Gold Market Volume (kilotons), by Country 2024 & 2032
- Figure 33: Asia Pacific Gold Market Revenue Share (%), by Country 2024 & 2032
- Figure 34: Asia Pacific Gold Market Volume Share (%), by Country 2024 & 2032
- Figure 35: North America Gold Market Revenue (Trillion), by Type 2024 & 2032
- Figure 36: North America Gold Market Volume (kilotons), by Type 2024 & 2032
- Figure 37: North America Gold Market Revenue Share (%), by Type 2024 & 2032
- Figure 38: North America Gold Market Volume Share (%), by Type 2024 & 2032
- Figure 39: North America Gold Market Revenue (Trillion), by Application 2024 & 2032
- Figure 40: North America Gold Market Volume (kilotons), by Application 2024 & 2032
- Figure 41: North America Gold Market Revenue Share (%), by Application 2024 & 2032
- Figure 42: North America Gold Market Volume Share (%), by Application 2024 & 2032
- Figure 43: North America Gold Market Revenue (Trillion), by Country 2024 & 2032
- Figure 44: North America Gold Market Volume (kilotons), by Country 2024 & 2032
- Figure 45: North America Gold Market Revenue Share (%), by Country 2024 & 2032
- Figure 46: North America Gold Market Volume Share (%), by Country 2024 & 2032
- Figure 47: Europe Gold Market Revenue (Trillion), by Type 2024 & 2032
- Figure 48: Europe Gold Market Volume (kilotons), by Type 2024 & 2032
- Figure 49: Europe Gold Market Revenue Share (%), by Type 2024 & 2032
- Figure 50: Europe Gold Market Volume Share (%), by Type 2024 & 2032
- Figure 51: Europe Gold Market Revenue (Trillion), by Application 2024 & 2032
- Figure 52: Europe Gold Market Volume (kilotons), by Application 2024 & 2032
- Figure 53: Europe Gold Market Revenue Share (%), by Application 2024 & 2032
- Figure 54: Europe Gold Market Volume Share (%), by Application 2024 & 2032
- Figure 55: Europe Gold Market Revenue (Trillion), by Country 2024 & 2032
- Figure 56: Europe Gold Market Volume (kilotons), by Country 2024 & 2032
- Figure 57: Europe Gold Market Revenue Share (%), by Country 2024 & 2032
- Figure 58: Europe Gold Market Volume Share (%), by Country 2024 & 2032
- Figure 59: South America Gold Market Revenue (Trillion), by Type 2024 & 2032
- Figure 60: South America Gold Market Volume (kilotons), by Type 2024 & 2032
- Figure 61: South America Gold Market Revenue Share (%), by Type 2024 & 2032
- Figure 62: South America Gold Market Volume Share (%), by Type 2024 & 2032
- Figure 63: South America Gold Market Revenue (Trillion), by Application 2024 & 2032
- Figure 64: South America Gold Market Volume (kilotons), by Application 2024 & 2032
- Figure 65: South America Gold Market Revenue Share (%), by Application 2024 & 2032
- Figure 66: South America Gold Market Volume Share (%), by Application 2024 & 2032
- Figure 67: South America Gold Market Revenue (Trillion), by Country 2024 & 2032
- Figure 68: South America Gold Market Volume (kilotons), by Country 2024 & 2032
- Figure 69: South America Gold Market Revenue Share (%), by Country 2024 & 2032
- Figure 70: South America Gold Market Volume Share (%), by Country 2024 & 2032
- Figure 71: Middle East and Africa Gold Market Revenue (Trillion), by Type 2024 & 2032
- Figure 72: Middle East and Africa Gold Market Volume (kilotons), by Type 2024 & 2032
- Figure 73: Middle East and Africa Gold Market Revenue Share (%), by Type 2024 & 2032
- Figure 74: Middle East and Africa Gold Market Volume Share (%), by Type 2024 & 2032
- Figure 75: Middle East and Africa Gold Market Revenue (Trillion), by Application 2024 & 2032
- Figure 76: Middle East and Africa Gold Market Volume (kilotons), by Application 2024 & 2032
- Figure 77: Middle East and Africa Gold Market Revenue Share (%), by Application 2024 & 2032
- Figure 78: Middle East and Africa Gold Market Volume Share (%), by Application 2024 & 2032
- Figure 79: Middle East and Africa Gold Market Revenue (Trillion), by Country 2024 & 2032
- Figure 80: Middle East and Africa Gold Market Volume (kilotons), by Country 2024 & 2032
- Figure 81: Middle East and Africa Gold Market Revenue Share (%), by Country 2024 & 2032
- Figure 82: Middle East and Africa Gold Market Volume Share (%), by Country 2024 & 2032
List of Tables
- Table 1: Global Gold Market Revenue Trillion Forecast, by Region 2019 & 2032
- Table 2: Global Gold Market Volume kilotons Forecast, by Region 2019 & 2032
- Table 3: Global Gold Market Revenue Trillion Forecast, by Type 2019 & 2032
- Table 4: Global Gold Market Volume kilotons Forecast, by Type 2019 & 2032
- Table 5: Global Gold Market Revenue Trillion Forecast, by Application 2019 & 2032
- Table 6: Global Gold Market Volume kilotons Forecast, by Application 2019 & 2032
- Table 7: Global Gold Market Revenue Trillion Forecast, by Region 2019 & 2032
- Table 8: Global Gold Market Volume kilotons Forecast, by Region 2019 & 2032
- Table 9: Global Gold Market Revenue Trillion Forecast, by Country 2019 & 2032
- Table 10: Global Gold Market Volume kilotons Forecast, by Country 2019 & 2032
- Table 11: China Gold Market Revenue (Trillion) Forecast, by Application 2019 & 2032
- Table 12: China Gold Market Volume (kilotons) Forecast, by Application 2019 & 2032
- Table 13: India Gold Market Revenue (Trillion) Forecast, by Application 2019 & 2032
- Table 14: India Gold Market Volume (kilotons) Forecast, by Application 2019 & 2032
- Table 15: Japan Gold Market Revenue (Trillion) Forecast, by Application 2019 & 2032
- Table 16: Japan Gold Market Volume (kilotons) Forecast, by Application 2019 & 2032
- Table 17: South Korea Gold Market Revenue (Trillion) Forecast, by Application 2019 & 2032
- Table 18: South Korea Gold Market Volume (kilotons) Forecast, by Application 2019 & 2032
- Table 19: Rest of Asia Pacific Gold Market Revenue (Trillion) Forecast, by Application 2019 & 2032
- Table 20: Rest of Asia Pacific Gold Market Volume (kilotons) Forecast, by Application 2019 & 2032
- Table 21: Global Gold Market Revenue Trillion Forecast, by Country 2019 & 2032
- Table 22: Global Gold Market Volume kilotons Forecast, by Country 2019 & 2032
- Table 23: United States Gold Market Revenue (Trillion) Forecast, by Application 2019 & 2032
- Table 24: United States Gold Market Volume (kilotons) Forecast, by Application 2019 & 2032
- Table 25: Canada Gold Market Revenue (Trillion) Forecast, by Application 2019 & 2032
- Table 26: Canada Gold Market Volume (kilotons) Forecast, by Application 2019 & 2032
- Table 27: Mexico Gold Market Revenue (Trillion) Forecast, by Application 2019 & 2032
- Table 28: Mexico Gold Market Volume (kilotons) Forecast, by Application 2019 & 2032
- Table 29: Global Gold Market Revenue Trillion Forecast, by Country 2019 & 2032
- Table 30: Global Gold Market Volume kilotons Forecast, by Country 2019 & 2032
- Table 31: Germany Gold Market Revenue (Trillion) Forecast, by Application 2019 & 2032
- Table 32: Germany Gold Market Volume (kilotons) Forecast, by Application 2019 & 2032
- Table 33: United Kingdom Gold Market Revenue (Trillion) Forecast, by Application 2019 & 2032
- Table 34: United Kingdom Gold Market Volume (kilotons) Forecast, by Application 2019 & 2032
- Table 35: Italy Gold Market Revenue (Trillion) Forecast, by Application 2019 & 2032
- Table 36: Italy Gold Market Volume (kilotons) Forecast, by Application 2019 & 2032
- Table 37: France Gold Market Revenue (Trillion) Forecast, by Application 2019 & 2032
- Table 38: France Gold Market Volume (kilotons) Forecast, by Application 2019 & 2032
- Table 39: Rest of Europe Gold Market Revenue (Trillion) Forecast, by Application 2019 & 2032
- Table 40: Rest of Europe Gold Market Volume (kilotons) Forecast, by Application 2019 & 2032
- Table 41: Global Gold Market Revenue Trillion Forecast, by Country 2019 & 2032
- Table 42: Global Gold Market Volume kilotons Forecast, by Country 2019 & 2032
- Table 43: Brazil Gold Market Revenue (Trillion) Forecast, by Application 2019 & 2032
- Table 44: Brazil Gold Market Volume (kilotons) Forecast, by Application 2019 & 2032
- Table 45: Argentina Gold Market Revenue (Trillion) Forecast, by Application 2019 & 2032
- Table 46: Argentina Gold Market Volume (kilotons) Forecast, by Application 2019 & 2032
- Table 47: Rest of South America Gold Market Revenue (Trillion) Forecast, by Application 2019 & 2032
- Table 48: Rest of South America Gold Market Volume (kilotons) Forecast, by Application 2019 & 2032
- Table 49: Global Gold Market Revenue Trillion Forecast, by Country 2019 & 2032
- Table 50: Global Gold Market Volume kilotons Forecast, by Country 2019 & 2032
- Table 51: Saudi Arabia Gold Market Revenue (Trillion) Forecast, by Application 2019 & 2032
- Table 52: Saudi Arabia Gold Market Volume (kilotons) Forecast, by Application 2019 & 2032
- Table 53: South Africa Gold Market Revenue (Trillion) Forecast, by Application 2019 & 2032
- Table 54: South Africa Gold Market Volume (kilotons) Forecast, by Application 2019 & 2032
- Table 55: Rest of Middle East and Africa Gold Market Revenue (Trillion) Forecast, by Application 2019 & 2032
- Table 56: Rest of Middle East and Africa Gold Market Volume (kilotons) Forecast, by Application 2019 & 2032
- Table 57: Global Gold Market Revenue Trillion Forecast, by Type 2019 & 2032
- Table 58: Global Gold Market Volume kilotons Forecast, by Type 2019 & 2032
- Table 59: Global Gold Market Revenue Trillion Forecast, by Application 2019 & 2032
- Table 60: Global Gold Market Volume kilotons Forecast, by Application 2019 & 2032
- Table 61: Global Gold Market Revenue Trillion Forecast, by Country 2019 & 2032
- Table 62: Global Gold Market Volume kilotons Forecast, by Country 2019 & 2032
- Table 63: China Gold Market Revenue (Trillion) Forecast, by Application 2019 & 2032
- Table 64: China Gold Market Volume (kilotons) Forecast, by Application 2019 & 2032
- Table 65: India Gold Market Revenue (Trillion) Forecast, by Application 2019 & 2032
- Table 66: India Gold Market Volume (kilotons) Forecast, by Application 2019 & 2032
- Table 67: Japan Gold Market Revenue (Trillion) Forecast, by Application 2019 & 2032
- Table 68: Japan Gold Market Volume (kilotons) Forecast, by Application 2019 & 2032
- Table 69: South Korea Gold Market Revenue (Trillion) Forecast, by Application 2019 & 2032
- Table 70: South Korea Gold Market Volume (kilotons) Forecast, by Application 2019 & 2032
- Table 71: Rest of Asia Pacific Gold Market Revenue (Trillion) Forecast, by Application 2019 & 2032
- Table 72: Rest of Asia Pacific Gold Market Volume (kilotons) Forecast, by Application 2019 & 2032
- Table 73: Global Gold Market Revenue Trillion Forecast, by Type 2019 & 2032
- Table 74: Global Gold Market Volume kilotons Forecast, by Type 2019 & 2032
- Table 75: Global Gold Market Revenue Trillion Forecast, by Application 2019 & 2032
- Table 76: Global Gold Market Volume kilotons Forecast, by Application 2019 & 2032
- Table 77: Global Gold Market Revenue Trillion Forecast, by Country 2019 & 2032
- Table 78: Global Gold Market Volume kilotons Forecast, by Country 2019 & 2032
- Table 79: United States Gold Market Revenue (Trillion) Forecast, by Application 2019 & 2032
- Table 80: United States Gold Market Volume (kilotons) Forecast, by Application 2019 & 2032
- Table 81: Canada Gold Market Revenue (Trillion) Forecast, by Application 2019 & 2032
- Table 82: Canada Gold Market Volume (kilotons) Forecast, by Application 2019 & 2032
- Table 83: Mexico Gold Market Revenue (Trillion) Forecast, by Application 2019 & 2032
- Table 84: Mexico Gold Market Volume (kilotons) Forecast, by Application 2019 & 2032
- Table 85: Global Gold Market Revenue Trillion Forecast, by Type 2019 & 2032
- Table 86: Global Gold Market Volume kilotons Forecast, by Type 2019 & 2032
- Table 87: Global Gold Market Revenue Trillion Forecast, by Application 2019 & 2032
- Table 88: Global Gold Market Volume kilotons Forecast, by Application 2019 & 2032
- Table 89: Global Gold Market Revenue Trillion Forecast, by Country 2019 & 2032
- Table 90: Global Gold Market Volume kilotons Forecast, by Country 2019 & 2032
- Table 91: Germany Gold Market Revenue (Trillion) Forecast, by Application 2019 & 2032
- Table 92: Germany Gold Market Volume (kilotons) Forecast, by Application 2019 & 2032
- Table 93: United Kingdom Gold Market Revenue (Trillion) Forecast, by Application 2019 & 2032
- Table 94: United Kingdom Gold Market Volume (kilotons) Forecast, by Application 2019 & 2032
- Table 95: Italy Gold Market Revenue (Trillion) Forecast, by Application 2019 & 2032
- Table 96: Italy Gold Market Volume (kilotons) Forecast, by Application 2019 & 2032
- Table 97: France Gold Market Revenue (Trillion) Forecast, by Application 2019 & 2032
- Table 98: France Gold Market Volume (kilotons) Forecast, by Application 2019 & 2032
- Table 99: Rest of Europe Gold Market Revenue (Trillion) Forecast, by Application 2019 & 2032
- Table 100: Rest of Europe Gold Market Volume (kilotons) Forecast, by Application 2019 & 2032
- Table 101: Global Gold Market Revenue Trillion Forecast, by Type 2019 & 2032
- Table 102: Global Gold Market Volume kilotons Forecast, by Type 2019 & 2032
- Table 103: Global Gold Market Revenue Trillion Forecast, by Application 2019 & 2032
- Table 104: Global Gold Market Volume kilotons Forecast, by Application 2019 & 2032
- Table 105: Global Gold Market Revenue Trillion Forecast, by Country 2019 & 2032
- Table 106: Global Gold Market Volume kilotons Forecast, by Country 2019 & 2032
- Table 107: Brazil Gold Market Revenue (Trillion) Forecast, by Application 2019 & 2032
- Table 108: Brazil Gold Market Volume (kilotons) Forecast, by Application 2019 & 2032
- Table 109: Argentina Gold Market Revenue (Trillion) Forecast, by Application 2019 & 2032
- Table 110: Argentina Gold Market Volume (kilotons) Forecast, by Application 2019 & 2032
- Table 111: Rest of South America Gold Market Revenue (Trillion) Forecast, by Application 2019 & 2032
- Table 112: Rest of South America Gold Market Volume (kilotons) Forecast, by Application 2019 & 2032
- Table 113: Global Gold Market Revenue Trillion Forecast, by Type 2019 & 2032
- Table 114: Global Gold Market Volume kilotons Forecast, by Type 2019 & 2032
- Table 115: Global Gold Market Revenue Trillion Forecast, by Application 2019 & 2032
- Table 116: Global Gold Market Volume kilotons Forecast, by Application 2019 & 2032
- Table 117: Global Gold Market Revenue Trillion Forecast, by Country 2019 & 2032
- Table 118: Global Gold Market Volume kilotons Forecast, by Country 2019 & 2032
- Table 119: Saudi Arabia Gold Market Revenue (Trillion) Forecast, by Application 2019 & 2032
- Table 120: Saudi Arabia Gold Market Volume (kilotons) Forecast, by Application 2019 & 2032
- Table 121: South Africa Gold Market Revenue (Trillion) Forecast, by Application 2019 & 2032
- Table 122: South Africa Gold Market Volume (kilotons) Forecast, by Application 2019 & 2032
- Table 123: Rest of Middle East and Africa Gold Market Revenue (Trillion) Forecast, by Application 2019 & 2032
- Table 124: Rest of Middle East and Africa Gold Market Volume (kilotons) Forecast, by Application 2019 & 2032
Frequently Asked Questions
1. What is the projected Compound Annual Growth Rate (CAGR) of the Gold Market?
The projected CAGR is approximately 7.38%.
2. Which companies are prominent players in the Gold Market?
Key companies in the market include Kinross Gold Corporation, Jinshan Gold, FRANCO-NEVADA CORPORATION, Barrick Gold Corporation, Vedanta Resources Limited, PJSC Polyus, Gabriel Resources Ltd, Tertiary Minerals, FURUKAWA CO LTD, Johnson Matthey, Agnico Eagle Mines Limited, Zijin Mining Group*List Not Exhaustive, New Gold Inc, Harmony Gold Mining Company Limited, Newmont Corporation.
3. What are the main segments of the Gold Market?
The market segments include Type, Application.
4. Can you provide details about the market size?
The market size is estimated to be USD 3.2 Trillion as of 2022.
5. What are some drivers contributing to market growth?
Demand for Gold in the form of Jewelry and Long-term Savings; Increasing Consumption in High-End Electronics Applications; Other Drivers.
6. What are the notable trends driving market growth?
Jewelry Segment to Dominate the Demand.
7. Are there any restraints impacting market growth?
Declining Ore Grades and Other Technical Challenges; Other Restraints.
8. Can you provide examples of recent developments in the market?
March 2023: Pan American Silver Corporation acquired all the issued and outstanding common shares of Yamana Gold Inc., as part of the arrangement, which includes its mines and increased the geographical operations of the company in Latin America.
9. What pricing options are available for accessing the report?
Pricing options include single-user, multi-user, and enterprise licenses priced at USD 4750, USD 5250, and USD 8750 respectively.
10. Is the market size provided in terms of value or volume?
The market size is provided in terms of value, measured in Trillion and volume, measured in kilotons.
11. Are there any specific market keywords associated with the report?
Yes, the market keyword associated with the report is "Gold Market," which aids in identifying and referencing the specific market segment covered.
12. How do I determine which pricing option suits my needs best?
The pricing options vary based on user requirements and access needs. Individual users may opt for single-user licenses, while businesses requiring broader access may choose multi-user or enterprise licenses for cost-effective access to the report.
13. Are there any additional resources or data provided in the Gold Market report?
While the report offers comprehensive insights, it's advisable to review the specific contents or supplementary materials provided to ascertain if additional resources or data are available.
14. How can I stay updated on further developments or reports in the Gold Market?
To stay informed about further developments, trends, and reports in the Gold Market, consider subscribing to industry newsletters, following relevant companies and organizations, or regularly checking reputable industry news sources and publications.
Methodology
Step 1 - Identification of Relevant Samples Size from Population Database


Step 2 - Approaches for Defining Global Market Size (Value, Volume* & Price*)

Note*: In applicable scenarios
Step 3 - Data Sources
Primary Research
- Web Analytics
- Survey Reports
- Research Institute
- Latest Research Reports
- Opinion Leaders
Secondary Research
- Annual Reports
- White Paper
- Latest Press Release
- Industry Association
- Paid Database
- Investor Presentations

Step 4 - Data Triangulation
Involves using different sources of information in order to increase the validity of a study
These sources are likely to be stakeholders in a program - participants, other researchers, program staff, other community members, and so on.
Then we put all data in single framework & apply various statistical tools to find out the dynamic on the market.
During the analysis stage, feedback from the stakeholder groups would be compared to determine areas of agreement as well as areas of divergence


