Global Valves Market in Chemical Industry Market Analysis and Growth Roadmap

Global Valves Market in Chemical Industry by Production Analysis, by Consumption Analysis, by Import Market Analysis (Value & Volume), by Export Market Analysis (Value & Volume), by Price Trend Analysis, by North America, by Europe, by Asia Pacific, by Latin America, by Middle East and Africa Forecast 2025-2033

Jun 6 2025
Base Year: 2024

234 Pages
Main Logo

Global Valves Market in Chemical Industry Market Analysis and Growth Roadmap


Home
Industries
Technology, Media and Telecom
sponsor image
sponsor image
sponsor image
sponsor image
sponsor image
sponsor image
sponsor image
sponsor image
sponsor image
sponsor image
sponsor image
sponsor image
sponsor image
sponsor image
sponsor image
sponsor image
sponsor image
sponsor image
sponsor image
sponsor image

Tailored for you

  • In-depth Analysis Tailored to Specified Regions or Segments
  • Company Profiles Customized to User Preferences
  • Comprehensive Insights Focused on Specific Segments or Regions
  • Customized Evaluation of Competitive Landscape to Meet Your Needs
  • Tailored Customization to Address Other Specific Requirements
Ask for customization


Key Insights

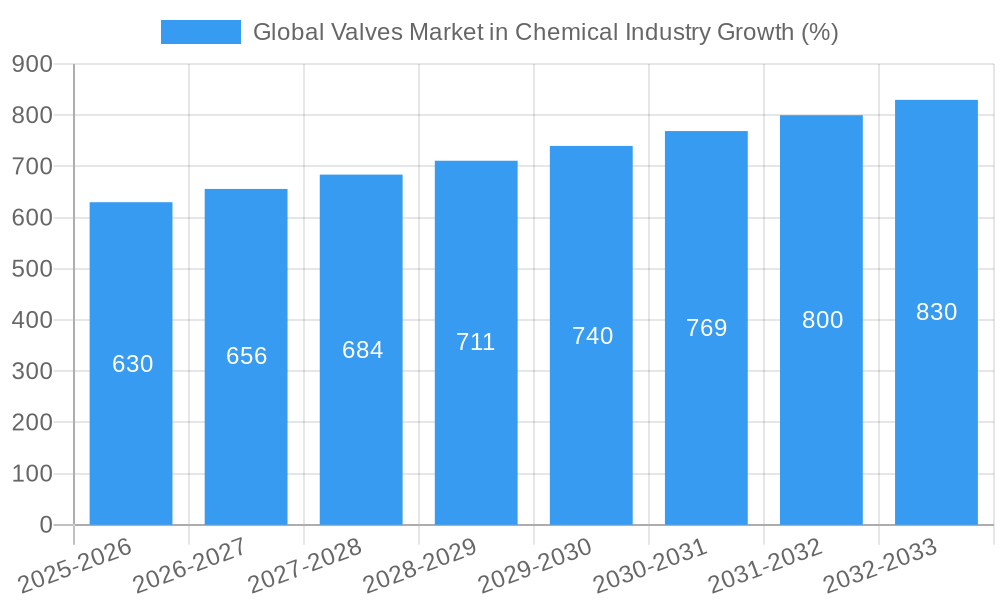
The global valves market within the chemical industry is experiencing robust growth, projected to reach a significant size by 2033. A compound annual growth rate (CAGR) of 4.20% from 2019 to 2024 indicates consistent expansion, driven primarily by the increasing demand for chemical processing and production globally. Factors such as rising investments in infrastructure development, particularly in emerging economies, are fueling this growth. Furthermore, stringent safety regulations and the need for precise process control in chemical plants are driving adoption of advanced valve technologies, including those with enhanced automation and remote monitoring capabilities. The market is segmented by valve type, with ball, butterfly, and gate/globe/check valves dominating the market share due to their widespread applications in various chemical processes. Major players like Valmet Oyj, Rotork Plc, and Flowserve Corporation are actively shaping the market landscape through technological innovations and strategic acquisitions.

However, challenges remain. Fluctuations in raw material prices, especially for specialized valve materials like stainless steel and alloys, can impact profitability. Moreover, the market faces constraints from economic downturns that can affect capital expenditure in the chemical industry. Despite these challenges, the long-term outlook remains positive, fueled by sustained growth in chemical production, the increasing adoption of automation in chemical plants, and a strong focus on enhancing operational efficiency and safety. The Asia Pacific region is expected to showcase considerable growth potential due to rapid industrialization and increasing chemical production capacity within the region. Strategic partnerships and technological advancements aimed at improving valve durability, energy efficiency, and safety are expected to further drive market expansion.

Global Valves Market in Chemical Industry Research Report - Market Size, Growth & Forecast

Global Valves Market in Chemical Industry: A Comprehensive Market Report (2019-2033)

This comprehensive report provides a detailed analysis of the Global Valves Market in the Chemical Industry, offering invaluable insights for industry professionals, investors, and strategic decision-makers. With a focus on market dynamics, growth trends, and key players, this report covers the period from 2019 to 2033, providing a historical overview (2019-2024), current estimations (2025), and future forecasts (2025-2033). The base year for this analysis is 2025. The report segments the market by valve type (Ball, Butterfly, Gate/Globe/Check, Plug, Control, Other Types) and provides regional breakdowns, identifying key growth drivers and challenges across the parent market (Global Valves Market) and its child market (Valves Market in Chemical Industry). Market values are presented in Million units.

Global Valves Market in Chemical Industry Market Dynamics & Structure

This section analyzes the competitive landscape, technological advancements, regulatory influences, and market trends within the global valves market for the chemical industry. The market is characterized by a moderately concentrated structure, with several large players holding significant market share. Technological innovation, driven by the need for improved efficiency, safety, and sustainability, is a major driver. Stringent regulatory frameworks concerning emissions and safety standards also shape market dynamics. The presence of substitute products, such as alternative flow control mechanisms, poses a competitive challenge. Furthermore, mergers and acquisitions (M&A) are impacting the market concentration.

  • Market Concentration: The top 10 players account for approximately xx% of the global market share in 2025.
  • Technological Innovation: Focus on smart valves, automation, and materials science to improve efficiency and reduce maintenance costs. Innovation barriers include high R&D costs and the need for rigorous testing and certification.
  • Regulatory Landscape: Stringent environmental regulations and safety standards drive demand for advanced valve technologies. Compliance costs pose a challenge for smaller players.
  • Competitive Substitutes: Alternative flow control technologies, such as pumps and other fluid handling equipment, represent competitive pressure.
  • End-User Demographics: The chemical industry's diverse sub-sectors (petrochemicals, pharmaceuticals, etc.) present varied needs and preferences influencing valve selection.
  • M&A Activity: An estimated xx M&A deals were recorded in the global valve market (parent market) between 2019 and 2024, with xx deals specifically targeting the chemical industry segment (child market).

Global Valves Market in Chemical Industry Growth Trends & Insights

The global valves market in the chemical industry exhibits a steady growth trajectory, driven by expanding chemical production capacity and increasing investments in infrastructure upgrades. The market size is projected to reach xx Million units by 2025 and is expected to grow at a CAGR of xx% during the forecast period (2025-2033). This growth is fueled by technological advancements (e.g., smart valves, improved materials), rising demand from emerging economies, and stricter environmental regulations. Increased adoption rates of automated control systems and remote monitoring technologies contribute significantly to this growth. Consumer behavior shifts towards sustainability and increased efficiency are also influencing purchasing decisions. Market penetration of advanced valve technologies remains relatively low, indicating substantial future growth potential.

Global Valves Market in Chemical Industry Growth

Dominant Regions, Countries, or Segments in Global Valves Market in Chemical Industry

The [Region X, e.g., North America] region dominates the global valves market in the chemical industry in 2025, holding a market share of approximately xx%. This dominance is attributed to a combination of factors:

  • Robust Chemical Production: A large and well-established chemical manufacturing sector drives demand.
  • High Technological Adoption: Early adoption of advanced valve technologies and automation solutions.
  • Favorable Regulatory Environment: Supportive government policies and investments in infrastructure development.
  • Strong Economic Growth: Sustained economic expansion enhances investment in capital equipment.

Within the segment breakdown by valve type, the Ball valves segment holds the largest share in 2025, accounting for xx% of the market. This is due to their versatile applications, ease of operation, and relatively low cost. The Butterfly valves segment is expected to show substantial growth during the forecast period driven by its suitability in large-diameter pipelines.

  • High Growth Potential: [Region Y, e.g., Asia Pacific] and [Region Z, e.g., Europe] are expected to witness significant growth during the forecast period, driven by rapid industrialization and increasing chemical production capacities.

Global Valves Market in Chemical Industry Product Landscape

The global valves market offers a wide array of products, with innovation focused on enhanced durability, reduced maintenance, and improved safety features. Manufacturers are increasingly incorporating smart technologies, such as remote monitoring and predictive maintenance capabilities, into their valve designs. The unique selling propositions frequently include extended lifecycles, improved flow control accuracy, and enhanced resistance to corrosive chemicals. Advancements in materials science are also leading to the development of valves with superior corrosion resistance and improved thermal stability.

Key Drivers, Barriers & Challenges in Global Valves Market in Chemical Industry

Key Drivers:

  • Increasing demand from the chemical industry's expansion in emerging markets.
  • Stringent environmental regulations driving demand for efficient and eco-friendly valves.
  • Technological advancements enhancing valve performance, durability, and safety.

Challenges & Restraints:

  • High initial investment costs for advanced valve technologies can deter some buyers, impacting adoption rates.
  • Supply chain disruptions (xx% impact on production in 2022 due to [Specify disruption cause]) can lead to production delays and price fluctuations.
  • Intense competition from established and emerging players can affect profitability.

Emerging Opportunities in Global Valves Market in Chemical Industry

  • Growing demand for smart valves and automated control systems in chemical plants.
  • Expanding applications in specialized chemical processes requiring high-performance valves.
  • Untapped market potential in developing economies with rapidly growing chemical industries.

Growth Accelerators in the Global Valves Market in Chemical Industry Industry

Technological breakthroughs in materials science and automation are major catalysts for growth. Strategic partnerships between valve manufacturers and chemical companies are streamlining product development and enhancing integration. Market expansion strategies focusing on emerging economies and specialized industrial sectors are further fueling market expansion.

Key Players Shaping the Global Valves Market in Chemical Industry Market

  • Valmet Oyj
  • Rotork Plc
  • Flowserve Corporation
  • Crane Holdings Co
  • Alfa Laval Corporate AB
  • Emerson Electric Co
  • Samson Controls Inc
  • IMI Critical Engineering
  • Schlumberger Limited
  • KITZ Corporation

Notable Milestones in Global Valves Market in Chemical Industry Sector

  • May 2021: Hitachi launched its Class150 Flanged double offset ball valve for fluid handling, including solids.
  • January 2021: DeZURIK, Inc. acquired Red Valve, expanding its product portfolio and market presence.

In-Depth Global Valves Market in Chemical Industry Market Outlook

The global valves market in the chemical industry is poised for significant growth, driven by technological innovation, increasing demand, and expanding applications. Strategic investments in R&D, focus on sustainable solutions, and exploration of untapped market segments will be crucial for success in this dynamic market. Companies focusing on advanced technologies and efficient supply chains will be best positioned to capitalize on the significant opportunities in the forecast period.

Global Valves Market in Chemical Industry Segmentation

  • 1. Production Analysis
  • 2. Consumption Analysis
  • 3. Import Market Analysis (Value & Volume)
  • 4. Export Market Analysis (Value & Volume)
  • 5. Price Trend Analysis

Global Valves Market in Chemical Industry Segmentation By Geography

  • 1. North America
  • 2. Europe
  • 3. Asia Pacific
  • 4. Latin America
  • 5. Middle East and Africa
Global Valves Market in Chemical Industry Regional Share


Global Valves Market in Chemical Industry REPORT HIGHLIGHTS

AspectsDetails
Study Period 2019-2033
Base Year 2024
Estimated Year 2025
Forecast Period2025-2033
Historical Period2019-2024
Growth RateCAGR of 4.20% from 2019-2033
Segmentation
    • By Production Analysis
    • By Consumption Analysis
    • By Import Market Analysis (Value & Volume)
    • By Export Market Analysis (Value & Volume)
    • By Price Trend Analysis
  • By Geography
    • North America
    • Europe
    • Asia Pacific
    • Latin America
    • Middle East and Africa


Table of Contents

  1. 1. Introduction
    • 1.1. Research Scope
    • 1.2. Market Segmentation
    • 1.3. Research Methodology
    • 1.4. Definitions and Assumptions
  2. 2. Executive Summary
    • 2.1. Introduction
  3. 3. Market Dynamics
    • 3.1. Introduction
      • 3.2. Market Drivers
        • 3.2.1. Growing Demand for Process Safety; Growing Adoption of Process Automation
      • 3.3. Market Restrains
        • 3.3.1. Lack of Standardized Policies and High Replacement Costs
      • 3.4. Market Trends
        • 3.4.1. Growing Expansion of Specialty Chemical Manufacturing Companies Owing to Increasing Demand
  4. 4. Market Factor Analysis
    • 4.1. Porters Five Forces
    • 4.2. Supply/Value Chain
    • 4.3. PESTEL analysis
    • 4.4. Market Entropy
    • 4.5. Patent/Trademark Analysis
  5. 5. Global Valves Market in Chemical Industry Analysis, Insights and Forecast, 2019-2031
    • 5.1. Market Analysis, Insights and Forecast - by Production Analysis
      • 5.2. Market Analysis, Insights and Forecast - by Consumption Analysis
        • 5.3. Market Analysis, Insights and Forecast - by Import Market Analysis (Value & Volume)
          • 5.4. Market Analysis, Insights and Forecast - by Export Market Analysis (Value & Volume)
            • 5.5. Market Analysis, Insights and Forecast - by Price Trend Analysis
              • 5.6. Market Analysis, Insights and Forecast - by Region
                • 5.6.1. North America
                • 5.6.2. Europe
                • 5.6.3. Asia Pacific
                • 5.6.4. Latin America
                • 5.6.5. Middle East and Africa
            • 6. North America Global Valves Market in Chemical Industry Analysis, Insights and Forecast, 2019-2031
              • 6.1. Market Analysis, Insights and Forecast - by Production Analysis
                • 6.2. Market Analysis, Insights and Forecast - by Consumption Analysis
                  • 6.3. Market Analysis, Insights and Forecast - by Import Market Analysis (Value & Volume)
                    • 6.4. Market Analysis, Insights and Forecast - by Export Market Analysis (Value & Volume)
                      • 6.5. Market Analysis, Insights and Forecast - by Price Trend Analysis
                      • 7. Europe Global Valves Market in Chemical Industry Analysis, Insights and Forecast, 2019-2031
                        • 7.1. Market Analysis, Insights and Forecast - by Production Analysis
                          • 7.2. Market Analysis, Insights and Forecast - by Consumption Analysis
                            • 7.3. Market Analysis, Insights and Forecast - by Import Market Analysis (Value & Volume)
                              • 7.4. Market Analysis, Insights and Forecast - by Export Market Analysis (Value & Volume)
                                • 7.5. Market Analysis, Insights and Forecast - by Price Trend Analysis
                                • 8. Asia Pacific Global Valves Market in Chemical Industry Analysis, Insights and Forecast, 2019-2031
                                  • 8.1. Market Analysis, Insights and Forecast - by Production Analysis
                                    • 8.2. Market Analysis, Insights and Forecast - by Consumption Analysis
                                      • 8.3. Market Analysis, Insights and Forecast - by Import Market Analysis (Value & Volume)
                                        • 8.4. Market Analysis, Insights and Forecast - by Export Market Analysis (Value & Volume)
                                          • 8.5. Market Analysis, Insights and Forecast - by Price Trend Analysis
                                          • 9. Latin America Global Valves Market in Chemical Industry Analysis, Insights and Forecast, 2019-2031
                                            • 9.1. Market Analysis, Insights and Forecast - by Production Analysis
                                              • 9.2. Market Analysis, Insights and Forecast - by Consumption Analysis
                                                • 9.3. Market Analysis, Insights and Forecast - by Import Market Analysis (Value & Volume)
                                                  • 9.4. Market Analysis, Insights and Forecast - by Export Market Analysis (Value & Volume)
                                                    • 9.5. Market Analysis, Insights and Forecast - by Price Trend Analysis
                                                    • 10. Middle East and Africa Global Valves Market in Chemical Industry Analysis, Insights and Forecast, 2019-2031
                                                      • 10.1. Market Analysis, Insights and Forecast - by Production Analysis
                                                        • 10.2. Market Analysis, Insights and Forecast - by Consumption Analysis
                                                          • 10.3. Market Analysis, Insights and Forecast - by Import Market Analysis (Value & Volume)
                                                            • 10.4. Market Analysis, Insights and Forecast - by Export Market Analysis (Value & Volume)
                                                              • 10.5. Market Analysis, Insights and Forecast - by Price Trend Analysis
                                                              • 11. North America Global Valves Market in Chemical Industry Analysis, Insights and Forecast, 2019-2031
                                                                  • 11.1. Market Analysis, Insights and Forecast - By Country/Sub-region
                                                                    • 11.1.1.
                                                              • 12. Europe Global Valves Market in Chemical Industry Analysis, Insights and Forecast, 2019-2031
                                                                  • 12.1. Market Analysis, Insights and Forecast - By Country/Sub-region
                                                                    • 12.1.1.
                                                              • 13. Asia Pacific Global Valves Market in Chemical Industry Analysis, Insights and Forecast, 2019-2031
                                                                  • 13.1. Market Analysis, Insights and Forecast - By Country/Sub-region
                                                                    • 13.1.1.
                                                              • 14. Latin America Global Valves Market in Chemical Industry Analysis, Insights and Forecast, 2019-2031
                                                                  • 14.1. Market Analysis, Insights and Forecast - By Country/Sub-region
                                                                    • 14.1.1.
                                                              • 15. Middle East and Africa Global Valves Market in Chemical Industry Analysis, Insights and Forecast, 2019-2031
                                                                  • 15.1. Market Analysis, Insights and Forecast - By Country/Sub-region
                                                                    • 15.1.1.
                                                              • 16. Competitive Analysis
                                                                • 16.1. Market Share Analysis 2024
                                                                  • 16.2. Company Profiles
                                                                    • 16.2.1 Valmet Oyj
                                                                      • 16.2.1.1. Overview
                                                                      • 16.2.1.2. Products
                                                                      • 16.2.1.3. SWOT Analysis
                                                                      • 16.2.1.4. Recent Developments
                                                                      • 16.2.1.5. Financials (Based on Availability)
                                                                    • 16.2.2 Rotork Plc
                                                                      • 16.2.2.1. Overview
                                                                      • 16.2.2.2. Products
                                                                      • 16.2.2.3. SWOT Analysis
                                                                      • 16.2.2.4. Recent Developments
                                                                      • 16.2.2.5. Financials (Based on Availability)
                                                                    • 16.2.3 Flowserve Corporation
                                                                      • 16.2.3.1. Overview
                                                                      • 16.2.3.2. Products
                                                                      • 16.2.3.3. SWOT Analysis
                                                                      • 16.2.3.4. Recent Developments
                                                                      • 16.2.3.5. Financials (Based on Availability)
                                                                    • 16.2.4 Crane Holdings Co
                                                                      • 16.2.4.1. Overview
                                                                      • 16.2.4.2. Products
                                                                      • 16.2.4.3. SWOT Analysis
                                                                      • 16.2.4.4. Recent Developments
                                                                      • 16.2.4.5. Financials (Based on Availability)
                                                                    • 16.2.5 Alfa Laval Corporate AB
                                                                      • 16.2.5.1. Overview
                                                                      • 16.2.5.2. Products
                                                                      • 16.2.5.3. SWOT Analysis
                                                                      • 16.2.5.4. Recent Developments
                                                                      • 16.2.5.5. Financials (Based on Availability)
                                                                    • 16.2.6 Emerson Electric Co
                                                                      • 16.2.6.1. Overview
                                                                      • 16.2.6.2. Products
                                                                      • 16.2.6.3. SWOT Analysis
                                                                      • 16.2.6.4. Recent Developments
                                                                      • 16.2.6.5. Financials (Based on Availability)
                                                                    • 16.2.7 Samson Controls Inc
                                                                      • 16.2.7.1. Overview
                                                                      • 16.2.7.2. Products
                                                                      • 16.2.7.3. SWOT Analysis
                                                                      • 16.2.7.4. Recent Developments
                                                                      • 16.2.7.5. Financials (Based on Availability)
                                                                    • 16.2.8 IMI Critical Engineering
                                                                      • 16.2.8.1. Overview
                                                                      • 16.2.8.2. Products
                                                                      • 16.2.8.3. SWOT Analysis
                                                                      • 16.2.8.4. Recent Developments
                                                                      • 16.2.8.5. Financials (Based on Availability)
                                                                    • 16.2.9 Schlumberger Limited
                                                                      • 16.2.9.1. Overview
                                                                      • 16.2.9.2. Products
                                                                      • 16.2.9.3. SWOT Analysis
                                                                      • 16.2.9.4. Recent Developments
                                                                      • 16.2.9.5. Financials (Based on Availability)
                                                                    • 16.2.10 KITZ Corporation
                                                                      • 16.2.10.1. Overview
                                                                      • 16.2.10.2. Products
                                                                      • 16.2.10.3. SWOT Analysis
                                                                      • 16.2.10.4. Recent Developments
                                                                      • 16.2.10.5. Financials (Based on Availability)

                                                              List of Figures

                                                              1. Figure 1: Global Global Valves Market in Chemical Industry Revenue Breakdown (Million, %) by Region 2024 & 2032
                                                              2. Figure 2: North America Global Valves Market in Chemical Industry Revenue (Million), by Country 2024 & 2032
                                                              3. Figure 3: North America Global Valves Market in Chemical Industry Revenue Share (%), by Country 2024 & 2032
                                                              4. Figure 4: Europe Global Valves Market in Chemical Industry Revenue (Million), by Country 2024 & 2032
                                                              5. Figure 5: Europe Global Valves Market in Chemical Industry Revenue Share (%), by Country 2024 & 2032
                                                              6. Figure 6: Asia Pacific Global Valves Market in Chemical Industry Revenue (Million), by Country 2024 & 2032
                                                              7. Figure 7: Asia Pacific Global Valves Market in Chemical Industry Revenue Share (%), by Country 2024 & 2032
                                                              8. Figure 8: Latin America Global Valves Market in Chemical Industry Revenue (Million), by Country 2024 & 2032
                                                              9. Figure 9: Latin America Global Valves Market in Chemical Industry Revenue Share (%), by Country 2024 & 2032
                                                              10. Figure 10: Middle East and Africa Global Valves Market in Chemical Industry Revenue (Million), by Country 2024 & 2032
                                                              11. Figure 11: Middle East and Africa Global Valves Market in Chemical Industry Revenue Share (%), by Country 2024 & 2032
                                                              12. Figure 12: North America Global Valves Market in Chemical Industry Revenue (Million), by Production Analysis 2024 & 2032
                                                              13. Figure 13: North America Global Valves Market in Chemical Industry Revenue Share (%), by Production Analysis 2024 & 2032
                                                              14. Figure 14: North America Global Valves Market in Chemical Industry Revenue (Million), by Consumption Analysis 2024 & 2032
                                                              15. Figure 15: North America Global Valves Market in Chemical Industry Revenue Share (%), by Consumption Analysis 2024 & 2032
                                                              16. Figure 16: North America Global Valves Market in Chemical Industry Revenue (Million), by Import Market Analysis (Value & Volume) 2024 & 2032
                                                              17. Figure 17: North America Global Valves Market in Chemical Industry Revenue Share (%), by Import Market Analysis (Value & Volume) 2024 & 2032
                                                              18. Figure 18: North America Global Valves Market in Chemical Industry Revenue (Million), by Export Market Analysis (Value & Volume) 2024 & 2032
                                                              19. Figure 19: North America Global Valves Market in Chemical Industry Revenue Share (%), by Export Market Analysis (Value & Volume) 2024 & 2032
                                                              20. Figure 20: North America Global Valves Market in Chemical Industry Revenue (Million), by Price Trend Analysis 2024 & 2032
                                                              21. Figure 21: North America Global Valves Market in Chemical Industry Revenue Share (%), by Price Trend Analysis 2024 & 2032
                                                              22. Figure 22: North America Global Valves Market in Chemical Industry Revenue (Million), by Country 2024 & 2032
                                                              23. Figure 23: North America Global Valves Market in Chemical Industry Revenue Share (%), by Country 2024 & 2032
                                                              24. Figure 24: Europe Global Valves Market in Chemical Industry Revenue (Million), by Production Analysis 2024 & 2032
                                                              25. Figure 25: Europe Global Valves Market in Chemical Industry Revenue Share (%), by Production Analysis 2024 & 2032
                                                              26. Figure 26: Europe Global Valves Market in Chemical Industry Revenue (Million), by Consumption Analysis 2024 & 2032
                                                              27. Figure 27: Europe Global Valves Market in Chemical Industry Revenue Share (%), by Consumption Analysis 2024 & 2032
                                                              28. Figure 28: Europe Global Valves Market in Chemical Industry Revenue (Million), by Import Market Analysis (Value & Volume) 2024 & 2032
                                                              29. Figure 29: Europe Global Valves Market in Chemical Industry Revenue Share (%), by Import Market Analysis (Value & Volume) 2024 & 2032
                                                              30. Figure 30: Europe Global Valves Market in Chemical Industry Revenue (Million), by Export Market Analysis (Value & Volume) 2024 & 2032
                                                              31. Figure 31: Europe Global Valves Market in Chemical Industry Revenue Share (%), by Export Market Analysis (Value & Volume) 2024 & 2032
                                                              32. Figure 32: Europe Global Valves Market in Chemical Industry Revenue (Million), by Price Trend Analysis 2024 & 2032
                                                              33. Figure 33: Europe Global Valves Market in Chemical Industry Revenue Share (%), by Price Trend Analysis 2024 & 2032
                                                              34. Figure 34: Europe Global Valves Market in Chemical Industry Revenue (Million), by Country 2024 & 2032
                                                              35. Figure 35: Europe Global Valves Market in Chemical Industry Revenue Share (%), by Country 2024 & 2032
                                                              36. Figure 36: Asia Pacific Global Valves Market in Chemical Industry Revenue (Million), by Production Analysis 2024 & 2032
                                                              37. Figure 37: Asia Pacific Global Valves Market in Chemical Industry Revenue Share (%), by Production Analysis 2024 & 2032
                                                              38. Figure 38: Asia Pacific Global Valves Market in Chemical Industry Revenue (Million), by Consumption Analysis 2024 & 2032
                                                              39. Figure 39: Asia Pacific Global Valves Market in Chemical Industry Revenue Share (%), by Consumption Analysis 2024 & 2032
                                                              40. Figure 40: Asia Pacific Global Valves Market in Chemical Industry Revenue (Million), by Import Market Analysis (Value & Volume) 2024 & 2032
                                                              41. Figure 41: Asia Pacific Global Valves Market in Chemical Industry Revenue Share (%), by Import Market Analysis (Value & Volume) 2024 & 2032
                                                              42. Figure 42: Asia Pacific Global Valves Market in Chemical Industry Revenue (Million), by Export Market Analysis (Value & Volume) 2024 & 2032
                                                              43. Figure 43: Asia Pacific Global Valves Market in Chemical Industry Revenue Share (%), by Export Market Analysis (Value & Volume) 2024 & 2032
                                                              44. Figure 44: Asia Pacific Global Valves Market in Chemical Industry Revenue (Million), by Price Trend Analysis 2024 & 2032
                                                              45. Figure 45: Asia Pacific Global Valves Market in Chemical Industry Revenue Share (%), by Price Trend Analysis 2024 & 2032
                                                              46. Figure 46: Asia Pacific Global Valves Market in Chemical Industry Revenue (Million), by Country 2024 & 2032
                                                              47. Figure 47: Asia Pacific Global Valves Market in Chemical Industry Revenue Share (%), by Country 2024 & 2032
                                                              48. Figure 48: Latin America Global Valves Market in Chemical Industry Revenue (Million), by Production Analysis 2024 & 2032
                                                              49. Figure 49: Latin America Global Valves Market in Chemical Industry Revenue Share (%), by Production Analysis 2024 & 2032
                                                              50. Figure 50: Latin America Global Valves Market in Chemical Industry Revenue (Million), by Consumption Analysis 2024 & 2032
                                                              51. Figure 51: Latin America Global Valves Market in Chemical Industry Revenue Share (%), by Consumption Analysis 2024 & 2032
                                                              52. Figure 52: Latin America Global Valves Market in Chemical Industry Revenue (Million), by Import Market Analysis (Value & Volume) 2024 & 2032
                                                              53. Figure 53: Latin America Global Valves Market in Chemical Industry Revenue Share (%), by Import Market Analysis (Value & Volume) 2024 & 2032
                                                              54. Figure 54: Latin America Global Valves Market in Chemical Industry Revenue (Million), by Export Market Analysis (Value & Volume) 2024 & 2032
                                                              55. Figure 55: Latin America Global Valves Market in Chemical Industry Revenue Share (%), by Export Market Analysis (Value & Volume) 2024 & 2032
                                                              56. Figure 56: Latin America Global Valves Market in Chemical Industry Revenue (Million), by Price Trend Analysis 2024 & 2032
                                                              57. Figure 57: Latin America Global Valves Market in Chemical Industry Revenue Share (%), by Price Trend Analysis 2024 & 2032
                                                              58. Figure 58: Latin America Global Valves Market in Chemical Industry Revenue (Million), by Country 2024 & 2032
                                                              59. Figure 59: Latin America Global Valves Market in Chemical Industry Revenue Share (%), by Country 2024 & 2032
                                                              60. Figure 60: Middle East and Africa Global Valves Market in Chemical Industry Revenue (Million), by Production Analysis 2024 & 2032
                                                              61. Figure 61: Middle East and Africa Global Valves Market in Chemical Industry Revenue Share (%), by Production Analysis 2024 & 2032
                                                              62. Figure 62: Middle East and Africa Global Valves Market in Chemical Industry Revenue (Million), by Consumption Analysis 2024 & 2032
                                                              63. Figure 63: Middle East and Africa Global Valves Market in Chemical Industry Revenue Share (%), by Consumption Analysis 2024 & 2032
                                                              64. Figure 64: Middle East and Africa Global Valves Market in Chemical Industry Revenue (Million), by Import Market Analysis (Value & Volume) 2024 & 2032
                                                              65. Figure 65: Middle East and Africa Global Valves Market in Chemical Industry Revenue Share (%), by Import Market Analysis (Value & Volume) 2024 & 2032
                                                              66. Figure 66: Middle East and Africa Global Valves Market in Chemical Industry Revenue (Million), by Export Market Analysis (Value & Volume) 2024 & 2032
                                                              67. Figure 67: Middle East and Africa Global Valves Market in Chemical Industry Revenue Share (%), by Export Market Analysis (Value & Volume) 2024 & 2032
                                                              68. Figure 68: Middle East and Africa Global Valves Market in Chemical Industry Revenue (Million), by Price Trend Analysis 2024 & 2032
                                                              69. Figure 69: Middle East and Africa Global Valves Market in Chemical Industry Revenue Share (%), by Price Trend Analysis 2024 & 2032
                                                              70. Figure 70: Middle East and Africa Global Valves Market in Chemical Industry Revenue (Million), by Country 2024 & 2032
                                                              71. Figure 71: Middle East and Africa Global Valves Market in Chemical Industry Revenue Share (%), by Country 2024 & 2032

                                                              List of Tables

                                                              1. Table 1: Global Valves Market in Chemical Industry Revenue Million Forecast, by Region 2019 & 2032
                                                              2. Table 2: Global Valves Market in Chemical Industry Revenue Million Forecast, by Production Analysis 2019 & 2032
                                                              3. Table 3: Global Valves Market in Chemical Industry Revenue Million Forecast, by Consumption Analysis 2019 & 2032
                                                              4. Table 4: Global Valves Market in Chemical Industry Revenue Million Forecast, by Import Market Analysis (Value & Volume) 2019 & 2032
                                                              5. Table 5: Global Valves Market in Chemical Industry Revenue Million Forecast, by Export Market Analysis (Value & Volume) 2019 & 2032
                                                              6. Table 6: Global Valves Market in Chemical Industry Revenue Million Forecast, by Price Trend Analysis 2019 & 2032
                                                              7. Table 7: Global Valves Market in Chemical Industry Revenue Million Forecast, by Region 2019 & 2032
                                                              8. Table 8: Global Valves Market in Chemical Industry Revenue Million Forecast, by Country 2019 & 2032
                                                              9. Table 9: Global Valves Market in Chemical Industry Revenue (Million) Forecast, by Application 2019 & 2032
                                                              10. Table 10: Global Valves Market in Chemical Industry Revenue Million Forecast, by Country 2019 & 2032
                                                              11. Table 11: Global Valves Market in Chemical Industry Revenue (Million) Forecast, by Application 2019 & 2032
                                                              12. Table 12: Global Valves Market in Chemical Industry Revenue Million Forecast, by Country 2019 & 2032
                                                              13. Table 13: Global Valves Market in Chemical Industry Revenue (Million) Forecast, by Application 2019 & 2032
                                                              14. Table 14: Global Valves Market in Chemical Industry Revenue Million Forecast, by Country 2019 & 2032
                                                              15. Table 15: Global Valves Market in Chemical Industry Revenue (Million) Forecast, by Application 2019 & 2032
                                                              16. Table 16: Global Valves Market in Chemical Industry Revenue Million Forecast, by Country 2019 & 2032
                                                              17. Table 17: Global Valves Market in Chemical Industry Revenue (Million) Forecast, by Application 2019 & 2032
                                                              18. Table 18: Global Valves Market in Chemical Industry Revenue Million Forecast, by Production Analysis 2019 & 2032
                                                              19. Table 19: Global Valves Market in Chemical Industry Revenue Million Forecast, by Consumption Analysis 2019 & 2032
                                                              20. Table 20: Global Valves Market in Chemical Industry Revenue Million Forecast, by Import Market Analysis (Value & Volume) 2019 & 2032
                                                              21. Table 21: Global Valves Market in Chemical Industry Revenue Million Forecast, by Export Market Analysis (Value & Volume) 2019 & 2032
                                                              22. Table 22: Global Valves Market in Chemical Industry Revenue Million Forecast, by Price Trend Analysis 2019 & 2032
                                                              23. Table 23: Global Valves Market in Chemical Industry Revenue Million Forecast, by Country 2019 & 2032
                                                              24. Table 24: Global Valves Market in Chemical Industry Revenue Million Forecast, by Production Analysis 2019 & 2032
                                                              25. Table 25: Global Valves Market in Chemical Industry Revenue Million Forecast, by Consumption Analysis 2019 & 2032
                                                              26. Table 26: Global Valves Market in Chemical Industry Revenue Million Forecast, by Import Market Analysis (Value & Volume) 2019 & 2032
                                                              27. Table 27: Global Valves Market in Chemical Industry Revenue Million Forecast, by Export Market Analysis (Value & Volume) 2019 & 2032
                                                              28. Table 28: Global Valves Market in Chemical Industry Revenue Million Forecast, by Price Trend Analysis 2019 & 2032
                                                              29. Table 29: Global Valves Market in Chemical Industry Revenue Million Forecast, by Country 2019 & 2032
                                                              30. Table 30: Global Valves Market in Chemical Industry Revenue Million Forecast, by Production Analysis 2019 & 2032
                                                              31. Table 31: Global Valves Market in Chemical Industry Revenue Million Forecast, by Consumption Analysis 2019 & 2032
                                                              32. Table 32: Global Valves Market in Chemical Industry Revenue Million Forecast, by Import Market Analysis (Value & Volume) 2019 & 2032
                                                              33. Table 33: Global Valves Market in Chemical Industry Revenue Million Forecast, by Export Market Analysis (Value & Volume) 2019 & 2032
                                                              34. Table 34: Global Valves Market in Chemical Industry Revenue Million Forecast, by Price Trend Analysis 2019 & 2032
                                                              35. Table 35: Global Valves Market in Chemical Industry Revenue Million Forecast, by Country 2019 & 2032
                                                              36. Table 36: Global Valves Market in Chemical Industry Revenue Million Forecast, by Production Analysis 2019 & 2032
                                                              37. Table 37: Global Valves Market in Chemical Industry Revenue Million Forecast, by Consumption Analysis 2019 & 2032
                                                              38. Table 38: Global Valves Market in Chemical Industry Revenue Million Forecast, by Import Market Analysis (Value & Volume) 2019 & 2032
                                                              39. Table 39: Global Valves Market in Chemical Industry Revenue Million Forecast, by Export Market Analysis (Value & Volume) 2019 & 2032
                                                              40. Table 40: Global Valves Market in Chemical Industry Revenue Million Forecast, by Price Trend Analysis 2019 & 2032
                                                              41. Table 41: Global Valves Market in Chemical Industry Revenue Million Forecast, by Country 2019 & 2032
                                                              42. Table 42: Global Valves Market in Chemical Industry Revenue Million Forecast, by Production Analysis 2019 & 2032
                                                              43. Table 43: Global Valves Market in Chemical Industry Revenue Million Forecast, by Consumption Analysis 2019 & 2032
                                                              44. Table 44: Global Valves Market in Chemical Industry Revenue Million Forecast, by Import Market Analysis (Value & Volume) 2019 & 2032
                                                              45. Table 45: Global Valves Market in Chemical Industry Revenue Million Forecast, by Export Market Analysis (Value & Volume) 2019 & 2032
                                                              46. Table 46: Global Valves Market in Chemical Industry Revenue Million Forecast, by Price Trend Analysis 2019 & 2032
                                                              47. Table 47: Global Valves Market in Chemical Industry Revenue Million Forecast, by Country 2019 & 2032


                                                              Frequently Asked Questions

                                                              1. What is the projected Compound Annual Growth Rate (CAGR) of the Global Valves Market in Chemical Industry?

                                                              The projected CAGR is approximately 4.20%.

                                                              2. Which companies are prominent players in the Global Valves Market in Chemical Industry?

                                                              Key companies in the market include Valmet Oyj, Rotork Plc, Flowserve Corporation, Crane Holdings Co, Alfa Laval Corporate AB, Emerson Electric Co, Samson Controls Inc, IMI Critical Engineering, Schlumberger Limited, KITZ Corporation.

                                                              3. What are the main segments of the Global Valves Market in Chemical Industry?

                                                              The market segments include Production Analysis, Consumption Analysis, Import Market Analysis (Value & Volume), Export Market Analysis (Value & Volume), Price Trend Analysis.

                                                              4. Can you provide details about the market size?

                                                              The market size is estimated to be USD XX Million as of 2022.

                                                              5. What are some drivers contributing to market growth?

                                                              Growing Demand for Process Safety; Growing Adoption of Process Automation.

                                                              6. What are the notable trends driving market growth?

                                                              Growing Expansion of Specialty Chemical Manufacturing Companies Owing to Increasing Demand.

                                                              7. Are there any restraints impacting market growth?

                                                              Lack of Standardized Policies and High Replacement Costs.

                                                              8. Can you provide examples of recent developments in the market?

                                                              May 2021- Hitachi launched its Class150 Flanged double offset ball valve for fluid handling including solids, such as wastewater, slurry, powders, ashes, etc. The company has supplied the JIS10K and 20K type valves with successful installation in many wastewaters treatment and chemical plants. The Class 150 valve's double offset structure provides a no pocket design, resulting in no stagnated flow and light torque movements to achieve stable valve operation.

                                                              9. What pricing options are available for accessing the report?

                                                              Pricing options include single-user, multi-user, and enterprise licenses priced at USD 4750, USD 5250, and USD 8750 respectively.

                                                              10. Is the market size provided in terms of value or volume?

                                                              The market size is provided in terms of value, measured in Million.

                                                              11. Are there any specific market keywords associated with the report?

                                                              Yes, the market keyword associated with the report is "Global Valves Market in Chemical Industry," which aids in identifying and referencing the specific market segment covered.

                                                              12. How do I determine which pricing option suits my needs best?

                                                              The pricing options vary based on user requirements and access needs. Individual users may opt for single-user licenses, while businesses requiring broader access may choose multi-user or enterprise licenses for cost-effective access to the report.

                                                              13. Are there any additional resources or data provided in the Global Valves Market in Chemical Industry report?

                                                              While the report offers comprehensive insights, it's advisable to review the specific contents or supplementary materials provided to ascertain if additional resources or data are available.

                                                              14. How can I stay updated on further developments or reports in the Global Valves Market in Chemical Industry?

                                                              To stay informed about further developments, trends, and reports in the Global Valves Market in Chemical Industry, consider subscribing to industry newsletters, following relevant companies and organizations, or regularly checking reputable industry news sources and publications.


                                                              Methodology

                                                              Step 1 - Identification of Relevant Samples Size from Population Database

                                                              Step Chart
                                                              Bar Chart
                                                              Method Chart

                                                              Step 2 - Approaches for Defining Global Market Size (Value, Volume* & Price*)

                                                              Approach Chart
                                                              Top-down and bottom-up approaches are used to validate the global market size and estimate the market size for manufactures, regional segments, product, and application.

                                                              Note*: In applicable scenarios

                                                              Step 3 - Data Sources

                                                              Primary Research

                                                              • Web Analytics
                                                              • Survey Reports
                                                              • Research Institute
                                                              • Latest Research Reports
                                                              • Opinion Leaders

                                                              Secondary Research

                                                              • Annual Reports
                                                              • White Paper
                                                              • Latest Press Release
                                                              • Industry Association
                                                              • Paid Database
                                                              • Investor Presentations
                                                              Analyst Chart

                                                              Step 4 - Data Triangulation

                                                              Involves using different sources of information in order to increase the validity of a study

                                                              These sources are likely to be stakeholders in a program - participants, other researchers, program staff, other community members, and so on.

                                                              Then we put all data in single framework & apply various statistical tools to find out the dynamic on the market.

                                                              During the analysis stage, feedback from the stakeholder groups would be compared to determine areas of agreement as well as areas of divergence

                                                              Additionally, after gathering mixed and scattered data from a wide range of sources, data is triangulated and correlated to come up with estimated figures which are further validated through primary mediums or industry experts, opinion leaders.

                                                              About Visionary Data Reports

                                                              Visionary Data Reports provides future-focused market research, advanced analytics, and strategic insights for technology, healthcare, green energy, and finance. Our reports help you anticipate trends, innovate, and lead in your industry. Our expert team combines primary research, data science, and industry knowledge to deliver actionable intelligence. We offer syndicated reports, custom analytics, and consulting services tailored to your business needs. At Visionary Data Reports, we are committed to quality, transparency, and client satisfaction. Every report is rigorously validated to ensure accuracy and relevance. Our global perspective and forward-thinking approach help you understand both current and emerging market dynamics.

                                                              Stay ahead with Visionary Data Reports. Subscribe to our newsletter for the latest insights and research highlights, and follow us on social media for real-time updates. Visionary Data Reports – Your Guide to Tomorrow’s Opportunities.

                                                              • Home
                                                              • About Us
                                                              • Industries
                                                                • Aerospace & Defense
                                                                • Agriculture
                                                                • Animal Nutrition & Wellness
                                                                • Automotive
                                                                • Chemicals & Materials
                                                                • Consumer Goods and Services
                                                                • Energy & Power
                                                                • Financial Services and Investment Intelligence
                                                                • Food & Beverage
                                                                • Home and Property Improvement
                                                                • Hospitality and Tourism
                                                                • Logistics
                                                                • Manufacturing Products and Services
                                                                • Packaging
                                                                • Professional and Commercial Services
                                                                • Real Estate and Construction
                                                                • Retail
                                                                • Technology, Media and Telecom
                                                                • Healthcare
                                                              • Services
                                                              • Contact
                                                              Main Logo
                                                              • Home
                                                              • About Us
                                                              • Industries
                                                                • Aerospace & Defense
                                                                • Agriculture
                                                                • Animal Nutrition & Wellness
                                                                • Automotive
                                                                • Chemicals & Materials
                                                                • Consumer Goods and Services
                                                                • Energy & Power
                                                                • Financial Services and Investment Intelligence
                                                                • Food & Beverage
                                                                • Home and Property Improvement
                                                                • Hospitality and Tourism
                                                                • Logistics
                                                                • Manufacturing Products and Services
                                                                • Packaging
                                                                • Professional and Commercial Services
                                                                • Real Estate and Construction
                                                                • Retail
                                                                • Technology, Media and Telecom
                                                                • Healthcare
                                                              • Services
                                                              • Contact
                                                              +17162654855
                                                              [email protected]

                                                              +17162654855

                                                              [email protected]

                                                              Business Address

                                                              Head Office

                                                              Office no. A 5010, fifth floor, Solitaire Business Hub, Near Phoenix mall, Pune, Maharashtra 411014

                                                              Contact Information

                                                              Craig Francis

                                                              Business Development Head

                                                              +17162654855

                                                              [email protected]

                                                              Connect With Us

                                                              Secure Payment Partners

                                                              payment image
                                                              RetailLogisticsPackagingAutomotiveHealthcareAgricultureEnergy & PowerFood & BeverageAerospace & DefenseChemicals & MaterialsHospitality and TourismAnimal Nutrition & WellnessConsumer Goods and ServicesReal Estate and ConstructionHome and Property ImprovementTechnology, Media and TelecomManufacturing Products and ServicesFinancial Services and Investment Intelligence

                                                              © 2025 All rights reserved


                                                              Privacy Policy
                                                              Terms and Conditions
                                                              FAQ
                                                              artwork spiralartwork spiralRelated Reports
                                                              artwork underline

                                                              UK Satellite Imagery Services Market Market Analysis and Growth Roadmap

                                                              The UK Satellite Imagery Services Market is booming, with a projected CAGR of 14.06% to 2033. Driven by government initiatives, private sector adoption, and advanced analytics, this report analyzes market trends, key players (L3Harris, Airbus, Maxar), and regional growth across England, Scotland, Wales, and Northern Ireland. Discover the opportunities and challenges in this rapidly expanding sector.

                                                              June 2025
                                                              Base Year: 2024
                                                              No Of Pages: 197
                                                              Price: $3800

                                                              Managed Application Services Industry Market Analysis and Growth Roadmap

                                                              The Managed Application Services market is experiencing steady growth, driven by digital transformation and cloud migration. Explore market size, trends, leading companies, and regional insights for 2025-2033. Discover opportunities in BFSI, retail, and IT sectors.

                                                              June 2025
                                                              Base Year: 2024
                                                              No Of Pages: 234
                                                              Price: $4750

                                                              Testing, Inspection, and Certification Market for the Transportation Industry Market Analysis and Growth Roadmap

                                                              The Transportation TIC Market is booming! Discover key trends, growth drivers (stringent regulations, tech advancements), and leading players (UL, Intertek, SGS) shaping this $XX million market. Explore regional insights and forecast projections through 2033. Learn more now!

                                                              June 2025
                                                              Base Year: 2024
                                                              No Of Pages: 234
                                                              Price: $4750

                                                              APAC Proximity Sensors Market Market Analysis and Growth Roadmap

                                                              The APAC proximity sensor market is booming, projected to reach $2.54 billion by 2033 with a 6.70% CAGR. Driven by automation and Industry 4.0, key players like Keyence and Omron are capitalizing on growth in automotive, industrial, and consumer electronics. Explore market trends, regional analysis, and technological advancements in our comprehensive report.

                                                              June 2025
                                                              Base Year: 2024
                                                              No Of Pages: 210
                                                              Price: $4750

                                                              Photoelectric Sensor Industry Market Analysis and Growth Roadmap

                                                              The photoelectric sensor market is booming, projected to reach $XX million by 2033 with a 7.20% CAGR. Driven by automation and technological advancements, this report analyzes market trends, key players (Keyence, Omron, Sick AG), and regional growth (Asia Pacific leading). Discover insights into laser, fiber optic, and other sensor types.

                                                              June 2025
                                                              Base Year: 2024
                                                              No Of Pages: 234
                                                              Price: $4750

                                                              Production Monitoring Industry Market Analysis and Growth Roadmap

                                                              The Production Monitoring market is booming, projected to reach [estimated 2033 market size in millions] by 2033 with an 8.20% CAGR. Discover key drivers, trends, and restraints shaping this dynamic industry, including IoT, Industry 4.0, and AI integration. Learn about leading companies and regional market shares.

                                                              June 2025
                                                              Base Year: 2024
                                                              No Of Pages: 234
                                                              Price: $4750

                                                              Bank Kiosk Market Market Analysis and Growth Roadmap

                                                              The Bank Kiosk Market is booming, projected to reach $3.15 billion by 2033 with a CAGR of 14.27%. Discover key drivers, trends, restraints, and leading companies shaping this rapidly growing sector of self-service banking. Explore market segmentation by type, offering, and region.

                                                              June 2025
                                                              Base Year: 2024
                                                              No Of Pages: 234
                                                              Price: $4750

                                                              Japan Facility Management Market Market Analysis and Growth Roadmap

                                                              Discover the booming Japan Facility Management market! Our in-depth analysis reveals a CAGR of 8.40% through 2033, driven by outsourcing, technological advancements, and infrastructure development. Learn about key players, market segments (Hard FM, Soft FM, etc.), and regional trends.

                                                              June 2025
                                                              Base Year: 2024
                                                              No Of Pages: 197
                                                              Price: $3800

                                                              Servo Motors And Drives Market Market Analysis and Growth Roadmap

                                                              The global Servo Motors and Drives market is booming, projected to reach [estimated 2033 market size based on CAGR] by 2033. Driven by automation in automotive, semiconductor, and other industries, this market offers lucrative opportunities. Learn about key trends, leading players, and regional growth projections in our in-depth analysis.

                                                              June 2025
                                                              Base Year: 2024
                                                              No Of Pages: 234
                                                              Price: $4750

                                                              Portable Power Bank Industry Market Analysis and Growth Roadmap

                                                              The portable power bank market is booming, projected to reach \$26.49 billion by 2033, with an 8.40% CAGR. Discover key trends, market segments (capacity, charging, application), leading companies, and regional insights in this comprehensive analysis. Explore the future of portable power solutions.

                                                              June 2025
                                                              Base Year: 2024
                                                              No Of Pages: 234
                                                              Price: $4750

                                                              Middle East And Africa Trace Detection Market Market Analysis and Growth Roadmap

                                                              The Middle East & Africa Trace Detection Market is booming, projected to reach [estimated 2033 value based on CAGR] by 2033 with a CAGR of 6.62%. Driven by rising security concerns and technological advancements, this report analyzes market trends, key players (Smiths Detection, Teledyne Flir, etc.), and regional insights for explosive & narcotics detection.

                                                              June 2025
                                                              Base Year: 2024
                                                              No Of Pages: 210
                                                              Price: $4750

                                                              New Zealand Data Center Power Market Market Analysis and Growth Roadmap

                                                              The New Zealand data center power market is booming, projected to reach $322.42 million by 2033 with a 14.43% CAGR. Driven by cloud computing and digital transformation, this report analyzes market trends, key players (ABB, Schneider Electric, Vertiv), and segment opportunities in power infrastructure and solutions.

                                                              June 2025
                                                              Base Year: 2024
                                                              No Of Pages: 197
                                                              Price: $3800

                                                              Asia Pacific Industrial Computed Tomography Market Market Analysis and Growth Roadmap

                                                              The Asia Pacific Industrial Computed Tomography market is booming, with a projected CAGR of 8.60% through 2033. Driven by advancements in NDT and growing demand across automotive, electronics, and aerospace, this report analyzes market size, trends, and key players like Nikon, Hitachi, and Zeiss. Discover insights into regional market share and future growth projections.

                                                              June 2025
                                                              Base Year: 2024
                                                              No Of Pages: 234
                                                              Price: $4750

                                                              Asia Pacific Container Monitoring Market Market Analysis and Growth Roadmap

                                                              The Asia Pacific container monitoring market is booming, projected to reach $2.26 billion by 2025 and grow at a CAGR of 16.38% through 2033. Driven by IoT, increased trade, and stringent regulations, this report analyzes market trends, key players (ORBCOMM, Geoforce, etc.), and regional growth. Learn more about this lucrative market opportunity.

                                                              June 2025
                                                              Base Year: 2024
                                                              No Of Pages: 234
                                                              Price: $4750

                                                              Poland Data Center Market Market Analysis and Growth Roadmap

                                                              Discover the booming Poland Data Center Market! This comprehensive analysis reveals a CAGR of 4.87%, driven by e-commerce, cloud computing, and Warsaw's emergence as a key hotspot. Explore market trends, key players (Equinix, Comarch, etc.), and growth projections until 2033. Invest wisely with our data-driven insights.

                                                              June 2025
                                                              Base Year: 2024
                                                              No Of Pages: 197
                                                              Price: $3800

                                                              Asia-Pacific Pin-based Access Control Market Market Analysis and Growth Roadmap

                                                              The Asia-Pacific pin-based access control market is booming, projected to reach $1.1 billion by 2033, driven by rising security concerns and smart city initiatives. Discover key trends, leading companies (Johnson Controls, Honeywell, Hikvision), and growth forecasts in this in-depth market analysis.

                                                              June 2025
                                                              Base Year: 2024
                                                              No Of Pages: 210
                                                              Price: $4750

                                                              Asia-Pacific Data Center Power Market Market Analysis and Growth Roadmap

                                                              The Asia-Pacific data center power market is booming, projected to reach $20B+ by 2033 with a 9.7% CAGR. Driven by cloud computing and digital transformation, this report analyzes market trends, key players (ABB, Schneider Electric, etc.), and regional growth, offering valuable insights for investors and businesses.

                                                              June 2025
                                                              Base Year: 2024
                                                              No Of Pages: 210
                                                              Price: $4750

                                                              Asset Tracking Market Market Analysis and Growth Roadmap

                                                              The global asset tracking market is booming, projected to reach \$23.2B in 2025 with a 13.3% CAGR. Discover key trends, drivers, and top companies shaping this dynamic industry. Explore market segmentation by component, deployment, and end-user, including transportation, manufacturing, and healthcare. Learn more about this lucrative market opportunity.

                                                              June 2025
                                                              Base Year: 2024
                                                              No Of Pages: 234
                                                              Price: $4750

                                                              Legal AI Software Market Market Analysis and Growth Roadmap

                                                              The Legal AI Software market is booming, projected to reach $2.19B in 2025 and grow at a CAGR of 10.70% through 2033. Learn about key drivers, trends, restraints, and top companies shaping this rapidly evolving sector, including contract review software, e-discovery, and legal research AI solutions.

                                                              June 2025
                                                              Base Year: 2024
                                                              No Of Pages: 234
                                                              Price: $4750

                                                              United Kingdom IT Services Market Market Analysis and Growth Roadmap

                                                              Discover the booming UK IT services market! This comprehensive analysis reveals market size, CAGR, key drivers, trends, and restraints, profiling top players like TCS and Accenture. Explore segment growth in outsourcing, consulting, and business processes across key sectors. Forecast to 2033.

                                                              June 2025
                                                              Base Year: 2024
                                                              No Of Pages: 197
                                                              Price: $3800