
Key Insights
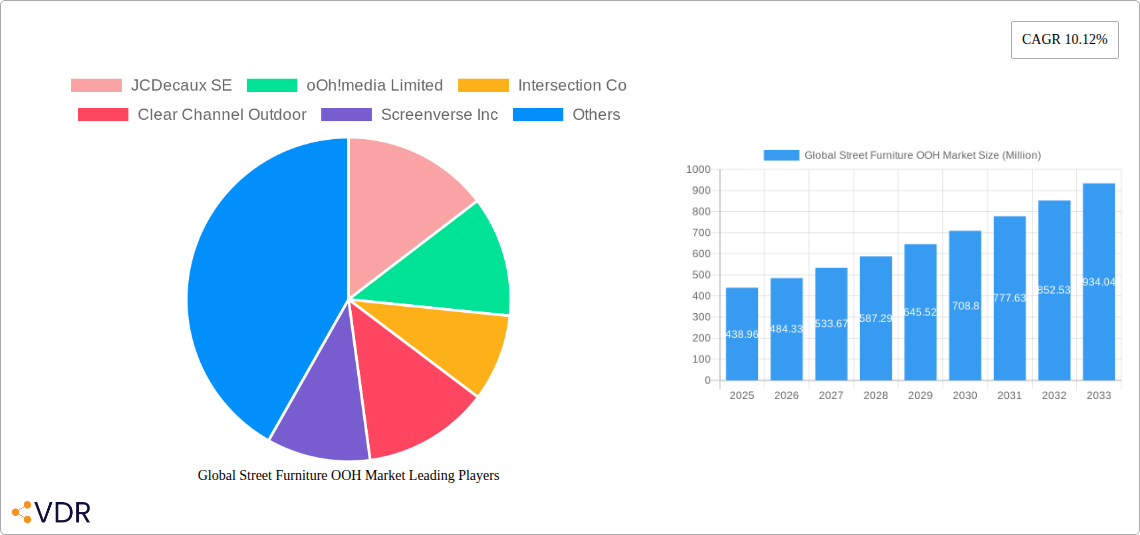
The Global Street Furniture Out-of-Home (OOH) advertising market is experiencing robust growth, projected to reach $438.96 million in 2025 and maintain a Compound Annual Growth Rate (CAGR) of 10.12% from 2025 to 2033. This expansion is fueled by several key factors. Increasing urbanization leads to higher foot traffic in densely populated areas, making street furniture advertising highly effective for reaching target audiences. The adoption of digital technologies within street furniture displays, including interactive screens and programmatic advertising capabilities, enhances engagement and offers advanced targeting options, thereby attracting more advertisers. Furthermore, innovative designs and creative advertising campaigns are boosting the appeal and effectiveness of street furniture OOH, contributing to its market growth. The market is also witnessing a shift toward data-driven strategies, allowing advertisers to measure the effectiveness of their campaigns more accurately and optimize their spending.
However, the market faces certain challenges. Competition from other OOH advertising formats, such as billboards and transit advertising, necessitates continuous innovation and differentiation. Regulatory hurdles regarding placement and aesthetics of street furniture advertisements in various cities and regions can also pose a constraint. Furthermore, economic downturns can impact advertising budgets, potentially slowing market growth temporarily. Despite these challenges, the overall outlook for the Global Street Furniture OOH Market remains positive, driven by technological advancements, increasing urbanization, and the continued need for effective and impactful outdoor advertising solutions. Key players like JCDecaux SE, oOh!media Limited, and Clear Channel Outdoor are strategically positioning themselves to capitalize on this growth, investing in innovative technologies and expanding their global reach.
Global Street Furniture Out-of-Home (OOH) Advertising Market Report: 2019-2033
This comprehensive report provides an in-depth analysis of the global street furniture Out-of-Home (OOH) advertising market, encompassing market dynamics, growth trends, regional dominance, product landscape, key players, and future outlook. The report covers the period 2019-2033, with a focus on the 2025-2033 forecast period and a base year of 2025. This detailed analysis is crucial for businesses operating within the broader OOH advertising and street furniture sectors.
Global Street Furniture OOH Market Market Dynamics & Structure
The global street furniture OOH market is characterized by moderate concentration, with a few major players holding significant market share. Technological innovation, particularly in digital displays and data analytics, is a key driver, alongside evolving regulatory frameworks governing advertising placement and content. The market faces competition from other advertising mediums, including digital advertising and social media. End-user demographics are shifting towards younger, digitally-native consumers, influencing advertising strategies. M&A activity within the sector is expected to remain relatively steady.
- Market Concentration: XX% market share held by top 5 players in 2024.
- Technological Innovation: Focus on smart displays, programmatic buying, and data-driven targeting.
- Regulatory Frameworks: Varying regulations across regions impacting advertising content and placement.
- Competitive Substitutes: Digital advertising, social media, and other OOH formats present competitive pressures.
- End-User Demographics: Shift towards younger demographics drives demand for engaging digital formats.
- M&A Trends: XX major M&A deals were recorded between 2019 and 2024, with a predicted xx deals for 2025-2033.
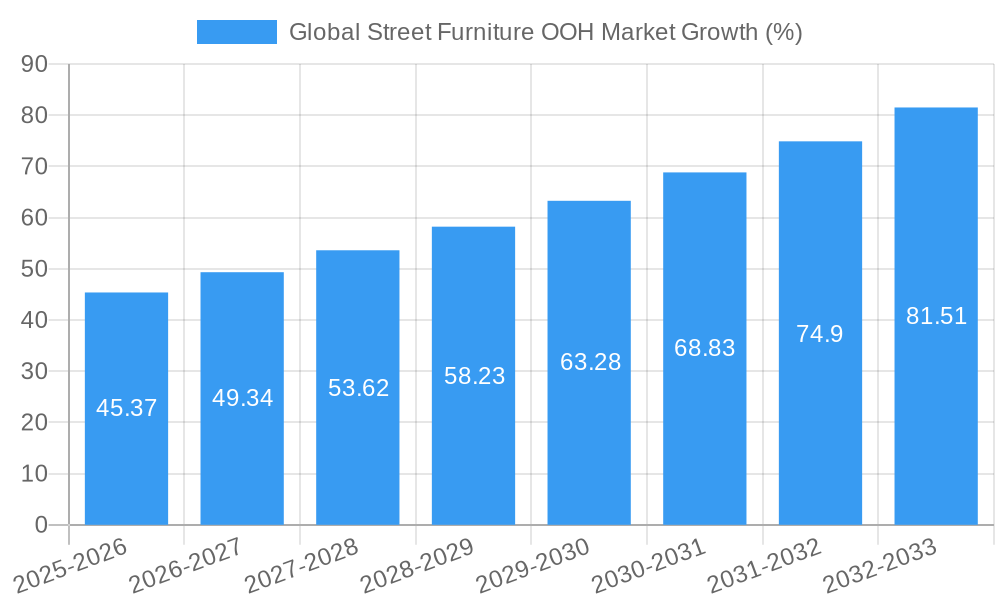
Global Street Furniture OOH Market Growth Trends & Insights
The global street furniture OOH market exhibited a CAGR of XX% during the historical period (2019-2024) and is projected to grow at a CAGR of XX% during the forecast period (2025-2033), reaching a market size of XXX Million units by 2033. This growth is fueled by increasing urbanization, rising disposable incomes in developing economies, and the adoption of advanced digital technologies within the OOH sector. Market penetration of digital street furniture displays is increasing, leading to higher engagement rates and more targeted advertising campaigns. Consumer behavior shifts toward mobile-first experiences influence the design and placement of street furniture OOH ads. Technological disruptions, such as the integration of augmented reality (AR) and Internet of Things (IoT) technologies, offer significant growth opportunities.
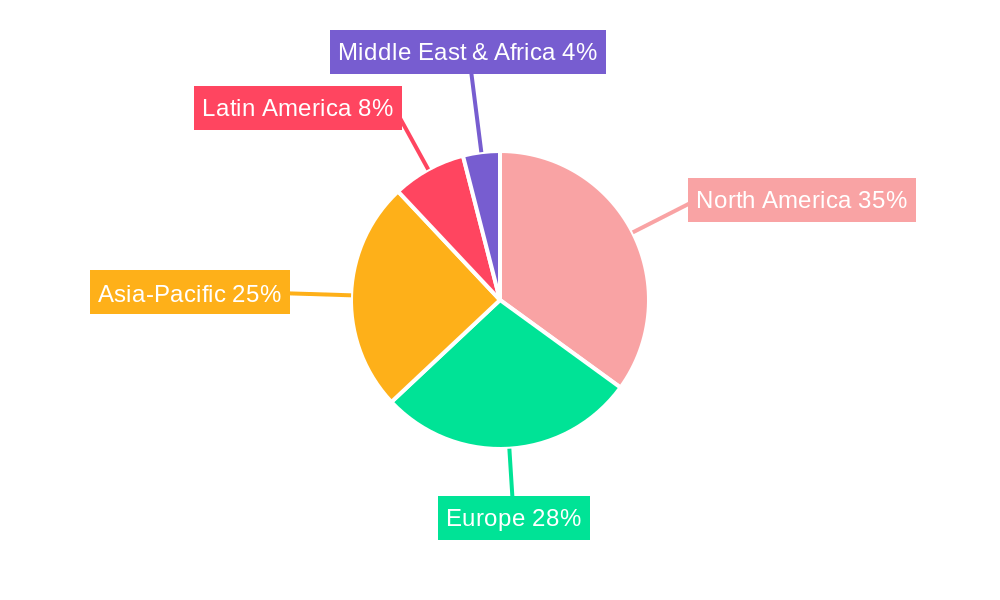
Dominant Regions, Countries, or Segments in Global Street Furniture OOH Market
North America currently holds the largest market share due to high advertising spending and well-developed OOH infrastructure. Europe follows closely, driven by strong demand in major metropolitan areas. Asia-Pacific is projected to witness significant growth in the forecast period driven by rapid urbanization and rising disposable incomes, specifically in countries like China and India.
- North America: High advertising expenditure, advanced infrastructure, and strong adoption of digital technologies.
- Europe: Established OOH markets in major cities, with growing adoption of digital formats.
- Asia-Pacific: Rapid urbanization, rising disposable incomes, and increasing investment in OOH infrastructure.
- Other Regions: Emerging markets in Latin America and Africa offer significant, albeit slower, growth potential.
Global Street Furniture OOH Market Product Landscape
The street furniture OOH market offers a diverse product landscape, ranging from traditional static billboards to advanced digital displays incorporating LED screens, interactive features, and data analytics capabilities. These products are designed for various applications, including bus shelters, benches, kiosks, and lampposts. Unique selling propositions focus on high visibility, targeted audience reach, and the integration of data-driven insights to measure campaign effectiveness. Technological advancements are driven by the need for enhanced audience engagement and data analytics.
Key Drivers, Barriers & Challenges in Global Street Furniture OOH Market
Key Drivers: Increasing urbanization, rising advertising expenditure, technological advancements (digital displays, data analytics), and the integration of smart city initiatives are major catalysts for market growth.
Challenges: Competition from other advertising mediums, regulatory hurdles related to advertising placement and content, supply chain disruptions impacting material availability and manufacturing costs, and the economic impact of factors like inflation and recession.
Emerging Opportunities in Global Street Furniture OOH Market
Untapped markets in developing economies present significant growth opportunities. Innovative applications such as interactive displays, AR/VR integrations, and personalized advertising experiences are gaining traction. Evolving consumer preferences towards experiences and interactive content create demand for dynamic and engaging OOH campaigns.
Growth Accelerators in the Global Street Furniture OOH Market Industry
Technological breakthroughs, specifically in digital display technologies and data analytics, are driving long-term growth. Strategic partnerships between OOH companies and technology providers enhance capabilities and expand market reach. Market expansion strategies targeting untapped regions and demographic segments are crucial.
Key Players Shaping the Global Street Furniture OOH Market Market
- JCDecaux SE
- oOh!media Limited
- Intersection Co
- Clear Channel Outdoor
- Screenverse Inc
- Inspiria Outdoor Advertising
- Lamar Advertising Company
- Talon OOH
Notable Milestones in Global Street Furniture OOH Market Sector
- April 2024: oOh!media launched its digital Woollahra OOH Street Furniture network, featuring luxury brands like JLR Australia, MECCA, Tiffany & Co., TAG Heuer, and Fendi. This highlights the increasing adoption of premium digital OOH formats.
- April 2024: Provantage launched a comprehensive audience measurement tool for place-based networks (PBN) in South Africa, improving campaign effectiveness and data-driven decision-making within the OOH sector.
In-Depth Global Street Furniture OOH Market Market Outlook
The future of the street furniture OOH market is bright, fueled by ongoing technological advancements, expanding digital adoption, and increased data-driven targeting capabilities. Strategic partnerships and acquisitions will continue to reshape the competitive landscape, fostering innovation and expansion into new markets. The market's growth trajectory is projected to be robust, with significant opportunities for companies embracing innovative technologies and adapting to evolving consumer preferences.
Global Street Furniture OOH Market Segmentation
-
1. Type
- 1.1. Static (Traditional) OOH
- 1.2. Digital OOH (LED Screens)
-
2. Organization Size
- 2.1. Small and Medium-sized Enterprises (SMEs)
- 2.2. Large Enterprise
-
3. End-User Industry
- 3.1. Automotive
- 3.2. Retail? and Consumer Goods
- 3.3. Healthcare
- 3.4. BFSI
- 3.5. Other End-User Industries
Global Street Furniture OOH Market Segmentation By Geography
- 1. North America
- 2. Europe
- 3. Asia
- 4. Australia and New Zealand
- 5. Latin America
- 6. Middle East and Africa
Global Street Furniture OOH Market REPORT HIGHLIGHTS
| Aspects | Details |
|---|---|
| Study Period | 2019-2033 |
| Base Year | 2024 |
| Estimated Year | 2025 |
| Forecast Period | 2025-2033 |
| Historical Period | 2019-2024 |
| Growth Rate | CAGR of 10.12% from 2019-2033 |
| Segmentation |
|
Table of Contents
- 1. Introduction
- 1.1. Research Scope
- 1.2. Market Segmentation
- 1.3. Research Methodology
- 1.4. Definitions and Assumptions
- 2. Executive Summary
- 2.1. Introduction
- 3. Market Dynamics
- 3.1. Introduction
- 3.2. Market Drivers
- 3.2.1. Ongoing Shift Towards Digital Advertising Aided By Increased Spending On Smart City Projects; Increase in Traffic Intensity owing to Growth in Tourism Industry has aided the spending on Street Furniture Advertisement
- 3.3. Market Restrains
- 3.3.1. Ongoing Shift Towards Digital Advertising Aided By Increased Spending On Smart City Projects; Increase in Traffic Intensity owing to Growth in Tourism Industry has aided the spending on Street Furniture Advertisement
- 3.4. Market Trends
- 3.4.1. Smart Cities Are Expected To Generate Significant Demand for Digital OOH
- 4. Market Factor Analysis
- 4.1. Porters Five Forces
- 4.2. Supply/Value Chain
- 4.3. PESTEL analysis
- 4.4. Market Entropy
- 4.5. Patent/Trademark Analysis
- 5. Global Street Furniture OOH Market Analysis, Insights and Forecast, 2019-2031
- 5.1. Market Analysis, Insights and Forecast - by Type
- 5.1.1. Static (Traditional) OOH
- 5.1.2. Digital OOH (LED Screens)
- 5.2. Market Analysis, Insights and Forecast - by Organization Size
- 5.2.1. Small and Medium-sized Enterprises (SMEs)
- 5.2.2. Large Enterprise
- 5.3. Market Analysis, Insights and Forecast - by End-User Industry
- 5.3.1. Automotive
- 5.3.2. Retail? and Consumer Goods
- 5.3.3. Healthcare
- 5.3.4. BFSI
- 5.3.5. Other End-User Industries
- 5.4. Market Analysis, Insights and Forecast - by Region
- 5.4.1. North America
- 5.4.2. Europe
- 5.4.3. Asia
- 5.4.4. Australia and New Zealand
- 5.4.5. Latin America
- 5.4.6. Middle East and Africa
- 5.1. Market Analysis, Insights and Forecast - by Type
- 6. North America Global Street Furniture OOH Market Analysis, Insights and Forecast, 2019-2031
- 6.1. Market Analysis, Insights and Forecast - by Type
- 6.1.1. Static (Traditional) OOH
- 6.1.2. Digital OOH (LED Screens)
- 6.2. Market Analysis, Insights and Forecast - by Organization Size
- 6.2.1. Small and Medium-sized Enterprises (SMEs)
- 6.2.2. Large Enterprise
- 6.3. Market Analysis, Insights and Forecast - by End-User Industry
- 6.3.1. Automotive
- 6.3.2. Retail? and Consumer Goods
- 6.3.3. Healthcare
- 6.3.4. BFSI
- 6.3.5. Other End-User Industries
- 6.1. Market Analysis, Insights and Forecast - by Type
- 7. Europe Global Street Furniture OOH Market Analysis, Insights and Forecast, 2019-2031
- 7.1. Market Analysis, Insights and Forecast - by Type
- 7.1.1. Static (Traditional) OOH
- 7.1.2. Digital OOH (LED Screens)
- 7.2. Market Analysis, Insights and Forecast - by Organization Size
- 7.2.1. Small and Medium-sized Enterprises (SMEs)
- 7.2.2. Large Enterprise
- 7.3. Market Analysis, Insights and Forecast - by End-User Industry
- 7.3.1. Automotive
- 7.3.2. Retail? and Consumer Goods
- 7.3.3. Healthcare
- 7.3.4. BFSI
- 7.3.5. Other End-User Industries
- 7.1. Market Analysis, Insights and Forecast - by Type
- 8. Asia Global Street Furniture OOH Market Analysis, Insights and Forecast, 2019-2031
- 8.1. Market Analysis, Insights and Forecast - by Type
- 8.1.1. Static (Traditional) OOH
- 8.1.2. Digital OOH (LED Screens)
- 8.2. Market Analysis, Insights and Forecast - by Organization Size
- 8.2.1. Small and Medium-sized Enterprises (SMEs)
- 8.2.2. Large Enterprise
- 8.3. Market Analysis, Insights and Forecast - by End-User Industry
- 8.3.1. Automotive
- 8.3.2. Retail? and Consumer Goods
- 8.3.3. Healthcare
- 8.3.4. BFSI
- 8.3.5. Other End-User Industries
- 8.1. Market Analysis, Insights and Forecast - by Type
- 9. Australia and New Zealand Global Street Furniture OOH Market Analysis, Insights and Forecast, 2019-2031
- 9.1. Market Analysis, Insights and Forecast - by Type
- 9.1.1. Static (Traditional) OOH
- 9.1.2. Digital OOH (LED Screens)
- 9.2. Market Analysis, Insights and Forecast - by Organization Size
- 9.2.1. Small and Medium-sized Enterprises (SMEs)
- 9.2.2. Large Enterprise
- 9.3. Market Analysis, Insights and Forecast - by End-User Industry
- 9.3.1. Automotive
- 9.3.2. Retail? and Consumer Goods
- 9.3.3. Healthcare
- 9.3.4. BFSI
- 9.3.5. Other End-User Industries
- 9.1. Market Analysis, Insights and Forecast - by Type
- 10. Latin America Global Street Furniture OOH Market Analysis, Insights and Forecast, 2019-2031
- 10.1. Market Analysis, Insights and Forecast - by Type
- 10.1.1. Static (Traditional) OOH
- 10.1.2. Digital OOH (LED Screens)
- 10.2. Market Analysis, Insights and Forecast - by Organization Size
- 10.2.1. Small and Medium-sized Enterprises (SMEs)
- 10.2.2. Large Enterprise
- 10.3. Market Analysis, Insights and Forecast - by End-User Industry
- 10.3.1. Automotive
- 10.3.2. Retail? and Consumer Goods
- 10.3.3. Healthcare
- 10.3.4. BFSI
- 10.3.5. Other End-User Industries
- 10.1. Market Analysis, Insights and Forecast - by Type
- 11. Middle East and Africa Global Street Furniture OOH Market Analysis, Insights and Forecast, 2019-2031
- 11.1. Market Analysis, Insights and Forecast - by Type
- 11.1.1. Static (Traditional) OOH
- 11.1.2. Digital OOH (LED Screens)
- 11.2. Market Analysis, Insights and Forecast - by Organization Size
- 11.2.1. Small and Medium-sized Enterprises (SMEs)
- 11.2.2. Large Enterprise
- 11.3. Market Analysis, Insights and Forecast - by End-User Industry
- 11.3.1. Automotive
- 11.3.2. Retail? and Consumer Goods
- 11.3.3. Healthcare
- 11.3.4. BFSI
- 11.3.5. Other End-User Industries
- 11.1. Market Analysis, Insights and Forecast - by Type
- 12. Competitive Analysis
- 12.1. Market Share Analysis 2024
- 12.2. Company Profiles
- 12.2.1 JCDecaux SE
- 12.2.1.1. Overview
- 12.2.1.2. Products
- 12.2.1.3. SWOT Analysis
- 12.2.1.4. Recent Developments
- 12.2.1.5. Financials (Based on Availability)
- 12.2.2 oOh!media Limited
- 12.2.2.1. Overview
- 12.2.2.2. Products
- 12.2.2.3. SWOT Analysis
- 12.2.2.4. Recent Developments
- 12.2.2.5. Financials (Based on Availability)
- 12.2.3 Intersection Co
- 12.2.3.1. Overview
- 12.2.3.2. Products
- 12.2.3.3. SWOT Analysis
- 12.2.3.4. Recent Developments
- 12.2.3.5. Financials (Based on Availability)
- 12.2.4 Clear Channel Outdoor
- 12.2.4.1. Overview
- 12.2.4.2. Products
- 12.2.4.3. SWOT Analysis
- 12.2.4.4. Recent Developments
- 12.2.4.5. Financials (Based on Availability)
- 12.2.5 Screenverse Inc
- 12.2.5.1. Overview
- 12.2.5.2. Products
- 12.2.5.3. SWOT Analysis
- 12.2.5.4. Recent Developments
- 12.2.5.5. Financials (Based on Availability)
- 12.2.6 Inspiria Outdoor Advertising
- 12.2.6.1. Overview
- 12.2.6.2. Products
- 12.2.6.3. SWOT Analysis
- 12.2.6.4. Recent Developments
- 12.2.6.5. Financials (Based on Availability)
- 12.2.7 Lamar Advertising Company
- 12.2.7.1. Overview
- 12.2.7.2. Products
- 12.2.7.3. SWOT Analysis
- 12.2.7.4. Recent Developments
- 12.2.7.5. Financials (Based on Availability)
- 12.2.8 Talon OOH7 2 Vendor Positioning Analysi
- 12.2.8.1. Overview
- 12.2.8.2. Products
- 12.2.8.3. SWOT Analysis
- 12.2.8.4. Recent Developments
- 12.2.8.5. Financials (Based on Availability)
- 12.2.1 JCDecaux SE
List of Figures
- Figure 1: Global Global Street Furniture OOH Market Revenue Breakdown (Million, %) by Region 2024 & 2032
- Figure 2: Global Global Street Furniture OOH Market Volume Breakdown (Million, %) by Region 2024 & 2032
- Figure 3: North America Global Street Furniture OOH Market Revenue (Million), by Type 2024 & 2032
- Figure 4: North America Global Street Furniture OOH Market Volume (Million), by Type 2024 & 2032
- Figure 5: North America Global Street Furniture OOH Market Revenue Share (%), by Type 2024 & 2032
- Figure 6: North America Global Street Furniture OOH Market Volume Share (%), by Type 2024 & 2032
- Figure 7: North America Global Street Furniture OOH Market Revenue (Million), by Organization Size 2024 & 2032
- Figure 8: North America Global Street Furniture OOH Market Volume (Million), by Organization Size 2024 & 2032
- Figure 9: North America Global Street Furniture OOH Market Revenue Share (%), by Organization Size 2024 & 2032
- Figure 10: North America Global Street Furniture OOH Market Volume Share (%), by Organization Size 2024 & 2032
- Figure 11: North America Global Street Furniture OOH Market Revenue (Million), by End-User Industry 2024 & 2032
- Figure 12: North America Global Street Furniture OOH Market Volume (Million), by End-User Industry 2024 & 2032
- Figure 13: North America Global Street Furniture OOH Market Revenue Share (%), by End-User Industry 2024 & 2032
- Figure 14: North America Global Street Furniture OOH Market Volume Share (%), by End-User Industry 2024 & 2032
- Figure 15: North America Global Street Furniture OOH Market Revenue (Million), by Country 2024 & 2032
- Figure 16: North America Global Street Furniture OOH Market Volume (Million), by Country 2024 & 2032
- Figure 17: North America Global Street Furniture OOH Market Revenue Share (%), by Country 2024 & 2032
- Figure 18: North America Global Street Furniture OOH Market Volume Share (%), by Country 2024 & 2032
- Figure 19: Europe Global Street Furniture OOH Market Revenue (Million), by Type 2024 & 2032
- Figure 20: Europe Global Street Furniture OOH Market Volume (Million), by Type 2024 & 2032
- Figure 21: Europe Global Street Furniture OOH Market Revenue Share (%), by Type 2024 & 2032
- Figure 22: Europe Global Street Furniture OOH Market Volume Share (%), by Type 2024 & 2032
- Figure 23: Europe Global Street Furniture OOH Market Revenue (Million), by Organization Size 2024 & 2032
- Figure 24: Europe Global Street Furniture OOH Market Volume (Million), by Organization Size 2024 & 2032
- Figure 25: Europe Global Street Furniture OOH Market Revenue Share (%), by Organization Size 2024 & 2032
- Figure 26: Europe Global Street Furniture OOH Market Volume Share (%), by Organization Size 2024 & 2032
- Figure 27: Europe Global Street Furniture OOH Market Revenue (Million), by End-User Industry 2024 & 2032
- Figure 28: Europe Global Street Furniture OOH Market Volume (Million), by End-User Industry 2024 & 2032
- Figure 29: Europe Global Street Furniture OOH Market Revenue Share (%), by End-User Industry 2024 & 2032
- Figure 30: Europe Global Street Furniture OOH Market Volume Share (%), by End-User Industry 2024 & 2032
- Figure 31: Europe Global Street Furniture OOH Market Revenue (Million), by Country 2024 & 2032
- Figure 32: Europe Global Street Furniture OOH Market Volume (Million), by Country 2024 & 2032
- Figure 33: Europe Global Street Furniture OOH Market Revenue Share (%), by Country 2024 & 2032
- Figure 34: Europe Global Street Furniture OOH Market Volume Share (%), by Country 2024 & 2032
- Figure 35: Asia Global Street Furniture OOH Market Revenue (Million), by Type 2024 & 2032
- Figure 36: Asia Global Street Furniture OOH Market Volume (Million), by Type 2024 & 2032
- Figure 37: Asia Global Street Furniture OOH Market Revenue Share (%), by Type 2024 & 2032
- Figure 38: Asia Global Street Furniture OOH Market Volume Share (%), by Type 2024 & 2032
- Figure 39: Asia Global Street Furniture OOH Market Revenue (Million), by Organization Size 2024 & 2032
- Figure 40: Asia Global Street Furniture OOH Market Volume (Million), by Organization Size 2024 & 2032
- Figure 41: Asia Global Street Furniture OOH Market Revenue Share (%), by Organization Size 2024 & 2032
- Figure 42: Asia Global Street Furniture OOH Market Volume Share (%), by Organization Size 2024 & 2032
- Figure 43: Asia Global Street Furniture OOH Market Revenue (Million), by End-User Industry 2024 & 2032
- Figure 44: Asia Global Street Furniture OOH Market Volume (Million), by End-User Industry 2024 & 2032
- Figure 45: Asia Global Street Furniture OOH Market Revenue Share (%), by End-User Industry 2024 & 2032
- Figure 46: Asia Global Street Furniture OOH Market Volume Share (%), by End-User Industry 2024 & 2032
- Figure 47: Asia Global Street Furniture OOH Market Revenue (Million), by Country 2024 & 2032
- Figure 48: Asia Global Street Furniture OOH Market Volume (Million), by Country 2024 & 2032
- Figure 49: Asia Global Street Furniture OOH Market Revenue Share (%), by Country 2024 & 2032
- Figure 50: Asia Global Street Furniture OOH Market Volume Share (%), by Country 2024 & 2032
- Figure 51: Australia and New Zealand Global Street Furniture OOH Market Revenue (Million), by Type 2024 & 2032
- Figure 52: Australia and New Zealand Global Street Furniture OOH Market Volume (Million), by Type 2024 & 2032
- Figure 53: Australia and New Zealand Global Street Furniture OOH Market Revenue Share (%), by Type 2024 & 2032
- Figure 54: Australia and New Zealand Global Street Furniture OOH Market Volume Share (%), by Type 2024 & 2032
- Figure 55: Australia and New Zealand Global Street Furniture OOH Market Revenue (Million), by Organization Size 2024 & 2032
- Figure 56: Australia and New Zealand Global Street Furniture OOH Market Volume (Million), by Organization Size 2024 & 2032
- Figure 57: Australia and New Zealand Global Street Furniture OOH Market Revenue Share (%), by Organization Size 2024 & 2032
- Figure 58: Australia and New Zealand Global Street Furniture OOH Market Volume Share (%), by Organization Size 2024 & 2032
- Figure 59: Australia and New Zealand Global Street Furniture OOH Market Revenue (Million), by End-User Industry 2024 & 2032
- Figure 60: Australia and New Zealand Global Street Furniture OOH Market Volume (Million), by End-User Industry 2024 & 2032
- Figure 61: Australia and New Zealand Global Street Furniture OOH Market Revenue Share (%), by End-User Industry 2024 & 2032
- Figure 62: Australia and New Zealand Global Street Furniture OOH Market Volume Share (%), by End-User Industry 2024 & 2032
- Figure 63: Australia and New Zealand Global Street Furniture OOH Market Revenue (Million), by Country 2024 & 2032
- Figure 64: Australia and New Zealand Global Street Furniture OOH Market Volume (Million), by Country 2024 & 2032
- Figure 65: Australia and New Zealand Global Street Furniture OOH Market Revenue Share (%), by Country 2024 & 2032
- Figure 66: Australia and New Zealand Global Street Furniture OOH Market Volume Share (%), by Country 2024 & 2032
- Figure 67: Latin America Global Street Furniture OOH Market Revenue (Million), by Type 2024 & 2032
- Figure 68: Latin America Global Street Furniture OOH Market Volume (Million), by Type 2024 & 2032
- Figure 69: Latin America Global Street Furniture OOH Market Revenue Share (%), by Type 2024 & 2032
- Figure 70: Latin America Global Street Furniture OOH Market Volume Share (%), by Type 2024 & 2032
- Figure 71: Latin America Global Street Furniture OOH Market Revenue (Million), by Organization Size 2024 & 2032
- Figure 72: Latin America Global Street Furniture OOH Market Volume (Million), by Organization Size 2024 & 2032
- Figure 73: Latin America Global Street Furniture OOH Market Revenue Share (%), by Organization Size 2024 & 2032
- Figure 74: Latin America Global Street Furniture OOH Market Volume Share (%), by Organization Size 2024 & 2032
- Figure 75: Latin America Global Street Furniture OOH Market Revenue (Million), by End-User Industry 2024 & 2032
- Figure 76: Latin America Global Street Furniture OOH Market Volume (Million), by End-User Industry 2024 & 2032
- Figure 77: Latin America Global Street Furniture OOH Market Revenue Share (%), by End-User Industry 2024 & 2032
- Figure 78: Latin America Global Street Furniture OOH Market Volume Share (%), by End-User Industry 2024 & 2032
- Figure 79: Latin America Global Street Furniture OOH Market Revenue (Million), by Country 2024 & 2032
- Figure 80: Latin America Global Street Furniture OOH Market Volume (Million), by Country 2024 & 2032
- Figure 81: Latin America Global Street Furniture OOH Market Revenue Share (%), by Country 2024 & 2032
- Figure 82: Latin America Global Street Furniture OOH Market Volume Share (%), by Country 2024 & 2032
- Figure 83: Middle East and Africa Global Street Furniture OOH Market Revenue (Million), by Type 2024 & 2032
- Figure 84: Middle East and Africa Global Street Furniture OOH Market Volume (Million), by Type 2024 & 2032
- Figure 85: Middle East and Africa Global Street Furniture OOH Market Revenue Share (%), by Type 2024 & 2032
- Figure 86: Middle East and Africa Global Street Furniture OOH Market Volume Share (%), by Type 2024 & 2032
- Figure 87: Middle East and Africa Global Street Furniture OOH Market Revenue (Million), by Organization Size 2024 & 2032
- Figure 88: Middle East and Africa Global Street Furniture OOH Market Volume (Million), by Organization Size 2024 & 2032
- Figure 89: Middle East and Africa Global Street Furniture OOH Market Revenue Share (%), by Organization Size 2024 & 2032
- Figure 90: Middle East and Africa Global Street Furniture OOH Market Volume Share (%), by Organization Size 2024 & 2032
- Figure 91: Middle East and Africa Global Street Furniture OOH Market Revenue (Million), by End-User Industry 2024 & 2032
- Figure 92: Middle East and Africa Global Street Furniture OOH Market Volume (Million), by End-User Industry 2024 & 2032
- Figure 93: Middle East and Africa Global Street Furniture OOH Market Revenue Share (%), by End-User Industry 2024 & 2032
- Figure 94: Middle East and Africa Global Street Furniture OOH Market Volume Share (%), by End-User Industry 2024 & 2032
- Figure 95: Middle East and Africa Global Street Furniture OOH Market Revenue (Million), by Country 2024 & 2032
- Figure 96: Middle East and Africa Global Street Furniture OOH Market Volume (Million), by Country 2024 & 2032
- Figure 97: Middle East and Africa Global Street Furniture OOH Market Revenue Share (%), by Country 2024 & 2032
- Figure 98: Middle East and Africa Global Street Furniture OOH Market Volume Share (%), by Country 2024 & 2032
List of Tables
- Table 1: Global Street Furniture OOH Market Revenue Million Forecast, by Region 2019 & 2032
- Table 2: Global Street Furniture OOH Market Volume Million Forecast, by Region 2019 & 2032
- Table 3: Global Street Furniture OOH Market Revenue Million Forecast, by Type 2019 & 2032
- Table 4: Global Street Furniture OOH Market Volume Million Forecast, by Type 2019 & 2032
- Table 5: Global Street Furniture OOH Market Revenue Million Forecast, by Organization Size 2019 & 2032
- Table 6: Global Street Furniture OOH Market Volume Million Forecast, by Organization Size 2019 & 2032
- Table 7: Global Street Furniture OOH Market Revenue Million Forecast, by End-User Industry 2019 & 2032
- Table 8: Global Street Furniture OOH Market Volume Million Forecast, by End-User Industry 2019 & 2032
- Table 9: Global Street Furniture OOH Market Revenue Million Forecast, by Region 2019 & 2032
- Table 10: Global Street Furniture OOH Market Volume Million Forecast, by Region 2019 & 2032
- Table 11: Global Street Furniture OOH Market Revenue Million Forecast, by Type 2019 & 2032
- Table 12: Global Street Furniture OOH Market Volume Million Forecast, by Type 2019 & 2032
- Table 13: Global Street Furniture OOH Market Revenue Million Forecast, by Organization Size 2019 & 2032
- Table 14: Global Street Furniture OOH Market Volume Million Forecast, by Organization Size 2019 & 2032
- Table 15: Global Street Furniture OOH Market Revenue Million Forecast, by End-User Industry 2019 & 2032
- Table 16: Global Street Furniture OOH Market Volume Million Forecast, by End-User Industry 2019 & 2032
- Table 17: Global Street Furniture OOH Market Revenue Million Forecast, by Country 2019 & 2032
- Table 18: Global Street Furniture OOH Market Volume Million Forecast, by Country 2019 & 2032
- Table 19: Global Street Furniture OOH Market Revenue Million Forecast, by Type 2019 & 2032
- Table 20: Global Street Furniture OOH Market Volume Million Forecast, by Type 2019 & 2032
- Table 21: Global Street Furniture OOH Market Revenue Million Forecast, by Organization Size 2019 & 2032
- Table 22: Global Street Furniture OOH Market Volume Million Forecast, by Organization Size 2019 & 2032
- Table 23: Global Street Furniture OOH Market Revenue Million Forecast, by End-User Industry 2019 & 2032
- Table 24: Global Street Furniture OOH Market Volume Million Forecast, by End-User Industry 2019 & 2032
- Table 25: Global Street Furniture OOH Market Revenue Million Forecast, by Country 2019 & 2032
- Table 26: Global Street Furniture OOH Market Volume Million Forecast, by Country 2019 & 2032
- Table 27: Global Street Furniture OOH Market Revenue Million Forecast, by Type 2019 & 2032
- Table 28: Global Street Furniture OOH Market Volume Million Forecast, by Type 2019 & 2032
- Table 29: Global Street Furniture OOH Market Revenue Million Forecast, by Organization Size 2019 & 2032
- Table 30: Global Street Furniture OOH Market Volume Million Forecast, by Organization Size 2019 & 2032
- Table 31: Global Street Furniture OOH Market Revenue Million Forecast, by End-User Industry 2019 & 2032
- Table 32: Global Street Furniture OOH Market Volume Million Forecast, by End-User Industry 2019 & 2032
- Table 33: Global Street Furniture OOH Market Revenue Million Forecast, by Country 2019 & 2032
- Table 34: Global Street Furniture OOH Market Volume Million Forecast, by Country 2019 & 2032
- Table 35: Global Street Furniture OOH Market Revenue Million Forecast, by Type 2019 & 2032
- Table 36: Global Street Furniture OOH Market Volume Million Forecast, by Type 2019 & 2032
- Table 37: Global Street Furniture OOH Market Revenue Million Forecast, by Organization Size 2019 & 2032
- Table 38: Global Street Furniture OOH Market Volume Million Forecast, by Organization Size 2019 & 2032
- Table 39: Global Street Furniture OOH Market Revenue Million Forecast, by End-User Industry 2019 & 2032
- Table 40: Global Street Furniture OOH Market Volume Million Forecast, by End-User Industry 2019 & 2032
- Table 41: Global Street Furniture OOH Market Revenue Million Forecast, by Country 2019 & 2032
- Table 42: Global Street Furniture OOH Market Volume Million Forecast, by Country 2019 & 2032
- Table 43: Global Street Furniture OOH Market Revenue Million Forecast, by Type 2019 & 2032
- Table 44: Global Street Furniture OOH Market Volume Million Forecast, by Type 2019 & 2032
- Table 45: Global Street Furniture OOH Market Revenue Million Forecast, by Organization Size 2019 & 2032
- Table 46: Global Street Furniture OOH Market Volume Million Forecast, by Organization Size 2019 & 2032
- Table 47: Global Street Furniture OOH Market Revenue Million Forecast, by End-User Industry 2019 & 2032
- Table 48: Global Street Furniture OOH Market Volume Million Forecast, by End-User Industry 2019 & 2032
- Table 49: Global Street Furniture OOH Market Revenue Million Forecast, by Country 2019 & 2032
- Table 50: Global Street Furniture OOH Market Volume Million Forecast, by Country 2019 & 2032
- Table 51: Global Street Furniture OOH Market Revenue Million Forecast, by Type 2019 & 2032
- Table 52: Global Street Furniture OOH Market Volume Million Forecast, by Type 2019 & 2032
- Table 53: Global Street Furniture OOH Market Revenue Million Forecast, by Organization Size 2019 & 2032
- Table 54: Global Street Furniture OOH Market Volume Million Forecast, by Organization Size 2019 & 2032
- Table 55: Global Street Furniture OOH Market Revenue Million Forecast, by End-User Industry 2019 & 2032
- Table 56: Global Street Furniture OOH Market Volume Million Forecast, by End-User Industry 2019 & 2032
- Table 57: Global Street Furniture OOH Market Revenue Million Forecast, by Country 2019 & 2032
- Table 58: Global Street Furniture OOH Market Volume Million Forecast, by Country 2019 & 2032
Frequently Asked Questions
1. What is the projected Compound Annual Growth Rate (CAGR) of the Global Street Furniture OOH Market?
The projected CAGR is approximately 10.12%.
2. Which companies are prominent players in the Global Street Furniture OOH Market?
Key companies in the market include JCDecaux SE, oOh!media Limited, Intersection Co, Clear Channel Outdoor, Screenverse Inc, Inspiria Outdoor Advertising, Lamar Advertising Company, Talon OOH7 2 Vendor Positioning Analysi.
3. What are the main segments of the Global Street Furniture OOH Market?
The market segments include Type, Organization Size, End-User Industry.
4. Can you provide details about the market size?
The market size is estimated to be USD 438.96 Million as of 2022.
5. What are some drivers contributing to market growth?
Ongoing Shift Towards Digital Advertising Aided By Increased Spending On Smart City Projects; Increase in Traffic Intensity owing to Growth in Tourism Industry has aided the spending on Street Furniture Advertisement.
6. What are the notable trends driving market growth?
Smart Cities Are Expected To Generate Significant Demand for Digital OOH.
7. Are there any restraints impacting market growth?
Ongoing Shift Towards Digital Advertising Aided By Increased Spending On Smart City Projects; Increase in Traffic Intensity owing to Growth in Tourism Industry has aided the spending on Street Furniture Advertisement.
8. Can you provide examples of recent developments in the market?
April 2024: oOh!media revealed its advertising launch partners for the digital Woollahra OOH Street Furniture network. Luxury brands, including JLR Australia, MECCA, and LVMH’s prestigious brands, Tiffany & Co., TAG Heuer, and Fendi, debuted across the LED screens.
9. What pricing options are available for accessing the report?
Pricing options include single-user, multi-user, and enterprise licenses priced at USD 4750, USD 5250, and USD 8750 respectively.
10. Is the market size provided in terms of value or volume?
The market size is provided in terms of value, measured in Million and volume, measured in Million.
11. Are there any specific market keywords associated with the report?
Yes, the market keyword associated with the report is "Global Street Furniture OOH Market," which aids in identifying and referencing the specific market segment covered.
12. How do I determine which pricing option suits my needs best?
The pricing options vary based on user requirements and access needs. Individual users may opt for single-user licenses, while businesses requiring broader access may choose multi-user or enterprise licenses for cost-effective access to the report.
13. Are there any additional resources or data provided in the Global Street Furniture OOH Market report?
While the report offers comprehensive insights, it's advisable to review the specific contents or supplementary materials provided to ascertain if additional resources or data are available.
14. How can I stay updated on further developments or reports in the Global Street Furniture OOH Market?
To stay informed about further developments, trends, and reports in the Global Street Furniture OOH Market, consider subscribing to industry newsletters, following relevant companies and organizations, or regularly checking reputable industry news sources and publications.
Methodology
Step 1 - Identification of Relevant Samples Size from Population Database


Step 2 - Approaches for Defining Global Market Size (Value, Volume* & Price*)

Note*: In applicable scenarios
Step 3 - Data Sources
Primary Research
- Web Analytics
- Survey Reports
- Research Institute
- Latest Research Reports
- Opinion Leaders
Secondary Research
- Annual Reports
- White Paper
- Latest Press Release
- Industry Association
- Paid Database
- Investor Presentations

Step 4 - Data Triangulation
Involves using different sources of information in order to increase the validity of a study
These sources are likely to be stakeholders in a program - participants, other researchers, program staff, other community members, and so on.
Then we put all data in single framework & apply various statistical tools to find out the dynamic on the market.
During the analysis stage, feedback from the stakeholder groups would be compared to determine areas of agreement as well as areas of divergence


