
Key Insights
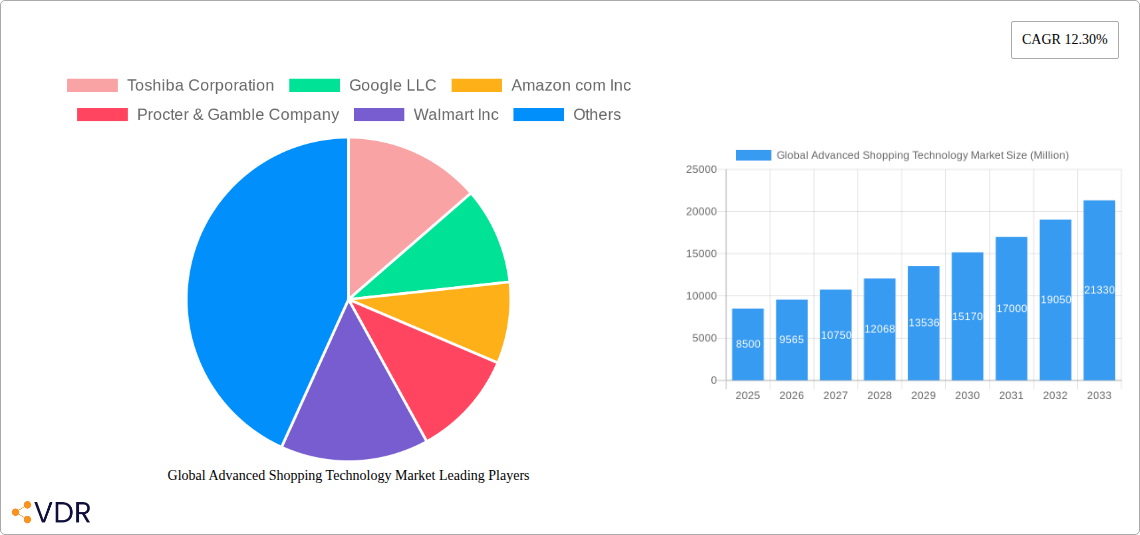
The global advanced shopping technology market is experiencing robust growth, driven by the increasing adoption of digital technologies in the retail and commercial advertising sectors. The market's compound annual growth rate (CAGR) of 12.30% from 2019 to 2024 suggests a significant expansion, projected to continue through 2033. Key drivers include the rising demand for personalized shopping experiences, the proliferation of mobile devices and internet penetration, and the increasing need for efficient inventory management and supply chain optimization. Emerging technologies like beacons, virtual reality (VR), and smart shelves are transforming the in-store shopping experience, while retail apps and social media platforms are enhancing online engagement and driving sales. Showrooming, where customers examine products in physical stores before purchasing online, also presents both a challenge and an opportunity for retailers to integrate online and offline channels effectively. Market segmentation reveals that retail applications currently dominate, although commercial advertising is showing significant growth potential. Leading companies like Toshiba, Google, Amazon, Procter & Gamble, and Walmart are actively investing in and developing innovative advanced shopping technologies, fueling competition and further market expansion. Geographic analysis indicates strong growth in North America and Asia-Pacific regions, driven by high consumer spending and technological advancements. However, regulatory challenges and concerns about data privacy could potentially restrain market growth to some extent.
The market's future trajectory hinges on continued technological innovation, particularly in areas such as artificial intelligence (AI)-powered personalization and augmented reality (AR) applications. The integration of omnichannel strategies and the development of robust cybersecurity measures will also be critical for long-term growth. Furthermore, emerging markets in regions like South America and the Middle East and Africa present significant untapped potential for expansion. As consumers increasingly demand seamless and personalized shopping experiences across all channels, the advanced shopping technology market is poised for continued expansion, driven by both established players and emerging startups. The focus will shift towards creating integrated, data-driven solutions that enhance both customer experience and business efficiency. Companies that effectively leverage data analytics to understand consumer behavior and personalize their offerings will likely enjoy a competitive advantage in this rapidly evolving landscape.
Global Advanced Shopping Technology Market: A Comprehensive Report (2019-2033)
This comprehensive report provides an in-depth analysis of the Global Advanced Shopping Technology Market, encompassing market dynamics, growth trends, regional analysis, product landscape, key players, and future outlook. The study period covers 2019-2033, with 2025 as the base and estimated year. The market is segmented by product type (Beacons, Virtual Reality, Smart Shelves, Retail Apps, Social Media and Showrooming, Others) and application (Retail, Commercial Advertising, Others). The report is invaluable for businesses, investors, and researchers seeking to understand and capitalize on the opportunities within this rapidly evolving sector. The total market size in 2025 is estimated at xx Million.
Global Advanced Shopping Technology Market Dynamics & Structure
The global advanced shopping technology market is characterized by a moderately concentrated structure, with key players like Toshiba Corporation, Google LLC, Amazon.com Inc, Procter & Gamble Company, and Walmart Inc. holding significant market share. Technological innovation is a primary driver, with continuous advancements in areas like artificial intelligence (AI), augmented reality (AR), and the Internet of Things (IoT) shaping new shopping experiences. Regulatory frameworks, particularly concerning data privacy and consumer protection, play a crucial role. The market also faces competition from traditional retail methods, although this is diminishing. Mergers and acquisitions (M&A) activity is significant, with larger companies acquiring smaller, innovative firms to expand their capabilities. The report analyzes xx M&A deals between 2019 and 2024 and forecasts a xx% increase in deal volume by 2033.
- Market Concentration: Moderately concentrated, with top 5 players holding xx% market share in 2025.
- Innovation Drivers: AI, AR, IoT, blockchain technology.
- Regulatory Landscape: Varying regulations across geographies impacting data privacy and security.
- Competitive Substitutes: Traditional retail methods, though declining in influence.
- End-User Demographics: Shifting towards digitally savvy consumers across age groups.
- M&A Activity: Significant activity driven by expansion and technological acquisition.
Global Advanced Shopping Technology Market Growth Trends & Insights
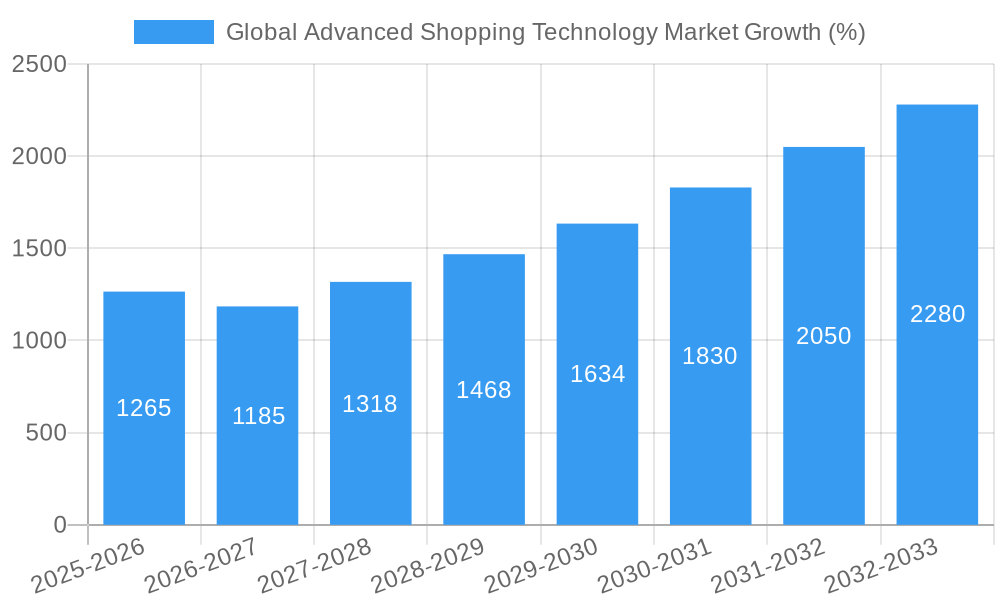
The global advanced shopping technology market exhibits robust growth, driven by increasing e-commerce adoption, the rise of omnichannel retail strategies, and evolving consumer expectations for personalized and seamless shopping experiences. The market size is projected to reach xx Million by 2033, exhibiting a CAGR of xx% during the forecast period (2025-2033). Technological disruptions, such as the integration of AI-powered chatbots and personalized recommendations, are accelerating market penetration. Consumer behavior shifts, including a preference for mobile shopping and contactless payments, further fuel this growth. Market penetration in developed regions is high (xx%), whereas developing regions present significant untapped potential.
Dominant Regions, Countries, or Segments in Global Advanced Shopping Technology Market
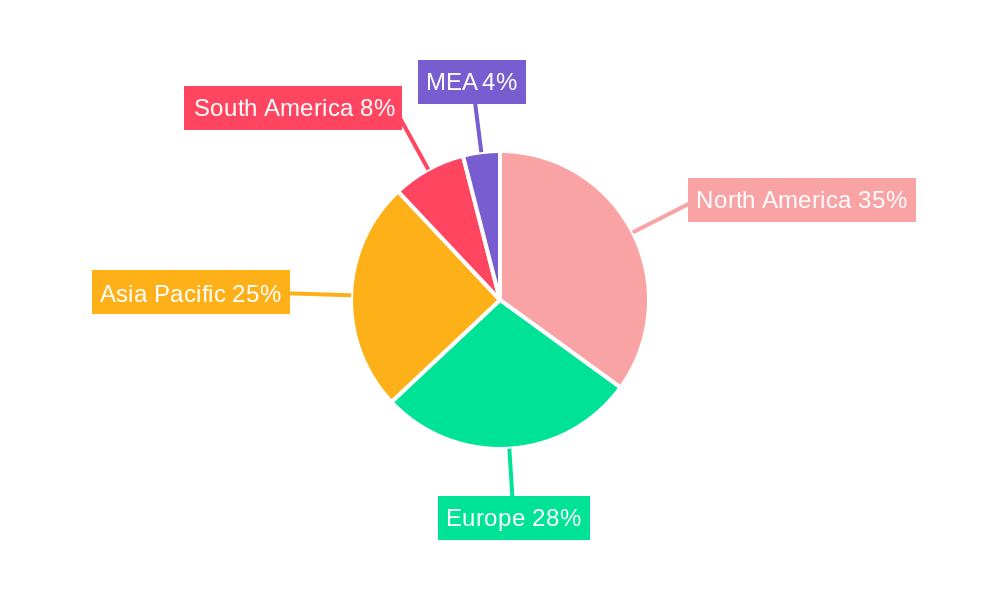
The North American region holds the largest market share in 2025, followed by Europe and Asia-Pacific. Within product types, Retail Apps and Smart Shelves dominate, driven by high adoption rates in retail settings. The retail application segment holds the largest market share, owing to the widespread integration of advanced technologies into physical stores to enhance customer experience and operational efficiency.
- North America Dominance: Driven by high technological adoption, strong e-commerce infrastructure, and early adoption of advanced shopping technologies.
- Retail Application Segment: Highest market share, owing to the increasing demand for enhanced in-store experiences and operational efficiency.
- Retail Apps and Smart Shelves: Leading product type segments due to high adoption and clear ROI for retailers.
- Asia-Pacific Growth Potential: Significant untapped potential driven by rising e-commerce penetration and increasing smartphone usage.
Global Advanced Shopping Technology Market Product Landscape
The advanced shopping technology market showcases a diverse product landscape, with continuous innovation across various product categories. Beacons enable location-based services, while virtual reality offers immersive shopping experiences. Smart shelves track inventory and provide real-time data, and retail apps offer personalized shopping assistance and mobile payment options. Social media and showrooming strategies leverage social platforms for product discovery and engagement, while other technologies, including AI-powered chatbots and advanced analytics platforms, are rapidly emerging. The key focus is on improving customer engagement, personalization, and operational efficiency.
Key Drivers, Barriers & Challenges in Global Advanced Shopping Technology Market
Key Drivers:
- Rising e-commerce penetration
- Increased adoption of omnichannel retail strategies
- Growing demand for personalized shopping experiences
- Technological advancements (AI, AR, IoT)
Key Challenges:
- High initial investment costs
- Data security and privacy concerns
- Integration complexity with existing systems
- Lack of skilled workforce for implementation and maintenance
Emerging Opportunities in Global Advanced Shopping Technology Market
Emerging opportunities exist in developing economies with expanding e-commerce markets. The integration of advanced technologies into new retail formats, such as micro-fulfillment centers and dark stores, offers significant potential. The development of innovative applications, like AI-powered virtual stylists and augmented reality fitting rooms, can further enhance the customer experience.
Growth Accelerators in the Global Advanced Shopping Technology Market Industry
Long-term growth is fueled by continuous technological advancements, strategic partnerships between technology providers and retailers, and the expansion of advanced shopping technology solutions into new market segments. Government initiatives promoting digital transformation and e-commerce are also crucial catalysts.
Key Players Shaping the Global Advanced Shopping Technology Market Market
- Toshiba Corporation
- Google LLC
- Amazon.com Inc
- Procter & Gamble Company
- Walmart Inc
Notable Milestones in Global Advanced Shopping Technology Market Sector
- June 2021: Toshiba's Self Checkout System 7 launch enhances customer experience and checkout efficiency.
- July 2021: Toshiba Global Commerce Solutions' partnership with Stor.ai strengthens digital commerce solutions for grocers.
In-Depth Global Advanced Shopping Technology Market Market Outlook
The future of the global advanced shopping technology market is bright, with continuous innovation driving significant growth. Strategic partnerships, technological advancements, and expansion into new markets will shape the market landscape in the coming years. The market is poised to experience substantial expansion, offering lucrative opportunities for businesses to innovate and capture market share.
Global Advanced Shopping Technology Market Segmentation
-
1. Product Type
- 1.1. Beacons
- 1.2. Virtual Reality
- 1.3. Smart Shelves
- 1.4. Retail Apps
- 1.5. Social Media and Showrooming
- 1.6. Others
-
2. Application
- 2.1. Retail
- 2.2. Commercial Advertising
- 2.3. Others
Global Advanced Shopping Technology Market Segmentation By Geography
- 1. North America
- 2. Europe
- 3. Asia Pacific
- 4. Latin America
- 5. Middle East and Africa
Global Advanced Shopping Technology Market REPORT HIGHLIGHTS
| Aspects | Details |
|---|---|
| Study Period | 2019-2033 |
| Base Year | 2024 |
| Estimated Year | 2025 |
| Forecast Period | 2025-2033 |
| Historical Period | 2019-2024 |
| Growth Rate | CAGR of 12.30% from 2019-2033 |
| Segmentation |
|
Table of Contents
- 1. Introduction
- 1.1. Research Scope
- 1.2. Market Segmentation
- 1.3. Research Methodology
- 1.4. Definitions and Assumptions
- 2. Executive Summary
- 2.1. Introduction
- 3. Market Dynamics
- 3.1. Introduction
- 3.2. Market Drivers
- 3.2.1. Increasing adoption of advance technology in retail sector; Artificial intelligence and robots in retail stores
- 3.3. Market Restrains
- 3.3.1. High cost of implementation of the technology
- 3.4. Market Trends
- 3.4.1. Increasing Adoption of Virtual Reality in the Retail Sector is Expected to Drive the Market
- 4. Market Factor Analysis
- 4.1. Porters Five Forces
- 4.2. Supply/Value Chain
- 4.3. PESTEL analysis
- 4.4. Market Entropy
- 4.5. Patent/Trademark Analysis
- 5. Global Advanced Shopping Technology Market Analysis, Insights and Forecast, 2019-2031
- 5.1. Market Analysis, Insights and Forecast - by Product Type
- 5.1.1. Beacons
- 5.1.2. Virtual Reality
- 5.1.3. Smart Shelves
- 5.1.4. Retail Apps
- 5.1.5. Social Media and Showrooming
- 5.1.6. Others
- 5.2. Market Analysis, Insights and Forecast - by Application
- 5.2.1. Retail
- 5.2.2. Commercial Advertising
- 5.2.3. Others
- 5.3. Market Analysis, Insights and Forecast - by Region
- 5.3.1. North America
- 5.3.2. Europe
- 5.3.3. Asia Pacific
- 5.3.4. Latin America
- 5.3.5. Middle East and Africa
- 5.1. Market Analysis, Insights and Forecast - by Product Type
- 6. North America Global Advanced Shopping Technology Market Analysis, Insights and Forecast, 2019-2031
- 6.1. Market Analysis, Insights and Forecast - by Product Type
- 6.1.1. Beacons
- 6.1.2. Virtual Reality
- 6.1.3. Smart Shelves
- 6.1.4. Retail Apps
- 6.1.5. Social Media and Showrooming
- 6.1.6. Others
- 6.2. Market Analysis, Insights and Forecast - by Application
- 6.2.1. Retail
- 6.2.2. Commercial Advertising
- 6.2.3. Others
- 6.1. Market Analysis, Insights and Forecast - by Product Type
- 7. Europe Global Advanced Shopping Technology Market Analysis, Insights and Forecast, 2019-2031
- 7.1. Market Analysis, Insights and Forecast - by Product Type
- 7.1.1. Beacons
- 7.1.2. Virtual Reality
- 7.1.3. Smart Shelves
- 7.1.4. Retail Apps
- 7.1.5. Social Media and Showrooming
- 7.1.6. Others
- 7.2. Market Analysis, Insights and Forecast - by Application
- 7.2.1. Retail
- 7.2.2. Commercial Advertising
- 7.2.3. Others
- 7.1. Market Analysis, Insights and Forecast - by Product Type
- 8. Asia Pacific Global Advanced Shopping Technology Market Analysis, Insights and Forecast, 2019-2031
- 8.1. Market Analysis, Insights and Forecast - by Product Type
- 8.1.1. Beacons
- 8.1.2. Virtual Reality
- 8.1.3. Smart Shelves
- 8.1.4. Retail Apps
- 8.1.5. Social Media and Showrooming
- 8.1.6. Others
- 8.2. Market Analysis, Insights and Forecast - by Application
- 8.2.1. Retail
- 8.2.2. Commercial Advertising
- 8.2.3. Others
- 8.1. Market Analysis, Insights and Forecast - by Product Type
- 9. Latin America Global Advanced Shopping Technology Market Analysis, Insights and Forecast, 2019-2031
- 9.1. Market Analysis, Insights and Forecast - by Product Type
- 9.1.1. Beacons
- 9.1.2. Virtual Reality
- 9.1.3. Smart Shelves
- 9.1.4. Retail Apps
- 9.1.5. Social Media and Showrooming
- 9.1.6. Others
- 9.2. Market Analysis, Insights and Forecast - by Application
- 9.2.1. Retail
- 9.2.2. Commercial Advertising
- 9.2.3. Others
- 9.1. Market Analysis, Insights and Forecast - by Product Type
- 10. Middle East and Africa Global Advanced Shopping Technology Market Analysis, Insights and Forecast, 2019-2031
- 10.1. Market Analysis, Insights and Forecast - by Product Type
- 10.1.1. Beacons
- 10.1.2. Virtual Reality
- 10.1.3. Smart Shelves
- 10.1.4. Retail Apps
- 10.1.5. Social Media and Showrooming
- 10.1.6. Others
- 10.2. Market Analysis, Insights and Forecast - by Application
- 10.2.1. Retail
- 10.2.2. Commercial Advertising
- 10.2.3. Others
- 10.1. Market Analysis, Insights and Forecast - by Product Type
- 11. North America Global Advanced Shopping Technology Market Analysis, Insights and Forecast, 2019-2031
- 11.1. Market Analysis, Insights and Forecast - By Country/Sub-region
- 11.1.1 United States
- 11.1.2 Canada
- 11.1.3 Mexico
- 12. Europe Global Advanced Shopping Technology Market Analysis, Insights and Forecast, 2019-2031
- 12.1. Market Analysis, Insights and Forecast - By Country/Sub-region
- 12.1.1 Germany
- 12.1.2 United Kingdom
- 12.1.3 France
- 12.1.4 Spain
- 12.1.5 Italy
- 12.1.6 Spain
- 12.1.7 Belgium
- 12.1.8 Netherland
- 12.1.9 Nordics
- 12.1.10 Rest of Europe
- 13. Asia Pacific Global Advanced Shopping Technology Market Analysis, Insights and Forecast, 2019-2031
- 13.1. Market Analysis, Insights and Forecast - By Country/Sub-region
- 13.1.1 China
- 13.1.2 Japan
- 13.1.3 India
- 13.1.4 South Korea
- 13.1.5 Southeast Asia
- 13.1.6 Australia
- 13.1.7 Indonesia
- 13.1.8 Phillipes
- 13.1.9 Singapore
- 13.1.10 Thailandc
- 13.1.11 Rest of Asia Pacific
- 14. South America Global Advanced Shopping Technology Market Analysis, Insights and Forecast, 2019-2031
- 14.1. Market Analysis, Insights and Forecast - By Country/Sub-region
- 14.1.1 Brazil
- 14.1.2 Argentina
- 14.1.3 Peru
- 14.1.4 Chile
- 14.1.5 Colombia
- 14.1.6 Ecuador
- 14.1.7 Venezuela
- 14.1.8 Rest of South America
- 15. North America Global Advanced Shopping Technology Market Analysis, Insights and Forecast, 2019-2031
- 15.1. Market Analysis, Insights and Forecast - By Country/Sub-region
- 15.1.1 United States
- 15.1.2 Canada
- 15.1.3 Mexico
- 16. MEA Global Advanced Shopping Technology Market Analysis, Insights and Forecast, 2019-2031
- 16.1. Market Analysis, Insights and Forecast - By Country/Sub-region
- 16.1.1 United Arab Emirates
- 16.1.2 Saudi Arabia
- 16.1.3 South Africa
- 16.1.4 Rest of Middle East and Africa
- 17. Competitive Analysis
- 17.1. Market Share Analysis 2024
- 17.2. Company Profiles
- 17.2.1 Toshiba Corporation
- 17.2.1.1. Overview
- 17.2.1.2. Products
- 17.2.1.3. SWOT Analysis
- 17.2.1.4. Recent Developments
- 17.2.1.5. Financials (Based on Availability)
- 17.2.2 Google LLC
- 17.2.2.1. Overview
- 17.2.2.2. Products
- 17.2.2.3. SWOT Analysis
- 17.2.2.4. Recent Developments
- 17.2.2.5. Financials (Based on Availability)
- 17.2.3 Amazon com Inc
- 17.2.3.1. Overview
- 17.2.3.2. Products
- 17.2.3.3. SWOT Analysis
- 17.2.3.4. Recent Developments
- 17.2.3.5. Financials (Based on Availability)
- 17.2.4 Procter & Gamble Company
- 17.2.4.1. Overview
- 17.2.4.2. Products
- 17.2.4.3. SWOT Analysis
- 17.2.4.4. Recent Developments
- 17.2.4.5. Financials (Based on Availability)
- 17.2.5 Walmart Inc
- 17.2.5.1. Overview
- 17.2.5.2. Products
- 17.2.5.3. SWOT Analysis
- 17.2.5.4. Recent Developments
- 17.2.5.5. Financials (Based on Availability)
- 17.2.1 Toshiba Corporation
List of Figures
- Figure 1: Global Global Advanced Shopping Technology Market Revenue Breakdown (Million, %) by Region 2024 & 2032
- Figure 2: Global Global Advanced Shopping Technology Market Volume Breakdown (K Unit, %) by Region 2024 & 2032
- Figure 3: North America Global Advanced Shopping Technology Market Revenue (Million), by Country 2024 & 2032
- Figure 4: North America Global Advanced Shopping Technology Market Volume (K Unit), by Country 2024 & 2032
- Figure 5: North America Global Advanced Shopping Technology Market Revenue Share (%), by Country 2024 & 2032
- Figure 6: North America Global Advanced Shopping Technology Market Volume Share (%), by Country 2024 & 2032
- Figure 7: Europe Global Advanced Shopping Technology Market Revenue (Million), by Country 2024 & 2032
- Figure 8: Europe Global Advanced Shopping Technology Market Volume (K Unit), by Country 2024 & 2032
- Figure 9: Europe Global Advanced Shopping Technology Market Revenue Share (%), by Country 2024 & 2032
- Figure 10: Europe Global Advanced Shopping Technology Market Volume Share (%), by Country 2024 & 2032
- Figure 11: Asia Pacific Global Advanced Shopping Technology Market Revenue (Million), by Country 2024 & 2032
- Figure 12: Asia Pacific Global Advanced Shopping Technology Market Volume (K Unit), by Country 2024 & 2032
- Figure 13: Asia Pacific Global Advanced Shopping Technology Market Revenue Share (%), by Country 2024 & 2032
- Figure 14: Asia Pacific Global Advanced Shopping Technology Market Volume Share (%), by Country 2024 & 2032
- Figure 15: South America Global Advanced Shopping Technology Market Revenue (Million), by Country 2024 & 2032
- Figure 16: South America Global Advanced Shopping Technology Market Volume (K Unit), by Country 2024 & 2032
- Figure 17: South America Global Advanced Shopping Technology Market Revenue Share (%), by Country 2024 & 2032
- Figure 18: South America Global Advanced Shopping Technology Market Volume Share (%), by Country 2024 & 2032
- Figure 19: North America Global Advanced Shopping Technology Market Revenue (Million), by Country 2024 & 2032
- Figure 20: North America Global Advanced Shopping Technology Market Volume (K Unit), by Country 2024 & 2032
- Figure 21: North America Global Advanced Shopping Technology Market Revenue Share (%), by Country 2024 & 2032
- Figure 22: North America Global Advanced Shopping Technology Market Volume Share (%), by Country 2024 & 2032
- Figure 23: MEA Global Advanced Shopping Technology Market Revenue (Million), by Country 2024 & 2032
- Figure 24: MEA Global Advanced Shopping Technology Market Volume (K Unit), by Country 2024 & 2032
- Figure 25: MEA Global Advanced Shopping Technology Market Revenue Share (%), by Country 2024 & 2032
- Figure 26: MEA Global Advanced Shopping Technology Market Volume Share (%), by Country 2024 & 2032
- Figure 27: North America Global Advanced Shopping Technology Market Revenue (Million), by Product Type 2024 & 2032
- Figure 28: North America Global Advanced Shopping Technology Market Volume (K Unit), by Product Type 2024 & 2032
- Figure 29: North America Global Advanced Shopping Technology Market Revenue Share (%), by Product Type 2024 & 2032
- Figure 30: North America Global Advanced Shopping Technology Market Volume Share (%), by Product Type 2024 & 2032
- Figure 31: North America Global Advanced Shopping Technology Market Revenue (Million), by Application 2024 & 2032
- Figure 32: North America Global Advanced Shopping Technology Market Volume (K Unit), by Application 2024 & 2032
- Figure 33: North America Global Advanced Shopping Technology Market Revenue Share (%), by Application 2024 & 2032
- Figure 34: North America Global Advanced Shopping Technology Market Volume Share (%), by Application 2024 & 2032
- Figure 35: North America Global Advanced Shopping Technology Market Revenue (Million), by Country 2024 & 2032
- Figure 36: North America Global Advanced Shopping Technology Market Volume (K Unit), by Country 2024 & 2032
- Figure 37: North America Global Advanced Shopping Technology Market Revenue Share (%), by Country 2024 & 2032
- Figure 38: North America Global Advanced Shopping Technology Market Volume Share (%), by Country 2024 & 2032
- Figure 39: Europe Global Advanced Shopping Technology Market Revenue (Million), by Product Type 2024 & 2032
- Figure 40: Europe Global Advanced Shopping Technology Market Volume (K Unit), by Product Type 2024 & 2032
- Figure 41: Europe Global Advanced Shopping Technology Market Revenue Share (%), by Product Type 2024 & 2032
- Figure 42: Europe Global Advanced Shopping Technology Market Volume Share (%), by Product Type 2024 & 2032
- Figure 43: Europe Global Advanced Shopping Technology Market Revenue (Million), by Application 2024 & 2032
- Figure 44: Europe Global Advanced Shopping Technology Market Volume (K Unit), by Application 2024 & 2032
- Figure 45: Europe Global Advanced Shopping Technology Market Revenue Share (%), by Application 2024 & 2032
- Figure 46: Europe Global Advanced Shopping Technology Market Volume Share (%), by Application 2024 & 2032
- Figure 47: Europe Global Advanced Shopping Technology Market Revenue (Million), by Country 2024 & 2032
- Figure 48: Europe Global Advanced Shopping Technology Market Volume (K Unit), by Country 2024 & 2032
- Figure 49: Europe Global Advanced Shopping Technology Market Revenue Share (%), by Country 2024 & 2032
- Figure 50: Europe Global Advanced Shopping Technology Market Volume Share (%), by Country 2024 & 2032
- Figure 51: Asia Pacific Global Advanced Shopping Technology Market Revenue (Million), by Product Type 2024 & 2032
- Figure 52: Asia Pacific Global Advanced Shopping Technology Market Volume (K Unit), by Product Type 2024 & 2032
- Figure 53: Asia Pacific Global Advanced Shopping Technology Market Revenue Share (%), by Product Type 2024 & 2032
- Figure 54: Asia Pacific Global Advanced Shopping Technology Market Volume Share (%), by Product Type 2024 & 2032
- Figure 55: Asia Pacific Global Advanced Shopping Technology Market Revenue (Million), by Application 2024 & 2032
- Figure 56: Asia Pacific Global Advanced Shopping Technology Market Volume (K Unit), by Application 2024 & 2032
- Figure 57: Asia Pacific Global Advanced Shopping Technology Market Revenue Share (%), by Application 2024 & 2032
- Figure 58: Asia Pacific Global Advanced Shopping Technology Market Volume Share (%), by Application 2024 & 2032
- Figure 59: Asia Pacific Global Advanced Shopping Technology Market Revenue (Million), by Country 2024 & 2032
- Figure 60: Asia Pacific Global Advanced Shopping Technology Market Volume (K Unit), by Country 2024 & 2032
- Figure 61: Asia Pacific Global Advanced Shopping Technology Market Revenue Share (%), by Country 2024 & 2032
- Figure 62: Asia Pacific Global Advanced Shopping Technology Market Volume Share (%), by Country 2024 & 2032
- Figure 63: Latin America Global Advanced Shopping Technology Market Revenue (Million), by Product Type 2024 & 2032
- Figure 64: Latin America Global Advanced Shopping Technology Market Volume (K Unit), by Product Type 2024 & 2032
- Figure 65: Latin America Global Advanced Shopping Technology Market Revenue Share (%), by Product Type 2024 & 2032
- Figure 66: Latin America Global Advanced Shopping Technology Market Volume Share (%), by Product Type 2024 & 2032
- Figure 67: Latin America Global Advanced Shopping Technology Market Revenue (Million), by Application 2024 & 2032
- Figure 68: Latin America Global Advanced Shopping Technology Market Volume (K Unit), by Application 2024 & 2032
- Figure 69: Latin America Global Advanced Shopping Technology Market Revenue Share (%), by Application 2024 & 2032
- Figure 70: Latin America Global Advanced Shopping Technology Market Volume Share (%), by Application 2024 & 2032
- Figure 71: Latin America Global Advanced Shopping Technology Market Revenue (Million), by Country 2024 & 2032
- Figure 72: Latin America Global Advanced Shopping Technology Market Volume (K Unit), by Country 2024 & 2032
- Figure 73: Latin America Global Advanced Shopping Technology Market Revenue Share (%), by Country 2024 & 2032
- Figure 74: Latin America Global Advanced Shopping Technology Market Volume Share (%), by Country 2024 & 2032
- Figure 75: Middle East and Africa Global Advanced Shopping Technology Market Revenue (Million), by Product Type 2024 & 2032
- Figure 76: Middle East and Africa Global Advanced Shopping Technology Market Volume (K Unit), by Product Type 2024 & 2032
- Figure 77: Middle East and Africa Global Advanced Shopping Technology Market Revenue Share (%), by Product Type 2024 & 2032
- Figure 78: Middle East and Africa Global Advanced Shopping Technology Market Volume Share (%), by Product Type 2024 & 2032
- Figure 79: Middle East and Africa Global Advanced Shopping Technology Market Revenue (Million), by Application 2024 & 2032
- Figure 80: Middle East and Africa Global Advanced Shopping Technology Market Volume (K Unit), by Application 2024 & 2032
- Figure 81: Middle East and Africa Global Advanced Shopping Technology Market Revenue Share (%), by Application 2024 & 2032
- Figure 82: Middle East and Africa Global Advanced Shopping Technology Market Volume Share (%), by Application 2024 & 2032
- Figure 83: Middle East and Africa Global Advanced Shopping Technology Market Revenue (Million), by Country 2024 & 2032
- Figure 84: Middle East and Africa Global Advanced Shopping Technology Market Volume (K Unit), by Country 2024 & 2032
- Figure 85: Middle East and Africa Global Advanced Shopping Technology Market Revenue Share (%), by Country 2024 & 2032
- Figure 86: Middle East and Africa Global Advanced Shopping Technology Market Volume Share (%), by Country 2024 & 2032
List of Tables
- Table 1: Global Advanced Shopping Technology Market Revenue Million Forecast, by Region 2019 & 2032
- Table 2: Global Advanced Shopping Technology Market Volume K Unit Forecast, by Region 2019 & 2032
- Table 3: Global Advanced Shopping Technology Market Revenue Million Forecast, by Product Type 2019 & 2032
- Table 4: Global Advanced Shopping Technology Market Volume K Unit Forecast, by Product Type 2019 & 2032
- Table 5: Global Advanced Shopping Technology Market Revenue Million Forecast, by Application 2019 & 2032
- Table 6: Global Advanced Shopping Technology Market Volume K Unit Forecast, by Application 2019 & 2032
- Table 7: Global Advanced Shopping Technology Market Revenue Million Forecast, by Region 2019 & 2032
- Table 8: Global Advanced Shopping Technology Market Volume K Unit Forecast, by Region 2019 & 2032
- Table 9: Global Advanced Shopping Technology Market Revenue Million Forecast, by Country 2019 & 2032
- Table 10: Global Advanced Shopping Technology Market Volume K Unit Forecast, by Country 2019 & 2032
- Table 11: United States Global Advanced Shopping Technology Market Revenue (Million) Forecast, by Application 2019 & 2032
- Table 12: United States Global Advanced Shopping Technology Market Volume (K Unit) Forecast, by Application 2019 & 2032
- Table 13: Canada Global Advanced Shopping Technology Market Revenue (Million) Forecast, by Application 2019 & 2032
- Table 14: Canada Global Advanced Shopping Technology Market Volume (K Unit) Forecast, by Application 2019 & 2032
- Table 15: Mexico Global Advanced Shopping Technology Market Revenue (Million) Forecast, by Application 2019 & 2032
- Table 16: Mexico Global Advanced Shopping Technology Market Volume (K Unit) Forecast, by Application 2019 & 2032
- Table 17: Global Advanced Shopping Technology Market Revenue Million Forecast, by Country 2019 & 2032
- Table 18: Global Advanced Shopping Technology Market Volume K Unit Forecast, by Country 2019 & 2032
- Table 19: Germany Global Advanced Shopping Technology Market Revenue (Million) Forecast, by Application 2019 & 2032
- Table 20: Germany Global Advanced Shopping Technology Market Volume (K Unit) Forecast, by Application 2019 & 2032
- Table 21: United Kingdom Global Advanced Shopping Technology Market Revenue (Million) Forecast, by Application 2019 & 2032
- Table 22: United Kingdom Global Advanced Shopping Technology Market Volume (K Unit) Forecast, by Application 2019 & 2032
- Table 23: France Global Advanced Shopping Technology Market Revenue (Million) Forecast, by Application 2019 & 2032
- Table 24: France Global Advanced Shopping Technology Market Volume (K Unit) Forecast, by Application 2019 & 2032
- Table 25: Spain Global Advanced Shopping Technology Market Revenue (Million) Forecast, by Application 2019 & 2032
- Table 26: Spain Global Advanced Shopping Technology Market Volume (K Unit) Forecast, by Application 2019 & 2032
- Table 27: Italy Global Advanced Shopping Technology Market Revenue (Million) Forecast, by Application 2019 & 2032
- Table 28: Italy Global Advanced Shopping Technology Market Volume (K Unit) Forecast, by Application 2019 & 2032
- Table 29: Spain Global Advanced Shopping Technology Market Revenue (Million) Forecast, by Application 2019 & 2032
- Table 30: Spain Global Advanced Shopping Technology Market Volume (K Unit) Forecast, by Application 2019 & 2032
- Table 31: Belgium Global Advanced Shopping Technology Market Revenue (Million) Forecast, by Application 2019 & 2032
- Table 32: Belgium Global Advanced Shopping Technology Market Volume (K Unit) Forecast, by Application 2019 & 2032
- Table 33: Netherland Global Advanced Shopping Technology Market Revenue (Million) Forecast, by Application 2019 & 2032
- Table 34: Netherland Global Advanced Shopping Technology Market Volume (K Unit) Forecast, by Application 2019 & 2032
- Table 35: Nordics Global Advanced Shopping Technology Market Revenue (Million) Forecast, by Application 2019 & 2032
- Table 36: Nordics Global Advanced Shopping Technology Market Volume (K Unit) Forecast, by Application 2019 & 2032
- Table 37: Rest of Europe Global Advanced Shopping Technology Market Revenue (Million) Forecast, by Application 2019 & 2032
- Table 38: Rest of Europe Global Advanced Shopping Technology Market Volume (K Unit) Forecast, by Application 2019 & 2032
- Table 39: Global Advanced Shopping Technology Market Revenue Million Forecast, by Country 2019 & 2032
- Table 40: Global Advanced Shopping Technology Market Volume K Unit Forecast, by Country 2019 & 2032
- Table 41: China Global Advanced Shopping Technology Market Revenue (Million) Forecast, by Application 2019 & 2032
- Table 42: China Global Advanced Shopping Technology Market Volume (K Unit) Forecast, by Application 2019 & 2032
- Table 43: Japan Global Advanced Shopping Technology Market Revenue (Million) Forecast, by Application 2019 & 2032
- Table 44: Japan Global Advanced Shopping Technology Market Volume (K Unit) Forecast, by Application 2019 & 2032
- Table 45: India Global Advanced Shopping Technology Market Revenue (Million) Forecast, by Application 2019 & 2032
- Table 46: India Global Advanced Shopping Technology Market Volume (K Unit) Forecast, by Application 2019 & 2032
- Table 47: South Korea Global Advanced Shopping Technology Market Revenue (Million) Forecast, by Application 2019 & 2032
- Table 48: South Korea Global Advanced Shopping Technology Market Volume (K Unit) Forecast, by Application 2019 & 2032
- Table 49: Southeast Asia Global Advanced Shopping Technology Market Revenue (Million) Forecast, by Application 2019 & 2032
- Table 50: Southeast Asia Global Advanced Shopping Technology Market Volume (K Unit) Forecast, by Application 2019 & 2032
- Table 51: Australia Global Advanced Shopping Technology Market Revenue (Million) Forecast, by Application 2019 & 2032
- Table 52: Australia Global Advanced Shopping Technology Market Volume (K Unit) Forecast, by Application 2019 & 2032
- Table 53: Indonesia Global Advanced Shopping Technology Market Revenue (Million) Forecast, by Application 2019 & 2032
- Table 54: Indonesia Global Advanced Shopping Technology Market Volume (K Unit) Forecast, by Application 2019 & 2032
- Table 55: Phillipes Global Advanced Shopping Technology Market Revenue (Million) Forecast, by Application 2019 & 2032
- Table 56: Phillipes Global Advanced Shopping Technology Market Volume (K Unit) Forecast, by Application 2019 & 2032
- Table 57: Singapore Global Advanced Shopping Technology Market Revenue (Million) Forecast, by Application 2019 & 2032
- Table 58: Singapore Global Advanced Shopping Technology Market Volume (K Unit) Forecast, by Application 2019 & 2032
- Table 59: Thailandc Global Advanced Shopping Technology Market Revenue (Million) Forecast, by Application 2019 & 2032
- Table 60: Thailandc Global Advanced Shopping Technology Market Volume (K Unit) Forecast, by Application 2019 & 2032
- Table 61: Rest of Asia Pacific Global Advanced Shopping Technology Market Revenue (Million) Forecast, by Application 2019 & 2032
- Table 62: Rest of Asia Pacific Global Advanced Shopping Technology Market Volume (K Unit) Forecast, by Application 2019 & 2032
- Table 63: Global Advanced Shopping Technology Market Revenue Million Forecast, by Country 2019 & 2032
- Table 64: Global Advanced Shopping Technology Market Volume K Unit Forecast, by Country 2019 & 2032
- Table 65: Brazil Global Advanced Shopping Technology Market Revenue (Million) Forecast, by Application 2019 & 2032
- Table 66: Brazil Global Advanced Shopping Technology Market Volume (K Unit) Forecast, by Application 2019 & 2032
- Table 67: Argentina Global Advanced Shopping Technology Market Revenue (Million) Forecast, by Application 2019 & 2032
- Table 68: Argentina Global Advanced Shopping Technology Market Volume (K Unit) Forecast, by Application 2019 & 2032
- Table 69: Peru Global Advanced Shopping Technology Market Revenue (Million) Forecast, by Application 2019 & 2032
- Table 70: Peru Global Advanced Shopping Technology Market Volume (K Unit) Forecast, by Application 2019 & 2032
- Table 71: Chile Global Advanced Shopping Technology Market Revenue (Million) Forecast, by Application 2019 & 2032
- Table 72: Chile Global Advanced Shopping Technology Market Volume (K Unit) Forecast, by Application 2019 & 2032
- Table 73: Colombia Global Advanced Shopping Technology Market Revenue (Million) Forecast, by Application 2019 & 2032
- Table 74: Colombia Global Advanced Shopping Technology Market Volume (K Unit) Forecast, by Application 2019 & 2032
- Table 75: Ecuador Global Advanced Shopping Technology Market Revenue (Million) Forecast, by Application 2019 & 2032
- Table 76: Ecuador Global Advanced Shopping Technology Market Volume (K Unit) Forecast, by Application 2019 & 2032
- Table 77: Venezuela Global Advanced Shopping Technology Market Revenue (Million) Forecast, by Application 2019 & 2032
- Table 78: Venezuela Global Advanced Shopping Technology Market Volume (K Unit) Forecast, by Application 2019 & 2032
- Table 79: Rest of South America Global Advanced Shopping Technology Market Revenue (Million) Forecast, by Application 2019 & 2032
- Table 80: Rest of South America Global Advanced Shopping Technology Market Volume (K Unit) Forecast, by Application 2019 & 2032
- Table 81: Global Advanced Shopping Technology Market Revenue Million Forecast, by Country 2019 & 2032
- Table 82: Global Advanced Shopping Technology Market Volume K Unit Forecast, by Country 2019 & 2032
- Table 83: United States Global Advanced Shopping Technology Market Revenue (Million) Forecast, by Application 2019 & 2032
- Table 84: United States Global Advanced Shopping Technology Market Volume (K Unit) Forecast, by Application 2019 & 2032
- Table 85: Canada Global Advanced Shopping Technology Market Revenue (Million) Forecast, by Application 2019 & 2032
- Table 86: Canada Global Advanced Shopping Technology Market Volume (K Unit) Forecast, by Application 2019 & 2032
- Table 87: Mexico Global Advanced Shopping Technology Market Revenue (Million) Forecast, by Application 2019 & 2032
- Table 88: Mexico Global Advanced Shopping Technology Market Volume (K Unit) Forecast, by Application 2019 & 2032
- Table 89: Global Advanced Shopping Technology Market Revenue Million Forecast, by Country 2019 & 2032
- Table 90: Global Advanced Shopping Technology Market Volume K Unit Forecast, by Country 2019 & 2032
- Table 91: United Arab Emirates Global Advanced Shopping Technology Market Revenue (Million) Forecast, by Application 2019 & 2032
- Table 92: United Arab Emirates Global Advanced Shopping Technology Market Volume (K Unit) Forecast, by Application 2019 & 2032
- Table 93: Saudi Arabia Global Advanced Shopping Technology Market Revenue (Million) Forecast, by Application 2019 & 2032
- Table 94: Saudi Arabia Global Advanced Shopping Technology Market Volume (K Unit) Forecast, by Application 2019 & 2032
- Table 95: South Africa Global Advanced Shopping Technology Market Revenue (Million) Forecast, by Application 2019 & 2032
- Table 96: South Africa Global Advanced Shopping Technology Market Volume (K Unit) Forecast, by Application 2019 & 2032
- Table 97: Rest of Middle East and Africa Global Advanced Shopping Technology Market Revenue (Million) Forecast, by Application 2019 & 2032
- Table 98: Rest of Middle East and Africa Global Advanced Shopping Technology Market Volume (K Unit) Forecast, by Application 2019 & 2032
- Table 99: Global Advanced Shopping Technology Market Revenue Million Forecast, by Product Type 2019 & 2032
- Table 100: Global Advanced Shopping Technology Market Volume K Unit Forecast, by Product Type 2019 & 2032
- Table 101: Global Advanced Shopping Technology Market Revenue Million Forecast, by Application 2019 & 2032
- Table 102: Global Advanced Shopping Technology Market Volume K Unit Forecast, by Application 2019 & 2032
- Table 103: Global Advanced Shopping Technology Market Revenue Million Forecast, by Country 2019 & 2032
- Table 104: Global Advanced Shopping Technology Market Volume K Unit Forecast, by Country 2019 & 2032
- Table 105: Global Advanced Shopping Technology Market Revenue Million Forecast, by Product Type 2019 & 2032
- Table 106: Global Advanced Shopping Technology Market Volume K Unit Forecast, by Product Type 2019 & 2032
- Table 107: Global Advanced Shopping Technology Market Revenue Million Forecast, by Application 2019 & 2032
- Table 108: Global Advanced Shopping Technology Market Volume K Unit Forecast, by Application 2019 & 2032
- Table 109: Global Advanced Shopping Technology Market Revenue Million Forecast, by Country 2019 & 2032
- Table 110: Global Advanced Shopping Technology Market Volume K Unit Forecast, by Country 2019 & 2032
- Table 111: Global Advanced Shopping Technology Market Revenue Million Forecast, by Product Type 2019 & 2032
- Table 112: Global Advanced Shopping Technology Market Volume K Unit Forecast, by Product Type 2019 & 2032
- Table 113: Global Advanced Shopping Technology Market Revenue Million Forecast, by Application 2019 & 2032
- Table 114: Global Advanced Shopping Technology Market Volume K Unit Forecast, by Application 2019 & 2032
- Table 115: Global Advanced Shopping Technology Market Revenue Million Forecast, by Country 2019 & 2032
- Table 116: Global Advanced Shopping Technology Market Volume K Unit Forecast, by Country 2019 & 2032
- Table 117: Global Advanced Shopping Technology Market Revenue Million Forecast, by Product Type 2019 & 2032
- Table 118: Global Advanced Shopping Technology Market Volume K Unit Forecast, by Product Type 2019 & 2032
- Table 119: Global Advanced Shopping Technology Market Revenue Million Forecast, by Application 2019 & 2032
- Table 120: Global Advanced Shopping Technology Market Volume K Unit Forecast, by Application 2019 & 2032
- Table 121: Global Advanced Shopping Technology Market Revenue Million Forecast, by Country 2019 & 2032
- Table 122: Global Advanced Shopping Technology Market Volume K Unit Forecast, by Country 2019 & 2032
- Table 123: Global Advanced Shopping Technology Market Revenue Million Forecast, by Product Type 2019 & 2032
- Table 124: Global Advanced Shopping Technology Market Volume K Unit Forecast, by Product Type 2019 & 2032
- Table 125: Global Advanced Shopping Technology Market Revenue Million Forecast, by Application 2019 & 2032
- Table 126: Global Advanced Shopping Technology Market Volume K Unit Forecast, by Application 2019 & 2032
- Table 127: Global Advanced Shopping Technology Market Revenue Million Forecast, by Country 2019 & 2032
- Table 128: Global Advanced Shopping Technology Market Volume K Unit Forecast, by Country 2019 & 2032
Frequently Asked Questions
1. What is the projected Compound Annual Growth Rate (CAGR) of the Global Advanced Shopping Technology Market?
The projected CAGR is approximately 12.30%.
2. Which companies are prominent players in the Global Advanced Shopping Technology Market?
Key companies in the market include Toshiba Corporation, Google LLC, Amazon com Inc, Procter & Gamble Company, Walmart Inc.
3. What are the main segments of the Global Advanced Shopping Technology Market?
The market segments include Product Type, Application.
4. Can you provide details about the market size?
The market size is estimated to be USD XX Million as of 2022.
5. What are some drivers contributing to market growth?
Increasing adoption of advance technology in retail sector; Artificial intelligence and robots in retail stores.
6. What are the notable trends driving market growth?
Increasing Adoption of Virtual Reality in the Retail Sector is Expected to Drive the Market.
7. Are there any restraints impacting market growth?
High cost of implementation of the technology.
8. Can you provide examples of recent developments in the market?
June 2021: Toshiba's Self Checkout System 7 solution, developed by Toshiba Global Commerce Solutions and Calimax, provides fast, convenient, and frictionless checkout experiences. Calimax and Toshiba are designing the checkout experiences that shoppers want, thanks to user input and a collaborative approach, resulting in more checkout alternatives for customers and more sales.
9. What pricing options are available for accessing the report?
Pricing options include single-user, multi-user, and enterprise licenses priced at USD 4750, USD 5250, and USD 8750 respectively.
10. Is the market size provided in terms of value or volume?
The market size is provided in terms of value, measured in Million and volume, measured in K Unit.
11. Are there any specific market keywords associated with the report?
Yes, the market keyword associated with the report is "Global Advanced Shopping Technology Market," which aids in identifying and referencing the specific market segment covered.
12. How do I determine which pricing option suits my needs best?
The pricing options vary based on user requirements and access needs. Individual users may opt for single-user licenses, while businesses requiring broader access may choose multi-user or enterprise licenses for cost-effective access to the report.
13. Are there any additional resources or data provided in the Global Advanced Shopping Technology Market report?
While the report offers comprehensive insights, it's advisable to review the specific contents or supplementary materials provided to ascertain if additional resources or data are available.
14. How can I stay updated on further developments or reports in the Global Advanced Shopping Technology Market?
To stay informed about further developments, trends, and reports in the Global Advanced Shopping Technology Market, consider subscribing to industry newsletters, following relevant companies and organizations, or regularly checking reputable industry news sources and publications.
Methodology
Step 1 - Identification of Relevant Samples Size from Population Database


Step 2 - Approaches for Defining Global Market Size (Value, Volume* & Price*)

Note*: In applicable scenarios
Step 3 - Data Sources
Primary Research
- Web Analytics
- Survey Reports
- Research Institute
- Latest Research Reports
- Opinion Leaders
Secondary Research
- Annual Reports
- White Paper
- Latest Press Release
- Industry Association
- Paid Database
- Investor Presentations

Step 4 - Data Triangulation
Involves using different sources of information in order to increase the validity of a study
These sources are likely to be stakeholders in a program - participants, other researchers, program staff, other community members, and so on.
Then we put all data in single framework & apply various statistical tools to find out the dynamic on the market.
During the analysis stage, feedback from the stakeholder groups would be compared to determine areas of agreement as well as areas of divergence


