
Key Insights
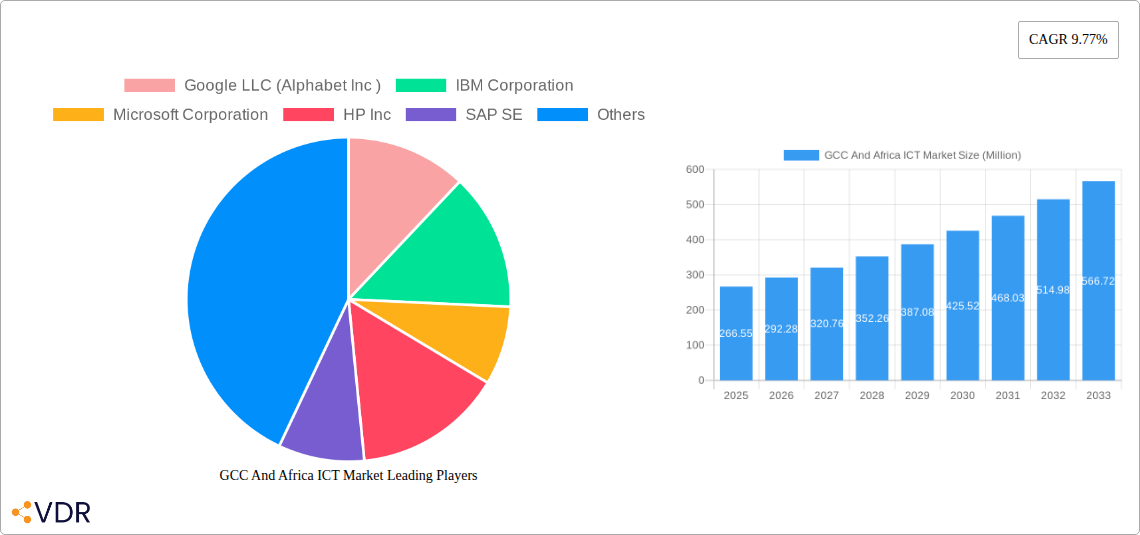
The GCC and Africa ICT market exhibits robust growth potential, projected to reach \$266.55 million in 2025 and maintain a Compound Annual Growth Rate (CAGR) of 9.77% from 2025 to 2033. This expansion is fueled by several key drivers. Increased government investment in digital infrastructure across both regions is a major catalyst, particularly in initiatives aimed at improving broadband access and fostering digital literacy. Furthermore, the rapid adoption of mobile technologies, particularly smartphones, is driving demand for data services and mobile applications. The burgeoning FinTech sector, with its reliance on robust ICT infrastructure, is another significant contributor to market growth. Finally, the increasing adoption of cloud computing services by businesses of all sizes is further propelling market expansion. The market is segmented by various service types (telecommunications, IT services, software, etc.), with telecommunications currently holding a significant share. However, growth is expected across all segments driven by the trends mentioned above.
Despite these positive factors, challenges remain. Digital literacy gaps, particularly in rural areas of Africa, hinder widespread ICT adoption. Furthermore, regulatory hurdles and a lack of standardized infrastructure across some regions can slow down overall growth. Cybersecurity concerns also pose a significant challenge, demanding robust solutions and increased awareness to protect sensitive data. Major players like Google, IBM, Microsoft, and regional telecommunication giants are heavily invested in the market, competing fiercely to capture market share. Their strategies focus on expanding network coverage, enhancing service offerings, and developing localized solutions to meet the specific needs of each region. The competitive landscape is intense, but the overall potential of this market remains significant, promising substantial returns for investors and stakeholders.
GCC and Africa ICT Market: A Comprehensive Market Report (2019-2033)
This comprehensive report provides an in-depth analysis of the GCC and Africa ICT market, covering market dynamics, growth trends, key players, and future outlook. With a study period spanning 2019-2033, a base year of 2025, and a forecast period of 2025-2033, this report is an essential resource for industry professionals, investors, and strategic decision-makers. The report analyzes the parent market of ICT and delves into specific child markets, providing granular insights into market segmentation and growth potential. The market is valued at xx Million in 2025 and is projected to reach xx Million by 2033.
GCC And Africa ICT Market Market Dynamics & Structure
This section analyzes the competitive landscape, technological advancements, and regulatory influences shaping the GCC and Africa ICT market. The market exhibits a moderately concentrated structure, with several global and regional players vying for market share. Technological innovation, particularly in 5G, cloud computing, and AI, is a primary growth driver. However, regulatory frameworks vary across different GCC and African countries, posing both opportunities and challenges. The existence of competitive product substitutes, such as traditional communication methods, also influences market growth. End-user demographics are diverse, ranging from individual consumers to large enterprises across multiple sectors, including government, finance, and telecoms.
- Market Concentration: The market is characterized by a combination of global giants and regional players, resulting in a moderately concentrated structure. The top 5 players hold approximately xx% market share in 2025.
- Technological Innovation: 5G deployment, cloud adoption, and the rise of AI/ML are significant drivers of market growth. Innovation barriers include limited infrastructure in certain regions and digital literacy gaps.
- Regulatory Frameworks: Varying regulatory landscapes across the GCC and African countries impact market entry and operation. Harmonization efforts are underway but pose challenges.
- Competitive Product Substitutes: Traditional communication methods and legacy systems present competition, although digital transformation is driving adoption of ICT solutions.
- End-User Demographics: The market caters to diverse end-users, including individuals, SMEs, and large enterprises across various industries. The increasing adoption rate among SMEs signifies high growth potential.
- M&A Trends: The ICT sector has witnessed xx M&A deals in the historical period (2019-2024), with a projected xx deals in the forecast period (2025-2033), indicating ongoing consolidation.
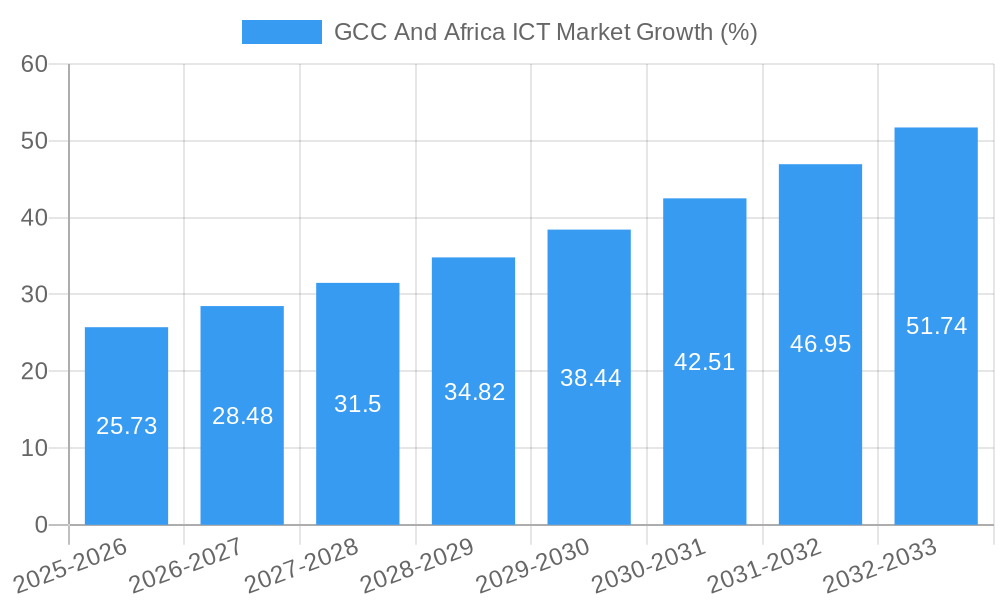
GCC And Africa ICT Market Growth Trends & Insights
The GCC and Africa ICT market has experienced robust growth in recent years, driven by increasing internet penetration, rising smartphone adoption, and government initiatives promoting digital transformation. The market size has grown from xx Million in 2019 to xx Million in 2024, exhibiting a Compound Annual Growth Rate (CAGR) of xx%. Technological disruptions, such as the widespread adoption of cloud computing and the emergence of 5G networks, are further accelerating market expansion. Consumer behavior is shifting towards increased reliance on digital services and mobile solutions, boosting demand for ICT products and services. Market penetration is also expected to increase steadily, reaching xx% by 2033, fuelled by ongoing infrastructure development and decreasing costs.
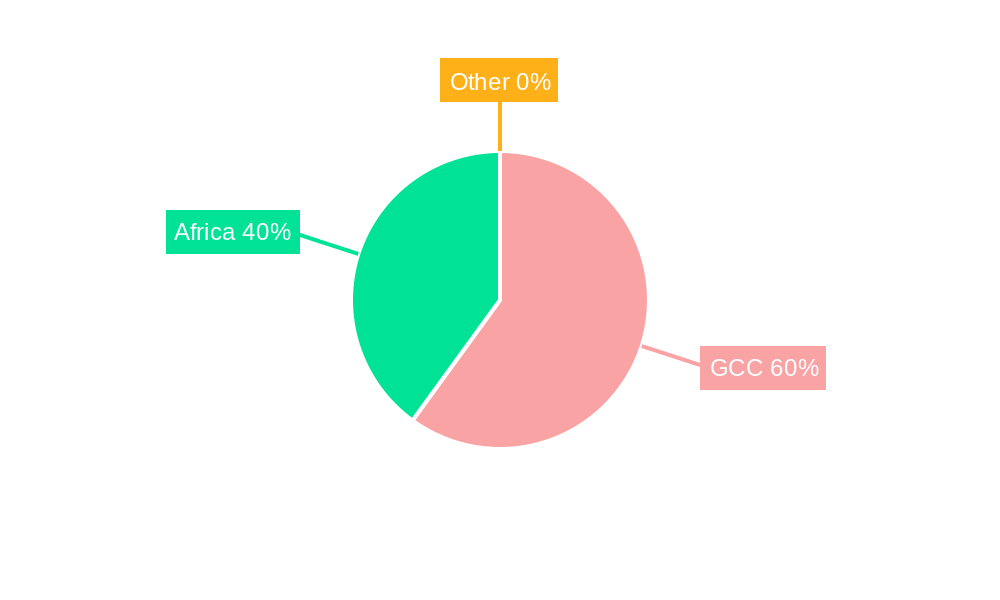
Dominant Regions, Countries, or Segments in GCC And Africa ICT Market
The UAE and South Africa currently lead the GCC and Africa ICT market. The UAE boasts advanced infrastructure and a thriving entrepreneurial ecosystem, attracting significant investments in ICT. South Africa, the largest economy in Africa, serves as a major hub for ICT services and technological innovation within the continent. Specific growth drivers for each region include favorable government policies, investments in infrastructure, and the expansion of digital services across diverse sectors.
- UAE: Strong government support for digital transformation, advanced infrastructure, and a strategic location.
- South Africa: Largest economy in Africa, substantial ICT infrastructure, and a growing tech talent pool.
- Nigeria: Largest population in Africa presents significant market potential, despite infrastructural challenges.
- Saudi Arabia: High levels of government investment in Vision 2030 initiatives are driving growth.
- Kenya: Rapid mobile money adoption and increasing internet penetration fuels growth.
GCC And Africa ICT Market Product Landscape
The GCC and Africa ICT market offers a diverse range of products and services, including hardware (computers, servers, networking equipment), software (enterprise resource planning (ERP), customer relationship management (CRM)), telecommunications (mobile services, broadband internet), and IT services (cloud computing, cybersecurity). Product innovation focuses on improving efficiency, scalability, and security. Key advancements include the integration of AI/ML capabilities, enhanced cybersecurity features, and the development of tailored solutions for specific industries.
Key Drivers, Barriers & Challenges in GCC And Africa ICT Market
Key Drivers:
- Increased government spending on digital infrastructure.
- Rising internet and mobile penetration.
- Growing adoption of cloud computing and 5G technologies.
- Expanding digital services across various sectors.
Key Challenges & Restraints:
- Infrastructure limitations in certain regions.
- Cybersecurity threats and data privacy concerns.
- Skill gaps and limited digital literacy.
- Regulatory inconsistencies across different countries.
- xx Million loss due to supply chain disruptions in 2024.
Emerging Opportunities in GCC And Africa ICT Market
- Expansion into underserved markets: Reaching rural and remote areas with affordable ICT solutions.
- Development of innovative applications: Leveraging AI, IoT, and blockchain technologies for new services.
- Focus on sustainability: Developing energy-efficient and environmentally friendly ICT solutions.
Growth Accelerators in the GCC And Africa ICT Market Industry
Significant long-term growth is projected due to accelerating digital transformation across all sectors, strategic partnerships between global and regional players, continuous technological advancements and infrastructure improvements, and proactive government initiatives promoting digital economies.
Key Players Shaping the GCC And Africa ICT Market Market
- Google LLC (Alphabet Inc)
- IBM Corporation
- Microsoft Corporation
- HP Inc
- SAP SE
- Etisalat (Emirates Telecommunication Group Company PJSC)
- Oracle Corporation
- Salesforce Inc
- Accenture PLC
- Amazon Web Services Inc (AWS)
- Cisco Systems Inc
- Huawei Investment & Holding Co Ltd
- Wipro Limited
- Tata Consultancy Services Limited
- Gijima Group Pty Lt
Notable Milestones in GCC And Africa ICT Market Sector
- November 2023: The Sharjah Electricity, Water, and Gas Authority (SEWA) successfully implemented a digital overhaul using SAP SE solutions, enhancing operational efficiency and customer service.
- August 2024: Liquid Intelligent Technologies partnered with Globalstar to introduce cutting-edge 5G solutions across Africa, the Middle East, and the Gulf, significantly boosting connectivity.
In-Depth GCC And Africa ICT Market Market Outlook
The GCC and Africa ICT market is poised for sustained growth, driven by ongoing technological advancements, increased investment in infrastructure, and supportive government policies. Strategic partnerships, the expansion of digital services, and the adoption of innovative technologies will create significant opportunities for market players. The market's future potential is substantial, with continued expansion across various segments and regions.
GCC And Africa ICT Market Segmentation
-
1. Market Drivers
- 1.1. Ongoing Events and Tourism Demanding Automation
- 1.2. Government Policies and PPP Initiatives
- 1.3. Rising Digital Transformation in the Industries
-
2. Market Restraints
- 2.1. High Dep
- 2.2. Heavy Dependence on the Oil and Gas Sector
- 3. Key Use Cases
- 4. Government Projects and Initiatives
- 5. Ecosystem Analysis
-
6. Technology
- 6.1. Big Data Analytics
- 6.2. Mobility and Telecom
- 6.3. Cloud Computing
- 6.4. Storage
- 6.5. Business Process Outsourcing
- 6.6. Other Technologies
-
7. Component
- 7.1. Hardware/Devices
- 7.2. Software and Services
- 7.3. Communication and Connectivity
-
8. End-user Industry
- 8.1. Oil, Gas, and Utilities
- 8.2. Travel and Hospitality
- 8.3. Healthcare
- 8.4. Financial Services
- 8.5. Manufacturing and Construction
- 8.6. Other End-user Industries
GCC And Africa ICT Market Segmentation By Geography
-
1. North America
- 1.1. United States
- 1.2. Canada
- 1.3. Mexico
-
2. South America
- 2.1. Brazil
- 2.2. Argentina
- 2.3. Rest of South America
-
3. Europe
- 3.1. United Kingdom
- 3.2. Germany
- 3.3. France
- 3.4. Italy
- 3.5. Spain
- 3.6. Russia
- 3.7. Benelux
- 3.8. Nordics
- 3.9. Rest of Europe
-
4. Middle East & Africa
- 4.1. Turkey
- 4.2. Israel
- 4.3. GCC
- 4.4. North Africa
- 4.5. South Africa
- 4.6. Rest of Middle East & Africa
-
5. Asia Pacific
- 5.1. China
- 5.2. India
- 5.3. Japan
- 5.4. South Korea
- 5.5. ASEAN
- 5.6. Oceania
- 5.7. Rest of Asia Pacific
GCC And Africa ICT Market REPORT HIGHLIGHTS
| Aspects | Details |
|---|---|
| Study Period | 2019-2033 |
| Base Year | 2024 |
| Estimated Year | 2025 |
| Forecast Period | 2025-2033 |
| Historical Period | 2019-2024 |
| Growth Rate | CAGR of 9.77% from 2019-2033 |
| Segmentation |
|
Table of Contents
- 1. Introduction
- 1.1. Research Scope
- 1.2. Market Segmentation
- 1.3. Research Methodology
- 1.4. Definitions and Assumptions
- 2. Executive Summary
- 2.1. Introduction
- 3. Market Dynamics
- 3.1. Introduction
- 3.2. Market Drivers
- 3.2.1. Ongoing Events and Tourism Demanding Automation; Government Policies and PPP Initiatives; Rising Digital Transformation in the Industries
- 3.3. Market Restrains
- 3.3.1. Ongoing Events and Tourism Demanding Automation; Government Policies and PPP Initiatives; Rising Digital Transformation in the Industries
- 3.4. Market Trends
- 3.4.1. Mobility and Telecom to be the Largest Technology Segment
- 4. Market Factor Analysis
- 4.1. Porters Five Forces
- 4.2. Supply/Value Chain
- 4.3. PESTEL analysis
- 4.4. Market Entropy
- 4.5. Patent/Trademark Analysis
- 5. Global GCC And Africa ICT Market Analysis, Insights and Forecast, 2019-2031
- 5.1. Market Analysis, Insights and Forecast - by Market Drivers
- 5.1.1. Ongoing Events and Tourism Demanding Automation
- 5.1.2. Government Policies and PPP Initiatives
- 5.1.3. Rising Digital Transformation in the Industries
- 5.2. Market Analysis, Insights and Forecast - by Market Restraints
- 5.2.1. High Dep
- 5.2.2. Heavy Dependence on the Oil and Gas Sector
- 5.3. Market Analysis, Insights and Forecast - by Key Use Cases
- 5.4. Market Analysis, Insights and Forecast - by Government Projects and Initiatives
- 5.5. Market Analysis, Insights and Forecast - by Ecosystem Analysis
- 5.6. Market Analysis, Insights and Forecast - by Technology
- 5.6.1. Big Data Analytics
- 5.6.2. Mobility and Telecom
- 5.6.3. Cloud Computing
- 5.6.4. Storage
- 5.6.5. Business Process Outsourcing
- 5.6.6. Other Technologies
- 5.7. Market Analysis, Insights and Forecast - by Component
- 5.7.1. Hardware/Devices
- 5.7.2. Software and Services
- 5.7.3. Communication and Connectivity
- 5.8. Market Analysis, Insights and Forecast - by End-user Industry
- 5.8.1. Oil, Gas, and Utilities
- 5.8.2. Travel and Hospitality
- 5.8.3. Healthcare
- 5.8.4. Financial Services
- 5.8.5. Manufacturing and Construction
- 5.8.6. Other End-user Industries
- 5.9. Market Analysis, Insights and Forecast - by Region
- 5.9.1. North America
- 5.9.2. South America
- 5.9.3. Europe
- 5.9.4. Middle East & Africa
- 5.9.5. Asia Pacific
- 5.1. Market Analysis, Insights and Forecast - by Market Drivers
- 6. North America GCC And Africa ICT Market Analysis, Insights and Forecast, 2019-2031
- 6.1. Market Analysis, Insights and Forecast - by Market Drivers
- 6.1.1. Ongoing Events and Tourism Demanding Automation
- 6.1.2. Government Policies and PPP Initiatives
- 6.1.3. Rising Digital Transformation in the Industries
- 6.2. Market Analysis, Insights and Forecast - by Market Restraints
- 6.2.1. High Dep
- 6.2.2. Heavy Dependence on the Oil and Gas Sector
- 6.3. Market Analysis, Insights and Forecast - by Key Use Cases
- 6.4. Market Analysis, Insights and Forecast - by Government Projects and Initiatives
- 6.5. Market Analysis, Insights and Forecast - by Ecosystem Analysis
- 6.6. Market Analysis, Insights and Forecast - by Technology
- 6.6.1. Big Data Analytics
- 6.6.2. Mobility and Telecom
- 6.6.3. Cloud Computing
- 6.6.4. Storage
- 6.6.5. Business Process Outsourcing
- 6.6.6. Other Technologies
- 6.7. Market Analysis, Insights and Forecast - by Component
- 6.7.1. Hardware/Devices
- 6.7.2. Software and Services
- 6.7.3. Communication and Connectivity
- 6.8. Market Analysis, Insights and Forecast - by End-user Industry
- 6.8.1. Oil, Gas, and Utilities
- 6.8.2. Travel and Hospitality
- 6.8.3. Healthcare
- 6.8.4. Financial Services
- 6.8.5. Manufacturing and Construction
- 6.8.6. Other End-user Industries
- 6.1. Market Analysis, Insights and Forecast - by Market Drivers
- 7. South America GCC And Africa ICT Market Analysis, Insights and Forecast, 2019-2031
- 7.1. Market Analysis, Insights and Forecast - by Market Drivers
- 7.1.1. Ongoing Events and Tourism Demanding Automation
- 7.1.2. Government Policies and PPP Initiatives
- 7.1.3. Rising Digital Transformation in the Industries
- 7.2. Market Analysis, Insights and Forecast - by Market Restraints
- 7.2.1. High Dep
- 7.2.2. Heavy Dependence on the Oil and Gas Sector
- 7.3. Market Analysis, Insights and Forecast - by Key Use Cases
- 7.4. Market Analysis, Insights and Forecast - by Government Projects and Initiatives
- 7.5. Market Analysis, Insights and Forecast - by Ecosystem Analysis
- 7.6. Market Analysis, Insights and Forecast - by Technology
- 7.6.1. Big Data Analytics
- 7.6.2. Mobility and Telecom
- 7.6.3. Cloud Computing
- 7.6.4. Storage
- 7.6.5. Business Process Outsourcing
- 7.6.6. Other Technologies
- 7.7. Market Analysis, Insights and Forecast - by Component
- 7.7.1. Hardware/Devices
- 7.7.2. Software and Services
- 7.7.3. Communication and Connectivity
- 7.8. Market Analysis, Insights and Forecast - by End-user Industry
- 7.8.1. Oil, Gas, and Utilities
- 7.8.2. Travel and Hospitality
- 7.8.3. Healthcare
- 7.8.4. Financial Services
- 7.8.5. Manufacturing and Construction
- 7.8.6. Other End-user Industries
- 7.1. Market Analysis, Insights and Forecast - by Market Drivers
- 8. Europe GCC And Africa ICT Market Analysis, Insights and Forecast, 2019-2031
- 8.1. Market Analysis, Insights and Forecast - by Market Drivers
- 8.1.1. Ongoing Events and Tourism Demanding Automation
- 8.1.2. Government Policies and PPP Initiatives
- 8.1.3. Rising Digital Transformation in the Industries
- 8.2. Market Analysis, Insights and Forecast - by Market Restraints
- 8.2.1. High Dep
- 8.2.2. Heavy Dependence on the Oil and Gas Sector
- 8.3. Market Analysis, Insights and Forecast - by Key Use Cases
- 8.4. Market Analysis, Insights and Forecast - by Government Projects and Initiatives
- 8.5. Market Analysis, Insights and Forecast - by Ecosystem Analysis
- 8.6. Market Analysis, Insights and Forecast - by Technology
- 8.6.1. Big Data Analytics
- 8.6.2. Mobility and Telecom
- 8.6.3. Cloud Computing
- 8.6.4. Storage
- 8.6.5. Business Process Outsourcing
- 8.6.6. Other Technologies
- 8.7. Market Analysis, Insights and Forecast - by Component
- 8.7.1. Hardware/Devices
- 8.7.2. Software and Services
- 8.7.3. Communication and Connectivity
- 8.8. Market Analysis, Insights and Forecast - by End-user Industry
- 8.8.1. Oil, Gas, and Utilities
- 8.8.2. Travel and Hospitality
- 8.8.3. Healthcare
- 8.8.4. Financial Services
- 8.8.5. Manufacturing and Construction
- 8.8.6. Other End-user Industries
- 8.1. Market Analysis, Insights and Forecast - by Market Drivers
- 9. Middle East & Africa GCC And Africa ICT Market Analysis, Insights and Forecast, 2019-2031
- 9.1. Market Analysis, Insights and Forecast - by Market Drivers
- 9.1.1. Ongoing Events and Tourism Demanding Automation
- 9.1.2. Government Policies and PPP Initiatives
- 9.1.3. Rising Digital Transformation in the Industries
- 9.2. Market Analysis, Insights and Forecast - by Market Restraints
- 9.2.1. High Dep
- 9.2.2. Heavy Dependence on the Oil and Gas Sector
- 9.3. Market Analysis, Insights and Forecast - by Key Use Cases
- 9.4. Market Analysis, Insights and Forecast - by Government Projects and Initiatives
- 9.5. Market Analysis, Insights and Forecast - by Ecosystem Analysis
- 9.6. Market Analysis, Insights and Forecast - by Technology
- 9.6.1. Big Data Analytics
- 9.6.2. Mobility and Telecom
- 9.6.3. Cloud Computing
- 9.6.4. Storage
- 9.6.5. Business Process Outsourcing
- 9.6.6. Other Technologies
- 9.7. Market Analysis, Insights and Forecast - by Component
- 9.7.1. Hardware/Devices
- 9.7.2. Software and Services
- 9.7.3. Communication and Connectivity
- 9.8. Market Analysis, Insights and Forecast - by End-user Industry
- 9.8.1. Oil, Gas, and Utilities
- 9.8.2. Travel and Hospitality
- 9.8.3. Healthcare
- 9.8.4. Financial Services
- 9.8.5. Manufacturing and Construction
- 9.8.6. Other End-user Industries
- 9.1. Market Analysis, Insights and Forecast - by Market Drivers
- 10. Asia Pacific GCC And Africa ICT Market Analysis, Insights and Forecast, 2019-2031
- 10.1. Market Analysis, Insights and Forecast - by Market Drivers
- 10.1.1. Ongoing Events and Tourism Demanding Automation
- 10.1.2. Government Policies and PPP Initiatives
- 10.1.3. Rising Digital Transformation in the Industries
- 10.2. Market Analysis, Insights and Forecast - by Market Restraints
- 10.2.1. High Dep
- 10.2.2. Heavy Dependence on the Oil and Gas Sector
- 10.3. Market Analysis, Insights and Forecast - by Key Use Cases
- 10.4. Market Analysis, Insights and Forecast - by Government Projects and Initiatives
- 10.5. Market Analysis, Insights and Forecast - by Ecosystem Analysis
- 10.6. Market Analysis, Insights and Forecast - by Technology
- 10.6.1. Big Data Analytics
- 10.6.2. Mobility and Telecom
- 10.6.3. Cloud Computing
- 10.6.4. Storage
- 10.6.5. Business Process Outsourcing
- 10.6.6. Other Technologies
- 10.7. Market Analysis, Insights and Forecast - by Component
- 10.7.1. Hardware/Devices
- 10.7.2. Software and Services
- 10.7.3. Communication and Connectivity
- 10.8. Market Analysis, Insights and Forecast - by End-user Industry
- 10.8.1. Oil, Gas, and Utilities
- 10.8.2. Travel and Hospitality
- 10.8.3. Healthcare
- 10.8.4. Financial Services
- 10.8.5. Manufacturing and Construction
- 10.8.6. Other End-user Industries
- 10.1. Market Analysis, Insights and Forecast - by Market Drivers
- 11. Competitive Analysis
- 11.1. Global Market Share Analysis 2024
- 11.2. Company Profiles
- 11.2.1 Google LLC (Alphabet Inc )
- 11.2.1.1. Overview
- 11.2.1.2. Products
- 11.2.1.3. SWOT Analysis
- 11.2.1.4. Recent Developments
- 11.2.1.5. Financials (Based on Availability)
- 11.2.2 IBM Corporation
- 11.2.2.1. Overview
- 11.2.2.2. Products
- 11.2.2.3. SWOT Analysis
- 11.2.2.4. Recent Developments
- 11.2.2.5. Financials (Based on Availability)
- 11.2.3 Microsoft Corporation
- 11.2.3.1. Overview
- 11.2.3.2. Products
- 11.2.3.3. SWOT Analysis
- 11.2.3.4. Recent Developments
- 11.2.3.5. Financials (Based on Availability)
- 11.2.4 HP Inc
- 11.2.4.1. Overview
- 11.2.4.2. Products
- 11.2.4.3. SWOT Analysis
- 11.2.4.4. Recent Developments
- 11.2.4.5. Financials (Based on Availability)
- 11.2.5 SAP SE
- 11.2.5.1. Overview
- 11.2.5.2. Products
- 11.2.5.3. SWOT Analysis
- 11.2.5.4. Recent Developments
- 11.2.5.5. Financials (Based on Availability)
- 11.2.6 Etisalat (Emirates Telecommunication Group Company PJSC)
- 11.2.6.1. Overview
- 11.2.6.2. Products
- 11.2.6.3. SWOT Analysis
- 11.2.6.4. Recent Developments
- 11.2.6.5. Financials (Based on Availability)
- 11.2.7 Oracle Corporation
- 11.2.7.1. Overview
- 11.2.7.2. Products
- 11.2.7.3. SWOT Analysis
- 11.2.7.4. Recent Developments
- 11.2.7.5. Financials (Based on Availability)
- 11.2.8 Salesforce Inc
- 11.2.8.1. Overview
- 11.2.8.2. Products
- 11.2.8.3. SWOT Analysis
- 11.2.8.4. Recent Developments
- 11.2.8.5. Financials (Based on Availability)
- 11.2.9 Accenture PLC
- 11.2.9.1. Overview
- 11.2.9.2. Products
- 11.2.9.3. SWOT Analysis
- 11.2.9.4. Recent Developments
- 11.2.9.5. Financials (Based on Availability)
- 11.2.10 Amazon Web Services Inc (AWS)
- 11.2.10.1. Overview
- 11.2.10.2. Products
- 11.2.10.3. SWOT Analysis
- 11.2.10.4. Recent Developments
- 11.2.10.5. Financials (Based on Availability)
- 11.2.11 Cisco Systems Inc
- 11.2.11.1. Overview
- 11.2.11.2. Products
- 11.2.11.3. SWOT Analysis
- 11.2.11.4. Recent Developments
- 11.2.11.5. Financials (Based on Availability)
- 11.2.12 Huawei Investment & Holding Co Ltd
- 11.2.12.1. Overview
- 11.2.12.2. Products
- 11.2.12.3. SWOT Analysis
- 11.2.12.4. Recent Developments
- 11.2.12.5. Financials (Based on Availability)
- 11.2.13 Wipro Limited
- 11.2.13.1. Overview
- 11.2.13.2. Products
- 11.2.13.3. SWOT Analysis
- 11.2.13.4. Recent Developments
- 11.2.13.5. Financials (Based on Availability)
- 11.2.14 Tata Consultancy Services Limited
- 11.2.14.1. Overview
- 11.2.14.2. Products
- 11.2.14.3. SWOT Analysis
- 11.2.14.4. Recent Developments
- 11.2.14.5. Financials (Based on Availability)
- 11.2.15 Gijima Group Pty Lt
- 11.2.15.1. Overview
- 11.2.15.2. Products
- 11.2.15.3. SWOT Analysis
- 11.2.15.4. Recent Developments
- 11.2.15.5. Financials (Based on Availability)
- 11.2.1 Google LLC (Alphabet Inc )
List of Figures
- Figure 1: Global GCC And Africa ICT Market Revenue Breakdown (Million, %) by Region 2024 & 2032
- Figure 2: Global GCC And Africa ICT Market Volume Breakdown (Billion, %) by Region 2024 & 2032
- Figure 3: North America GCC And Africa ICT Market Revenue (Million), by Market Drivers 2024 & 2032
- Figure 4: North America GCC And Africa ICT Market Volume (Billion), by Market Drivers 2024 & 2032
- Figure 5: North America GCC And Africa ICT Market Revenue Share (%), by Market Drivers 2024 & 2032
- Figure 6: North America GCC And Africa ICT Market Volume Share (%), by Market Drivers 2024 & 2032
- Figure 7: North America GCC And Africa ICT Market Revenue (Million), by Market Restraints 2024 & 2032
- Figure 8: North America GCC And Africa ICT Market Volume (Billion), by Market Restraints 2024 & 2032
- Figure 9: North America GCC And Africa ICT Market Revenue Share (%), by Market Restraints 2024 & 2032
- Figure 10: North America GCC And Africa ICT Market Volume Share (%), by Market Restraints 2024 & 2032
- Figure 11: North America GCC And Africa ICT Market Revenue (Million), by Key Use Cases 2024 & 2032
- Figure 12: North America GCC And Africa ICT Market Volume (Billion), by Key Use Cases 2024 & 2032
- Figure 13: North America GCC And Africa ICT Market Revenue Share (%), by Key Use Cases 2024 & 2032
- Figure 14: North America GCC And Africa ICT Market Volume Share (%), by Key Use Cases 2024 & 2032
- Figure 15: North America GCC And Africa ICT Market Revenue (Million), by Government Projects and Initiatives 2024 & 2032
- Figure 16: North America GCC And Africa ICT Market Volume (Billion), by Government Projects and Initiatives 2024 & 2032
- Figure 17: North America GCC And Africa ICT Market Revenue Share (%), by Government Projects and Initiatives 2024 & 2032
- Figure 18: North America GCC And Africa ICT Market Volume Share (%), by Government Projects and Initiatives 2024 & 2032
- Figure 19: North America GCC And Africa ICT Market Revenue (Million), by Ecosystem Analysis 2024 & 2032
- Figure 20: North America GCC And Africa ICT Market Volume (Billion), by Ecosystem Analysis 2024 & 2032
- Figure 21: North America GCC And Africa ICT Market Revenue Share (%), by Ecosystem Analysis 2024 & 2032
- Figure 22: North America GCC And Africa ICT Market Volume Share (%), by Ecosystem Analysis 2024 & 2032
- Figure 23: North America GCC And Africa ICT Market Revenue (Million), by Technology 2024 & 2032
- Figure 24: North America GCC And Africa ICT Market Volume (Billion), by Technology 2024 & 2032
- Figure 25: North America GCC And Africa ICT Market Revenue Share (%), by Technology 2024 & 2032
- Figure 26: North America GCC And Africa ICT Market Volume Share (%), by Technology 2024 & 2032
- Figure 27: North America GCC And Africa ICT Market Revenue (Million), by Component 2024 & 2032
- Figure 28: North America GCC And Africa ICT Market Volume (Billion), by Component 2024 & 2032
- Figure 29: North America GCC And Africa ICT Market Revenue Share (%), by Component 2024 & 2032
- Figure 30: North America GCC And Africa ICT Market Volume Share (%), by Component 2024 & 2032
- Figure 31: North America GCC And Africa ICT Market Revenue (Million), by End-user Industry 2024 & 2032
- Figure 32: North America GCC And Africa ICT Market Volume (Billion), by End-user Industry 2024 & 2032
- Figure 33: North America GCC And Africa ICT Market Revenue Share (%), by End-user Industry 2024 & 2032
- Figure 34: North America GCC And Africa ICT Market Volume Share (%), by End-user Industry 2024 & 2032
- Figure 35: North America GCC And Africa ICT Market Revenue (Million), by Country 2024 & 2032
- Figure 36: North America GCC And Africa ICT Market Volume (Billion), by Country 2024 & 2032
- Figure 37: North America GCC And Africa ICT Market Revenue Share (%), by Country 2024 & 2032
- Figure 38: North America GCC And Africa ICT Market Volume Share (%), by Country 2024 & 2032
- Figure 39: South America GCC And Africa ICT Market Revenue (Million), by Market Drivers 2024 & 2032
- Figure 40: South America GCC And Africa ICT Market Volume (Billion), by Market Drivers 2024 & 2032
- Figure 41: South America GCC And Africa ICT Market Revenue Share (%), by Market Drivers 2024 & 2032
- Figure 42: South America GCC And Africa ICT Market Volume Share (%), by Market Drivers 2024 & 2032
- Figure 43: South America GCC And Africa ICT Market Revenue (Million), by Market Restraints 2024 & 2032
- Figure 44: South America GCC And Africa ICT Market Volume (Billion), by Market Restraints 2024 & 2032
- Figure 45: South America GCC And Africa ICT Market Revenue Share (%), by Market Restraints 2024 & 2032
- Figure 46: South America GCC And Africa ICT Market Volume Share (%), by Market Restraints 2024 & 2032
- Figure 47: South America GCC And Africa ICT Market Revenue (Million), by Key Use Cases 2024 & 2032
- Figure 48: South America GCC And Africa ICT Market Volume (Billion), by Key Use Cases 2024 & 2032
- Figure 49: South America GCC And Africa ICT Market Revenue Share (%), by Key Use Cases 2024 & 2032
- Figure 50: South America GCC And Africa ICT Market Volume Share (%), by Key Use Cases 2024 & 2032
- Figure 51: South America GCC And Africa ICT Market Revenue (Million), by Government Projects and Initiatives 2024 & 2032
- Figure 52: South America GCC And Africa ICT Market Volume (Billion), by Government Projects and Initiatives 2024 & 2032
- Figure 53: South America GCC And Africa ICT Market Revenue Share (%), by Government Projects and Initiatives 2024 & 2032
- Figure 54: South America GCC And Africa ICT Market Volume Share (%), by Government Projects and Initiatives 2024 & 2032
- Figure 55: South America GCC And Africa ICT Market Revenue (Million), by Ecosystem Analysis 2024 & 2032
- Figure 56: South America GCC And Africa ICT Market Volume (Billion), by Ecosystem Analysis 2024 & 2032
- Figure 57: South America GCC And Africa ICT Market Revenue Share (%), by Ecosystem Analysis 2024 & 2032
- Figure 58: South America GCC And Africa ICT Market Volume Share (%), by Ecosystem Analysis 2024 & 2032
- Figure 59: South America GCC And Africa ICT Market Revenue (Million), by Technology 2024 & 2032
- Figure 60: South America GCC And Africa ICT Market Volume (Billion), by Technology 2024 & 2032
- Figure 61: South America GCC And Africa ICT Market Revenue Share (%), by Technology 2024 & 2032
- Figure 62: South America GCC And Africa ICT Market Volume Share (%), by Technology 2024 & 2032
- Figure 63: South America GCC And Africa ICT Market Revenue (Million), by Component 2024 & 2032
- Figure 64: South America GCC And Africa ICT Market Volume (Billion), by Component 2024 & 2032
- Figure 65: South America GCC And Africa ICT Market Revenue Share (%), by Component 2024 & 2032
- Figure 66: South America GCC And Africa ICT Market Volume Share (%), by Component 2024 & 2032
- Figure 67: South America GCC And Africa ICT Market Revenue (Million), by End-user Industry 2024 & 2032
- Figure 68: South America GCC And Africa ICT Market Volume (Billion), by End-user Industry 2024 & 2032
- Figure 69: South America GCC And Africa ICT Market Revenue Share (%), by End-user Industry 2024 & 2032
- Figure 70: South America GCC And Africa ICT Market Volume Share (%), by End-user Industry 2024 & 2032
- Figure 71: South America GCC And Africa ICT Market Revenue (Million), by Country 2024 & 2032
- Figure 72: South America GCC And Africa ICT Market Volume (Billion), by Country 2024 & 2032
- Figure 73: South America GCC And Africa ICT Market Revenue Share (%), by Country 2024 & 2032
- Figure 74: South America GCC And Africa ICT Market Volume Share (%), by Country 2024 & 2032
- Figure 75: Europe GCC And Africa ICT Market Revenue (Million), by Market Drivers 2024 & 2032
- Figure 76: Europe GCC And Africa ICT Market Volume (Billion), by Market Drivers 2024 & 2032
- Figure 77: Europe GCC And Africa ICT Market Revenue Share (%), by Market Drivers 2024 & 2032
- Figure 78: Europe GCC And Africa ICT Market Volume Share (%), by Market Drivers 2024 & 2032
- Figure 79: Europe GCC And Africa ICT Market Revenue (Million), by Market Restraints 2024 & 2032
- Figure 80: Europe GCC And Africa ICT Market Volume (Billion), by Market Restraints 2024 & 2032
- Figure 81: Europe GCC And Africa ICT Market Revenue Share (%), by Market Restraints 2024 & 2032
- Figure 82: Europe GCC And Africa ICT Market Volume Share (%), by Market Restraints 2024 & 2032
- Figure 83: Europe GCC And Africa ICT Market Revenue (Million), by Key Use Cases 2024 & 2032
- Figure 84: Europe GCC And Africa ICT Market Volume (Billion), by Key Use Cases 2024 & 2032
- Figure 85: Europe GCC And Africa ICT Market Revenue Share (%), by Key Use Cases 2024 & 2032
- Figure 86: Europe GCC And Africa ICT Market Volume Share (%), by Key Use Cases 2024 & 2032
- Figure 87: Europe GCC And Africa ICT Market Revenue (Million), by Government Projects and Initiatives 2024 & 2032
- Figure 88: Europe GCC And Africa ICT Market Volume (Billion), by Government Projects and Initiatives 2024 & 2032
- Figure 89: Europe GCC And Africa ICT Market Revenue Share (%), by Government Projects and Initiatives 2024 & 2032
- Figure 90: Europe GCC And Africa ICT Market Volume Share (%), by Government Projects and Initiatives 2024 & 2032
- Figure 91: Europe GCC And Africa ICT Market Revenue (Million), by Ecosystem Analysis 2024 & 2032
- Figure 92: Europe GCC And Africa ICT Market Volume (Billion), by Ecosystem Analysis 2024 & 2032
- Figure 93: Europe GCC And Africa ICT Market Revenue Share (%), by Ecosystem Analysis 2024 & 2032
- Figure 94: Europe GCC And Africa ICT Market Volume Share (%), by Ecosystem Analysis 2024 & 2032
- Figure 95: Europe GCC And Africa ICT Market Revenue (Million), by Technology 2024 & 2032
- Figure 96: Europe GCC And Africa ICT Market Volume (Billion), by Technology 2024 & 2032
- Figure 97: Europe GCC And Africa ICT Market Revenue Share (%), by Technology 2024 & 2032
- Figure 98: Europe GCC And Africa ICT Market Volume Share (%), by Technology 2024 & 2032
- Figure 99: Europe GCC And Africa ICT Market Revenue (Million), by Component 2024 & 2032
- Figure 100: Europe GCC And Africa ICT Market Volume (Billion), by Component 2024 & 2032
- Figure 101: Europe GCC And Africa ICT Market Revenue Share (%), by Component 2024 & 2032
- Figure 102: Europe GCC And Africa ICT Market Volume Share (%), by Component 2024 & 2032
- Figure 103: Europe GCC And Africa ICT Market Revenue (Million), by End-user Industry 2024 & 2032
- Figure 104: Europe GCC And Africa ICT Market Volume (Billion), by End-user Industry 2024 & 2032
- Figure 105: Europe GCC And Africa ICT Market Revenue Share (%), by End-user Industry 2024 & 2032
- Figure 106: Europe GCC And Africa ICT Market Volume Share (%), by End-user Industry 2024 & 2032
- Figure 107: Europe GCC And Africa ICT Market Revenue (Million), by Country 2024 & 2032
- Figure 108: Europe GCC And Africa ICT Market Volume (Billion), by Country 2024 & 2032
- Figure 109: Europe GCC And Africa ICT Market Revenue Share (%), by Country 2024 & 2032
- Figure 110: Europe GCC And Africa ICT Market Volume Share (%), by Country 2024 & 2032
- Figure 111: Middle East & Africa GCC And Africa ICT Market Revenue (Million), by Market Drivers 2024 & 2032
- Figure 112: Middle East & Africa GCC And Africa ICT Market Volume (Billion), by Market Drivers 2024 & 2032
- Figure 113: Middle East & Africa GCC And Africa ICT Market Revenue Share (%), by Market Drivers 2024 & 2032
- Figure 114: Middle East & Africa GCC And Africa ICT Market Volume Share (%), by Market Drivers 2024 & 2032
- Figure 115: Middle East & Africa GCC And Africa ICT Market Revenue (Million), by Market Restraints 2024 & 2032
- Figure 116: Middle East & Africa GCC And Africa ICT Market Volume (Billion), by Market Restraints 2024 & 2032
- Figure 117: Middle East & Africa GCC And Africa ICT Market Revenue Share (%), by Market Restraints 2024 & 2032
- Figure 118: Middle East & Africa GCC And Africa ICT Market Volume Share (%), by Market Restraints 2024 & 2032
- Figure 119: Middle East & Africa GCC And Africa ICT Market Revenue (Million), by Key Use Cases 2024 & 2032
- Figure 120: Middle East & Africa GCC And Africa ICT Market Volume (Billion), by Key Use Cases 2024 & 2032
- Figure 121: Middle East & Africa GCC And Africa ICT Market Revenue Share (%), by Key Use Cases 2024 & 2032
- Figure 122: Middle East & Africa GCC And Africa ICT Market Volume Share (%), by Key Use Cases 2024 & 2032
- Figure 123: Middle East & Africa GCC And Africa ICT Market Revenue (Million), by Government Projects and Initiatives 2024 & 2032
- Figure 124: Middle East & Africa GCC And Africa ICT Market Volume (Billion), by Government Projects and Initiatives 2024 & 2032
- Figure 125: Middle East & Africa GCC And Africa ICT Market Revenue Share (%), by Government Projects and Initiatives 2024 & 2032
- Figure 126: Middle East & Africa GCC And Africa ICT Market Volume Share (%), by Government Projects and Initiatives 2024 & 2032
- Figure 127: Middle East & Africa GCC And Africa ICT Market Revenue (Million), by Ecosystem Analysis 2024 & 2032
- Figure 128: Middle East & Africa GCC And Africa ICT Market Volume (Billion), by Ecosystem Analysis 2024 & 2032
- Figure 129: Middle East & Africa GCC And Africa ICT Market Revenue Share (%), by Ecosystem Analysis 2024 & 2032
- Figure 130: Middle East & Africa GCC And Africa ICT Market Volume Share (%), by Ecosystem Analysis 2024 & 2032
- Figure 131: Middle East & Africa GCC And Africa ICT Market Revenue (Million), by Technology 2024 & 2032
- Figure 132: Middle East & Africa GCC And Africa ICT Market Volume (Billion), by Technology 2024 & 2032
- Figure 133: Middle East & Africa GCC And Africa ICT Market Revenue Share (%), by Technology 2024 & 2032
- Figure 134: Middle East & Africa GCC And Africa ICT Market Volume Share (%), by Technology 2024 & 2032
- Figure 135: Middle East & Africa GCC And Africa ICT Market Revenue (Million), by Component 2024 & 2032
- Figure 136: Middle East & Africa GCC And Africa ICT Market Volume (Billion), by Component 2024 & 2032
- Figure 137: Middle East & Africa GCC And Africa ICT Market Revenue Share (%), by Component 2024 & 2032
- Figure 138: Middle East & Africa GCC And Africa ICT Market Volume Share (%), by Component 2024 & 2032
- Figure 139: Middle East & Africa GCC And Africa ICT Market Revenue (Million), by End-user Industry 2024 & 2032
- Figure 140: Middle East & Africa GCC And Africa ICT Market Volume (Billion), by End-user Industry 2024 & 2032
- Figure 141: Middle East & Africa GCC And Africa ICT Market Revenue Share (%), by End-user Industry 2024 & 2032
- Figure 142: Middle East & Africa GCC And Africa ICT Market Volume Share (%), by End-user Industry 2024 & 2032
- Figure 143: Middle East & Africa GCC And Africa ICT Market Revenue (Million), by Country 2024 & 2032
- Figure 144: Middle East & Africa GCC And Africa ICT Market Volume (Billion), by Country 2024 & 2032
- Figure 145: Middle East & Africa GCC And Africa ICT Market Revenue Share (%), by Country 2024 & 2032
- Figure 146: Middle East & Africa GCC And Africa ICT Market Volume Share (%), by Country 2024 & 2032
- Figure 147: Asia Pacific GCC And Africa ICT Market Revenue (Million), by Market Drivers 2024 & 2032
- Figure 148: Asia Pacific GCC And Africa ICT Market Volume (Billion), by Market Drivers 2024 & 2032
- Figure 149: Asia Pacific GCC And Africa ICT Market Revenue Share (%), by Market Drivers 2024 & 2032
- Figure 150: Asia Pacific GCC And Africa ICT Market Volume Share (%), by Market Drivers 2024 & 2032
- Figure 151: Asia Pacific GCC And Africa ICT Market Revenue (Million), by Market Restraints 2024 & 2032
- Figure 152: Asia Pacific GCC And Africa ICT Market Volume (Billion), by Market Restraints 2024 & 2032
- Figure 153: Asia Pacific GCC And Africa ICT Market Revenue Share (%), by Market Restraints 2024 & 2032
- Figure 154: Asia Pacific GCC And Africa ICT Market Volume Share (%), by Market Restraints 2024 & 2032
- Figure 155: Asia Pacific GCC And Africa ICT Market Revenue (Million), by Key Use Cases 2024 & 2032
- Figure 156: Asia Pacific GCC And Africa ICT Market Volume (Billion), by Key Use Cases 2024 & 2032
- Figure 157: Asia Pacific GCC And Africa ICT Market Revenue Share (%), by Key Use Cases 2024 & 2032
- Figure 158: Asia Pacific GCC And Africa ICT Market Volume Share (%), by Key Use Cases 2024 & 2032
- Figure 159: Asia Pacific GCC And Africa ICT Market Revenue (Million), by Government Projects and Initiatives 2024 & 2032
- Figure 160: Asia Pacific GCC And Africa ICT Market Volume (Billion), by Government Projects and Initiatives 2024 & 2032
- Figure 161: Asia Pacific GCC And Africa ICT Market Revenue Share (%), by Government Projects and Initiatives 2024 & 2032
- Figure 162: Asia Pacific GCC And Africa ICT Market Volume Share (%), by Government Projects and Initiatives 2024 & 2032
- Figure 163: Asia Pacific GCC And Africa ICT Market Revenue (Million), by Ecosystem Analysis 2024 & 2032
- Figure 164: Asia Pacific GCC And Africa ICT Market Volume (Billion), by Ecosystem Analysis 2024 & 2032
- Figure 165: Asia Pacific GCC And Africa ICT Market Revenue Share (%), by Ecosystem Analysis 2024 & 2032
- Figure 166: Asia Pacific GCC And Africa ICT Market Volume Share (%), by Ecosystem Analysis 2024 & 2032
- Figure 167: Asia Pacific GCC And Africa ICT Market Revenue (Million), by Technology 2024 & 2032
- Figure 168: Asia Pacific GCC And Africa ICT Market Volume (Billion), by Technology 2024 & 2032
- Figure 169: Asia Pacific GCC And Africa ICT Market Revenue Share (%), by Technology 2024 & 2032
- Figure 170: Asia Pacific GCC And Africa ICT Market Volume Share (%), by Technology 2024 & 2032
- Figure 171: Asia Pacific GCC And Africa ICT Market Revenue (Million), by Component 2024 & 2032
- Figure 172: Asia Pacific GCC And Africa ICT Market Volume (Billion), by Component 2024 & 2032
- Figure 173: Asia Pacific GCC And Africa ICT Market Revenue Share (%), by Component 2024 & 2032
- Figure 174: Asia Pacific GCC And Africa ICT Market Volume Share (%), by Component 2024 & 2032
- Figure 175: Asia Pacific GCC And Africa ICT Market Revenue (Million), by End-user Industry 2024 & 2032
- Figure 176: Asia Pacific GCC And Africa ICT Market Volume (Billion), by End-user Industry 2024 & 2032
- Figure 177: Asia Pacific GCC And Africa ICT Market Revenue Share (%), by End-user Industry 2024 & 2032
- Figure 178: Asia Pacific GCC And Africa ICT Market Volume Share (%), by End-user Industry 2024 & 2032
- Figure 179: Asia Pacific GCC And Africa ICT Market Revenue (Million), by Country 2024 & 2032
- Figure 180: Asia Pacific GCC And Africa ICT Market Volume (Billion), by Country 2024 & 2032
- Figure 181: Asia Pacific GCC And Africa ICT Market Revenue Share (%), by Country 2024 & 2032
- Figure 182: Asia Pacific GCC And Africa ICT Market Volume Share (%), by Country 2024 & 2032
List of Tables
- Table 1: Global GCC And Africa ICT Market Revenue Million Forecast, by Region 2019 & 2032
- Table 2: Global GCC And Africa ICT Market Volume Billion Forecast, by Region 2019 & 2032
- Table 3: Global GCC And Africa ICT Market Revenue Million Forecast, by Market Drivers 2019 & 2032
- Table 4: Global GCC And Africa ICT Market Volume Billion Forecast, by Market Drivers 2019 & 2032
- Table 5: Global GCC And Africa ICT Market Revenue Million Forecast, by Market Restraints 2019 & 2032
- Table 6: Global GCC And Africa ICT Market Volume Billion Forecast, by Market Restraints 2019 & 2032
- Table 7: Global GCC And Africa ICT Market Revenue Million Forecast, by Key Use Cases 2019 & 2032
- Table 8: Global GCC And Africa ICT Market Volume Billion Forecast, by Key Use Cases 2019 & 2032
- Table 9: Global GCC And Africa ICT Market Revenue Million Forecast, by Government Projects and Initiatives 2019 & 2032
- Table 10: Global GCC And Africa ICT Market Volume Billion Forecast, by Government Projects and Initiatives 2019 & 2032
- Table 11: Global GCC And Africa ICT Market Revenue Million Forecast, by Ecosystem Analysis 2019 & 2032
- Table 12: Global GCC And Africa ICT Market Volume Billion Forecast, by Ecosystem Analysis 2019 & 2032
- Table 13: Global GCC And Africa ICT Market Revenue Million Forecast, by Technology 2019 & 2032
- Table 14: Global GCC And Africa ICT Market Volume Billion Forecast, by Technology 2019 & 2032
- Table 15: Global GCC And Africa ICT Market Revenue Million Forecast, by Component 2019 & 2032
- Table 16: Global GCC And Africa ICT Market Volume Billion Forecast, by Component 2019 & 2032
- Table 17: Global GCC And Africa ICT Market Revenue Million Forecast, by End-user Industry 2019 & 2032
- Table 18: Global GCC And Africa ICT Market Volume Billion Forecast, by End-user Industry 2019 & 2032
- Table 19: Global GCC And Africa ICT Market Revenue Million Forecast, by Region 2019 & 2032
- Table 20: Global GCC And Africa ICT Market Volume Billion Forecast, by Region 2019 & 2032
- Table 21: Global GCC And Africa ICT Market Revenue Million Forecast, by Market Drivers 2019 & 2032
- Table 22: Global GCC And Africa ICT Market Volume Billion Forecast, by Market Drivers 2019 & 2032
- Table 23: Global GCC And Africa ICT Market Revenue Million Forecast, by Market Restraints 2019 & 2032
- Table 24: Global GCC And Africa ICT Market Volume Billion Forecast, by Market Restraints 2019 & 2032
- Table 25: Global GCC And Africa ICT Market Revenue Million Forecast, by Key Use Cases 2019 & 2032
- Table 26: Global GCC And Africa ICT Market Volume Billion Forecast, by Key Use Cases 2019 & 2032
- Table 27: Global GCC And Africa ICT Market Revenue Million Forecast, by Government Projects and Initiatives 2019 & 2032
- Table 28: Global GCC And Africa ICT Market Volume Billion Forecast, by Government Projects and Initiatives 2019 & 2032
- Table 29: Global GCC And Africa ICT Market Revenue Million Forecast, by Ecosystem Analysis 2019 & 2032
- Table 30: Global GCC And Africa ICT Market Volume Billion Forecast, by Ecosystem Analysis 2019 & 2032
- Table 31: Global GCC And Africa ICT Market Revenue Million Forecast, by Technology 2019 & 2032
- Table 32: Global GCC And Africa ICT Market Volume Billion Forecast, by Technology 2019 & 2032
- Table 33: Global GCC And Africa ICT Market Revenue Million Forecast, by Component 2019 & 2032
- Table 34: Global GCC And Africa ICT Market Volume Billion Forecast, by Component 2019 & 2032
- Table 35: Global GCC And Africa ICT Market Revenue Million Forecast, by End-user Industry 2019 & 2032
- Table 36: Global GCC And Africa ICT Market Volume Billion Forecast, by End-user Industry 2019 & 2032
- Table 37: Global GCC And Africa ICT Market Revenue Million Forecast, by Country 2019 & 2032
- Table 38: Global GCC And Africa ICT Market Volume Billion Forecast, by Country 2019 & 2032
- Table 39: United States GCC And Africa ICT Market Revenue (Million) Forecast, by Application 2019 & 2032
- Table 40: United States GCC And Africa ICT Market Volume (Billion) Forecast, by Application 2019 & 2032
- Table 41: Canada GCC And Africa ICT Market Revenue (Million) Forecast, by Application 2019 & 2032
- Table 42: Canada GCC And Africa ICT Market Volume (Billion) Forecast, by Application 2019 & 2032
- Table 43: Mexico GCC And Africa ICT Market Revenue (Million) Forecast, by Application 2019 & 2032
- Table 44: Mexico GCC And Africa ICT Market Volume (Billion) Forecast, by Application 2019 & 2032
- Table 45: Global GCC And Africa ICT Market Revenue Million Forecast, by Market Drivers 2019 & 2032
- Table 46: Global GCC And Africa ICT Market Volume Billion Forecast, by Market Drivers 2019 & 2032
- Table 47: Global GCC And Africa ICT Market Revenue Million Forecast, by Market Restraints 2019 & 2032
- Table 48: Global GCC And Africa ICT Market Volume Billion Forecast, by Market Restraints 2019 & 2032
- Table 49: Global GCC And Africa ICT Market Revenue Million Forecast, by Key Use Cases 2019 & 2032
- Table 50: Global GCC And Africa ICT Market Volume Billion Forecast, by Key Use Cases 2019 & 2032
- Table 51: Global GCC And Africa ICT Market Revenue Million Forecast, by Government Projects and Initiatives 2019 & 2032
- Table 52: Global GCC And Africa ICT Market Volume Billion Forecast, by Government Projects and Initiatives 2019 & 2032
- Table 53: Global GCC And Africa ICT Market Revenue Million Forecast, by Ecosystem Analysis 2019 & 2032
- Table 54: Global GCC And Africa ICT Market Volume Billion Forecast, by Ecosystem Analysis 2019 & 2032
- Table 55: Global GCC And Africa ICT Market Revenue Million Forecast, by Technology 2019 & 2032
- Table 56: Global GCC And Africa ICT Market Volume Billion Forecast, by Technology 2019 & 2032
- Table 57: Global GCC And Africa ICT Market Revenue Million Forecast, by Component 2019 & 2032
- Table 58: Global GCC And Africa ICT Market Volume Billion Forecast, by Component 2019 & 2032
- Table 59: Global GCC And Africa ICT Market Revenue Million Forecast, by End-user Industry 2019 & 2032
- Table 60: Global GCC And Africa ICT Market Volume Billion Forecast, by End-user Industry 2019 & 2032
- Table 61: Global GCC And Africa ICT Market Revenue Million Forecast, by Country 2019 & 2032
- Table 62: Global GCC And Africa ICT Market Volume Billion Forecast, by Country 2019 & 2032
- Table 63: Brazil GCC And Africa ICT Market Revenue (Million) Forecast, by Application 2019 & 2032
- Table 64: Brazil GCC And Africa ICT Market Volume (Billion) Forecast, by Application 2019 & 2032
- Table 65: Argentina GCC And Africa ICT Market Revenue (Million) Forecast, by Application 2019 & 2032
- Table 66: Argentina GCC And Africa ICT Market Volume (Billion) Forecast, by Application 2019 & 2032
- Table 67: Rest of South America GCC And Africa ICT Market Revenue (Million) Forecast, by Application 2019 & 2032
- Table 68: Rest of South America GCC And Africa ICT Market Volume (Billion) Forecast, by Application 2019 & 2032
- Table 69: Global GCC And Africa ICT Market Revenue Million Forecast, by Market Drivers 2019 & 2032
- Table 70: Global GCC And Africa ICT Market Volume Billion Forecast, by Market Drivers 2019 & 2032
- Table 71: Global GCC And Africa ICT Market Revenue Million Forecast, by Market Restraints 2019 & 2032
- Table 72: Global GCC And Africa ICT Market Volume Billion Forecast, by Market Restraints 2019 & 2032
- Table 73: Global GCC And Africa ICT Market Revenue Million Forecast, by Key Use Cases 2019 & 2032
- Table 74: Global GCC And Africa ICT Market Volume Billion Forecast, by Key Use Cases 2019 & 2032
- Table 75: Global GCC And Africa ICT Market Revenue Million Forecast, by Government Projects and Initiatives 2019 & 2032
- Table 76: Global GCC And Africa ICT Market Volume Billion Forecast, by Government Projects and Initiatives 2019 & 2032
- Table 77: Global GCC And Africa ICT Market Revenue Million Forecast, by Ecosystem Analysis 2019 & 2032
- Table 78: Global GCC And Africa ICT Market Volume Billion Forecast, by Ecosystem Analysis 2019 & 2032
- Table 79: Global GCC And Africa ICT Market Revenue Million Forecast, by Technology 2019 & 2032
- Table 80: Global GCC And Africa ICT Market Volume Billion Forecast, by Technology 2019 & 2032
- Table 81: Global GCC And Africa ICT Market Revenue Million Forecast, by Component 2019 & 2032
- Table 82: Global GCC And Africa ICT Market Volume Billion Forecast, by Component 2019 & 2032
- Table 83: Global GCC And Africa ICT Market Revenue Million Forecast, by End-user Industry 2019 & 2032
- Table 84: Global GCC And Africa ICT Market Volume Billion Forecast, by End-user Industry 2019 & 2032
- Table 85: Global GCC And Africa ICT Market Revenue Million Forecast, by Country 2019 & 2032
- Table 86: Global GCC And Africa ICT Market Volume Billion Forecast, by Country 2019 & 2032
- Table 87: United Kingdom GCC And Africa ICT Market Revenue (Million) Forecast, by Application 2019 & 2032
- Table 88: United Kingdom GCC And Africa ICT Market Volume (Billion) Forecast, by Application 2019 & 2032
- Table 89: Germany GCC And Africa ICT Market Revenue (Million) Forecast, by Application 2019 & 2032
- Table 90: Germany GCC And Africa ICT Market Volume (Billion) Forecast, by Application 2019 & 2032
- Table 91: France GCC And Africa ICT Market Revenue (Million) Forecast, by Application 2019 & 2032
- Table 92: France GCC And Africa ICT Market Volume (Billion) Forecast, by Application 2019 & 2032
- Table 93: Italy GCC And Africa ICT Market Revenue (Million) Forecast, by Application 2019 & 2032
- Table 94: Italy GCC And Africa ICT Market Volume (Billion) Forecast, by Application 2019 & 2032
- Table 95: Spain GCC And Africa ICT Market Revenue (Million) Forecast, by Application 2019 & 2032
- Table 96: Spain GCC And Africa ICT Market Volume (Billion) Forecast, by Application 2019 & 2032
- Table 97: Russia GCC And Africa ICT Market Revenue (Million) Forecast, by Application 2019 & 2032
- Table 98: Russia GCC And Africa ICT Market Volume (Billion) Forecast, by Application 2019 & 2032
- Table 99: Benelux GCC And Africa ICT Market Revenue (Million) Forecast, by Application 2019 & 2032
- Table 100: Benelux GCC And Africa ICT Market Volume (Billion) Forecast, by Application 2019 & 2032
- Table 101: Nordics GCC And Africa ICT Market Revenue (Million) Forecast, by Application 2019 & 2032
- Table 102: Nordics GCC And Africa ICT Market Volume (Billion) Forecast, by Application 2019 & 2032
- Table 103: Rest of Europe GCC And Africa ICT Market Revenue (Million) Forecast, by Application 2019 & 2032
- Table 104: Rest of Europe GCC And Africa ICT Market Volume (Billion) Forecast, by Application 2019 & 2032
- Table 105: Global GCC And Africa ICT Market Revenue Million Forecast, by Market Drivers 2019 & 2032
- Table 106: Global GCC And Africa ICT Market Volume Billion Forecast, by Market Drivers 2019 & 2032
- Table 107: Global GCC And Africa ICT Market Revenue Million Forecast, by Market Restraints 2019 & 2032
- Table 108: Global GCC And Africa ICT Market Volume Billion Forecast, by Market Restraints 2019 & 2032
- Table 109: Global GCC And Africa ICT Market Revenue Million Forecast, by Key Use Cases 2019 & 2032
- Table 110: Global GCC And Africa ICT Market Volume Billion Forecast, by Key Use Cases 2019 & 2032
- Table 111: Global GCC And Africa ICT Market Revenue Million Forecast, by Government Projects and Initiatives 2019 & 2032
- Table 112: Global GCC And Africa ICT Market Volume Billion Forecast, by Government Projects and Initiatives 2019 & 2032
- Table 113: Global GCC And Africa ICT Market Revenue Million Forecast, by Ecosystem Analysis 2019 & 2032
- Table 114: Global GCC And Africa ICT Market Volume Billion Forecast, by Ecosystem Analysis 2019 & 2032
- Table 115: Global GCC And Africa ICT Market Revenue Million Forecast, by Technology 2019 & 2032
- Table 116: Global GCC And Africa ICT Market Volume Billion Forecast, by Technology 2019 & 2032
- Table 117: Global GCC And Africa ICT Market Revenue Million Forecast, by Component 2019 & 2032
- Table 118: Global GCC And Africa ICT Market Volume Billion Forecast, by Component 2019 & 2032
- Table 119: Global GCC And Africa ICT Market Revenue Million Forecast, by End-user Industry 2019 & 2032
- Table 120: Global GCC And Africa ICT Market Volume Billion Forecast, by End-user Industry 2019 & 2032
- Table 121: Global GCC And Africa ICT Market Revenue Million Forecast, by Country 2019 & 2032
- Table 122: Global GCC And Africa ICT Market Volume Billion Forecast, by Country 2019 & 2032
- Table 123: Turkey GCC And Africa ICT Market Revenue (Million) Forecast, by Application 2019 & 2032
- Table 124: Turkey GCC And Africa ICT Market Volume (Billion) Forecast, by Application 2019 & 2032
- Table 125: Israel GCC And Africa ICT Market Revenue (Million) Forecast, by Application 2019 & 2032
- Table 126: Israel GCC And Africa ICT Market Volume (Billion) Forecast, by Application 2019 & 2032
- Table 127: GCC GCC And Africa ICT Market Revenue (Million) Forecast, by Application 2019 & 2032
- Table 128: GCC GCC And Africa ICT Market Volume (Billion) Forecast, by Application 2019 & 2032
- Table 129: North Africa GCC And Africa ICT Market Revenue (Million) Forecast, by Application 2019 & 2032
- Table 130: North Africa GCC And Africa ICT Market Volume (Billion) Forecast, by Application 2019 & 2032
- Table 131: South Africa GCC And Africa ICT Market Revenue (Million) Forecast, by Application 2019 & 2032
- Table 132: South Africa GCC And Africa ICT Market Volume (Billion) Forecast, by Application 2019 & 2032
- Table 133: Rest of Middle East & Africa GCC And Africa ICT Market Revenue (Million) Forecast, by Application 2019 & 2032
- Table 134: Rest of Middle East & Africa GCC And Africa ICT Market Volume (Billion) Forecast, by Application 2019 & 2032
- Table 135: Global GCC And Africa ICT Market Revenue Million Forecast, by Market Drivers 2019 & 2032
- Table 136: Global GCC And Africa ICT Market Volume Billion Forecast, by Market Drivers 2019 & 2032
- Table 137: Global GCC And Africa ICT Market Revenue Million Forecast, by Market Restraints 2019 & 2032
- Table 138: Global GCC And Africa ICT Market Volume Billion Forecast, by Market Restraints 2019 & 2032
- Table 139: Global GCC And Africa ICT Market Revenue Million Forecast, by Key Use Cases 2019 & 2032
- Table 140: Global GCC And Africa ICT Market Volume Billion Forecast, by Key Use Cases 2019 & 2032
- Table 141: Global GCC And Africa ICT Market Revenue Million Forecast, by Government Projects and Initiatives 2019 & 2032
- Table 142: Global GCC And Africa ICT Market Volume Billion Forecast, by Government Projects and Initiatives 2019 & 2032
- Table 143: Global GCC And Africa ICT Market Revenue Million Forecast, by Ecosystem Analysis 2019 & 2032
- Table 144: Global GCC And Africa ICT Market Volume Billion Forecast, by Ecosystem Analysis 2019 & 2032
- Table 145: Global GCC And Africa ICT Market Revenue Million Forecast, by Technology 2019 & 2032
- Table 146: Global GCC And Africa ICT Market Volume Billion Forecast, by Technology 2019 & 2032
- Table 147: Global GCC And Africa ICT Market Revenue Million Forecast, by Component 2019 & 2032
- Table 148: Global GCC And Africa ICT Market Volume Billion Forecast, by Component 2019 & 2032
- Table 149: Global GCC And Africa ICT Market Revenue Million Forecast, by End-user Industry 2019 & 2032
- Table 150: Global GCC And Africa ICT Market Volume Billion Forecast, by End-user Industry 2019 & 2032
- Table 151: Global GCC And Africa ICT Market Revenue Million Forecast, by Country 2019 & 2032
- Table 152: Global GCC And Africa ICT Market Volume Billion Forecast, by Country 2019 & 2032
- Table 153: China GCC And Africa ICT Market Revenue (Million) Forecast, by Application 2019 & 2032
- Table 154: China GCC And Africa ICT Market Volume (Billion) Forecast, by Application 2019 & 2032
- Table 155: India GCC And Africa ICT Market Revenue (Million) Forecast, by Application 2019 & 2032
- Table 156: India GCC And Africa ICT Market Volume (Billion) Forecast, by Application 2019 & 2032
- Table 157: Japan GCC And Africa ICT Market Revenue (Million) Forecast, by Application 2019 & 2032
- Table 158: Japan GCC And Africa ICT Market Volume (Billion) Forecast, by Application 2019 & 2032
- Table 159: South Korea GCC And Africa ICT Market Revenue (Million) Forecast, by Application 2019 & 2032
- Table 160: South Korea GCC And Africa ICT Market Volume (Billion) Forecast, by Application 2019 & 2032
- Table 161: ASEAN GCC And Africa ICT Market Revenue (Million) Forecast, by Application 2019 & 2032
- Table 162: ASEAN GCC And Africa ICT Market Volume (Billion) Forecast, by Application 2019 & 2032
- Table 163: Oceania GCC And Africa ICT Market Revenue (Million) Forecast, by Application 2019 & 2032
- Table 164: Oceania GCC And Africa ICT Market Volume (Billion) Forecast, by Application 2019 & 2032
- Table 165: Rest of Asia Pacific GCC And Africa ICT Market Revenue (Million) Forecast, by Application 2019 & 2032
- Table 166: Rest of Asia Pacific GCC And Africa ICT Market Volume (Billion) Forecast, by Application 2019 & 2032
Frequently Asked Questions
1. What is the projected Compound Annual Growth Rate (CAGR) of the GCC And Africa ICT Market?
The projected CAGR is approximately 9.77%.
2. Which companies are prominent players in the GCC And Africa ICT Market?
Key companies in the market include Google LLC (Alphabet Inc ), IBM Corporation, Microsoft Corporation, HP Inc, SAP SE, Etisalat (Emirates Telecommunication Group Company PJSC), Oracle Corporation, Salesforce Inc, Accenture PLC, Amazon Web Services Inc (AWS), Cisco Systems Inc, Huawei Investment & Holding Co Ltd, Wipro Limited, Tata Consultancy Services Limited, Gijima Group Pty Lt.
3. What are the main segments of the GCC And Africa ICT Market?
The market segments include Market Drivers, Market Restraints, Key Use Cases, Government Projects and Initiatives, Ecosystem Analysis, Technology, Component, End-user Industry.
4. Can you provide details about the market size?
The market size is estimated to be USD 266.55 Million as of 2022.
5. What are some drivers contributing to market growth?
Ongoing Events and Tourism Demanding Automation; Government Policies and PPP Initiatives; Rising Digital Transformation in the Industries.
6. What are the notable trends driving market growth?
Mobility and Telecom to be the Largest Technology Segment.
7. Are there any restraints impacting market growth?
Ongoing Events and Tourism Demanding Automation; Government Policies and PPP Initiatives; Rising Digital Transformation in the Industries.
8. Can you provide examples of recent developments in the market?
August 2024: Liquid Intelligent Technologies (Liquid), a key player in the technology landscape and a subsidiary of Cassava Technologies, forged a strategic alliance with Globalstar, a US-based connectivity pioneer. Together, they are set to introduce cutting-edge 5G solutions across Africa, the Middle East, and the Gulf.
9. What pricing options are available for accessing the report?
Pricing options include single-user, multi-user, and enterprise licenses priced at USD 4750, USD 4950, and USD 6800 respectively.
10. Is the market size provided in terms of value or volume?
The market size is provided in terms of value, measured in Million and volume, measured in Billion.
11. Are there any specific market keywords associated with the report?
Yes, the market keyword associated with the report is "GCC And Africa ICT Market," which aids in identifying and referencing the specific market segment covered.
12. How do I determine which pricing option suits my needs best?
The pricing options vary based on user requirements and access needs. Individual users may opt for single-user licenses, while businesses requiring broader access may choose multi-user or enterprise licenses for cost-effective access to the report.
13. Are there any additional resources or data provided in the GCC And Africa ICT Market report?
While the report offers comprehensive insights, it's advisable to review the specific contents or supplementary materials provided to ascertain if additional resources or data are available.
14. How can I stay updated on further developments or reports in the GCC And Africa ICT Market?
To stay informed about further developments, trends, and reports in the GCC And Africa ICT Market, consider subscribing to industry newsletters, following relevant companies and organizations, or regularly checking reputable industry news sources and publications.
Methodology
Step 1 - Identification of Relevant Samples Size from Population Database


Step 2 - Approaches for Defining Global Market Size (Value, Volume* & Price*)

Note*: In applicable scenarios
Step 3 - Data Sources
Primary Research
- Web Analytics
- Survey Reports
- Research Institute
- Latest Research Reports
- Opinion Leaders
Secondary Research
- Annual Reports
- White Paper
- Latest Press Release
- Industry Association
- Paid Database
- Investor Presentations

Step 4 - Data Triangulation
Involves using different sources of information in order to increase the validity of a study
These sources are likely to be stakeholders in a program - participants, other researchers, program staff, other community members, and so on.
Then we put all data in single framework & apply various statistical tools to find out the dynamic on the market.
During the analysis stage, feedback from the stakeholder groups would be compared to determine areas of agreement as well as areas of divergence


