
Key Insights
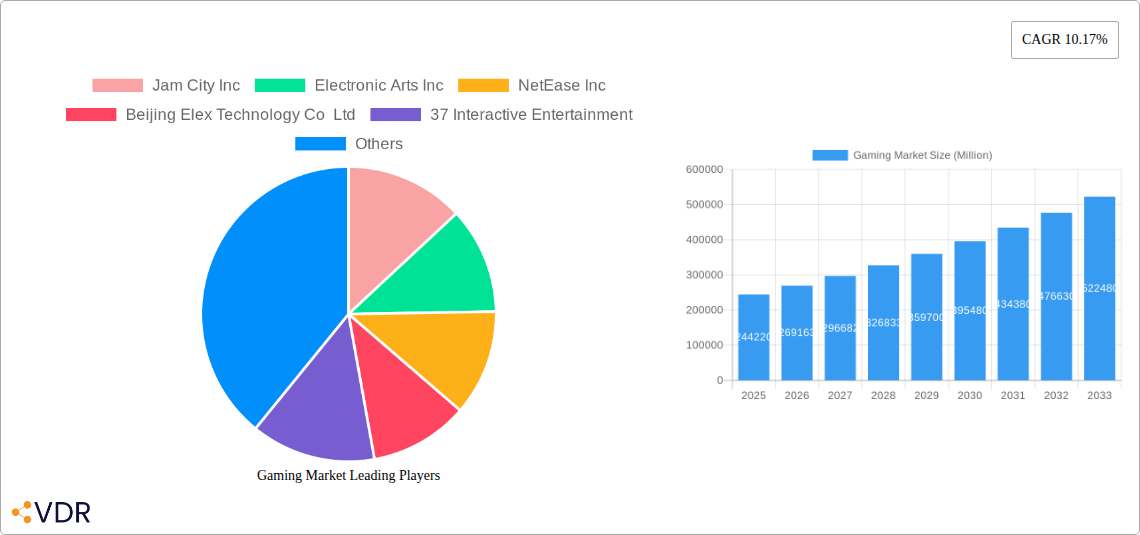
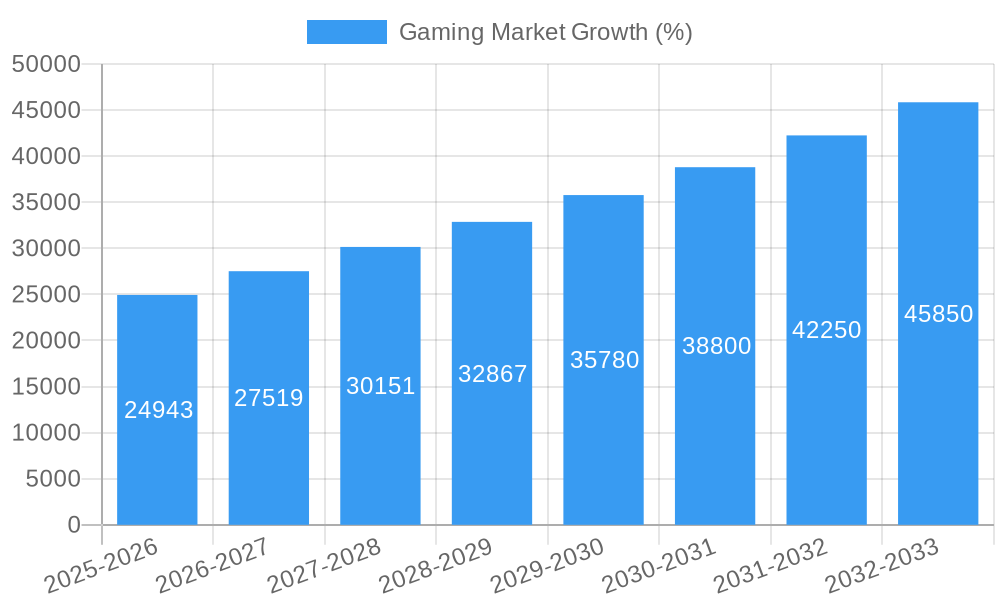
The global gaming market, valued at $244.22 billion in 2025, is projected to experience robust growth, exhibiting a compound annual growth rate (CAGR) of 10.17% from 2025 to 2033. This expansion is fueled by several key drivers. The increasing popularity of mobile gaming, driven by smartphone penetration and readily available high-speed internet, significantly contributes to market growth. Furthermore, the rise of esports as a mainstream spectator sport and the continuous evolution of gaming technology, including advancements in virtual reality (VR) and augmented reality (AR), are propelling market expansion. The diverse segments within the gaming market, encompassing mobile, console, PC, and esports, offer various avenues for growth and cater to a broad spectrum of consumer preferences. Significant investments by major players like Tencent, Sony, and Microsoft in game development and distribution further solidify the market's upward trajectory. Geographic expansion, particularly in emerging markets with rapidly increasing internet and smartphone adoption rates in Asia and Latin America, presents considerable untapped potential.
However, market growth is not without its challenges. Potential restraints include the increasing competition within the industry, leading to price wars and the need for continuous innovation to maintain market share. Regulatory hurdles related to in-app purchases and loot boxes in certain regions also present obstacles to unfettered growth. Furthermore, maintaining player engagement and combating game addiction are crucial concerns for developers and publishers. Despite these challenges, the overall outlook for the gaming market remains exceptionally positive, driven by sustained technological advancements, the evolving preferences of a globally connected consumer base, and strategic investments by key industry players. The continued diversification of gaming platforms and the immersive experiences offered by VR/AR technologies are poised to further accelerate market expansion in the coming years.
Gaming Market: A Comprehensive Market Report (2019-2033)
This in-depth report provides a comprehensive analysis of the global gaming market, encompassing historical data (2019-2024), current estimations (2025), and future forecasts (2025-2033). It delves into market dynamics, growth trends, regional dominance, key players, and emerging opportunities across various gaming segments, including mobile, console, PC, and esports. The report is essential for industry professionals, investors, and strategic decision-makers seeking to navigate this rapidly evolving landscape.
Gaming Market Dynamics & Structure
The gaming market is characterized by high competition, rapid technological advancements, and evolving regulatory landscapes. Market concentration is relatively high, with a few major players holding significant market share. However, the emergence of independent studios and mobile game developers is fostering increased competition. Technological innovation, particularly in areas like VR/AR, cloud gaming, and AI-powered game design, is a key driver of market growth. Regulatory frameworks concerning data privacy, in-app purchases, and content moderation vary across regions, impacting market dynamics. The market also witnesses significant M&A activity, with larger companies acquiring smaller studios to expand their portfolios and technological capabilities. Substitutes for traditional gaming are increasing, including streaming services, social media, and other forms of entertainment. End-user demographics are broadening, with gamers spanning various age groups, genders, and socioeconomic backgrounds.
- Market Concentration: Top 5 players hold xx% market share (2024).
- M&A Activity: xx deals closed in 2024, valued at $xx million.
- Technological Innovation: Key areas include VR/AR, cloud gaming, and AI.
- Regulatory Landscape: Varying data privacy regulations across regions.
- End-User Demographics: Expanding across age groups and socioeconomic levels.
Gaming Market Growth Trends & Insights
The global gaming market is experiencing robust growth, driven by increasing smartphone penetration, rising internet access, and the expanding popularity of esports. The market size has grown from $xx million in 2019 to an estimated $xx million in 2025, exhibiting a CAGR of xx%. Adoption rates for mobile gaming are particularly high, with a market penetration rate of xx% globally in 2025. Technological disruptions, such as the advent of cloud gaming and the development of more immersive gaming experiences through VR/AR, are further fueling market expansion. Consumer behavior is shifting towards digital distribution, subscription-based models, and increased engagement with social and competitive gaming elements.
- Market Size (2019): $xx million
- Market Size (2025): $xx million (Estimated)
- CAGR (2019-2025): xx%
- Mobile Gaming Penetration (2025): xx%
- Key Trends: Cloud gaming, VR/AR integration, esports growth, subscription models.
Dominant Regions, Countries, or Segments in Gaming Market
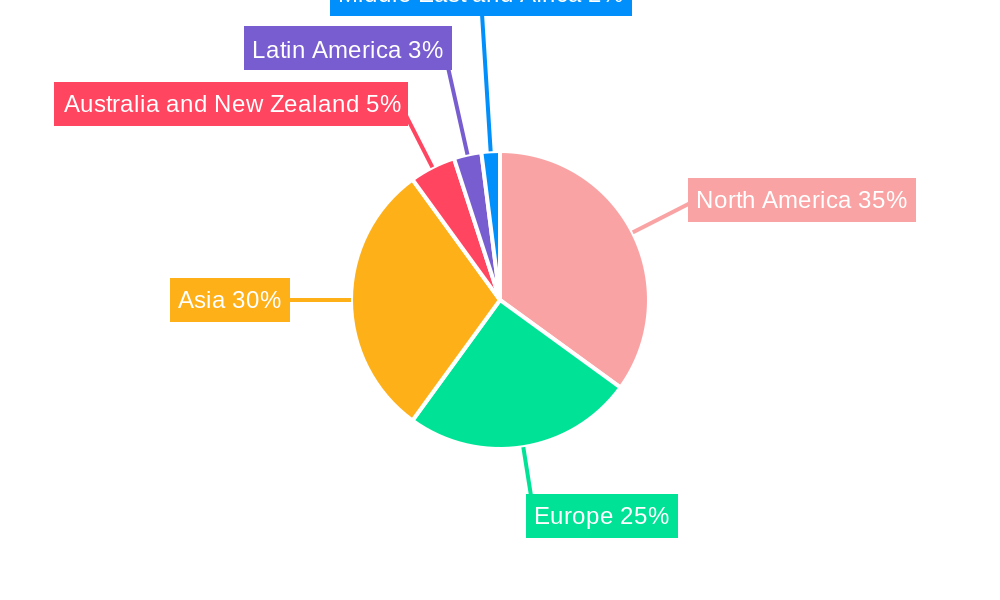
The Asia-Pacific region holds a dominant position in the global gaming market, driven by significant growth in mobile gaming in countries like China, India, and South Korea. North America and Europe also represent substantial markets, with robust console and PC gaming segments. Within gaming types, Mobile Games constitute the largest segment, capturing the majority of market share, followed by PC and Console games. Esports is exhibiting rapid growth, increasing market attractiveness for investors. The dominance of certain regions is due to a number of factors, including higher disposable incomes, stronger technological infrastructure, favorable regulatory environments, and a thriving esports ecosystem.
- Largest Region: Asia-Pacific (xx% market share in 2025)
- Largest Segment (by gaming type): Mobile Games (xx% market share in 2025)
- Key Drivers: High smartphone penetration, strong internet infrastructure, and a large consumer base.
- Growth Potential: Esports, cloud gaming, and VR/AR adoption in emerging markets.
Gaming Market Product Landscape
Gaming products encompass a wide range of hardware and software, including consoles (PlayStation, Xbox, Nintendo Switch), PCs, mobile devices, VR/AR headsets, and game controllers. Recent product innovations focus on enhanced graphics, improved processing power, and the integration of cloud gaming technologies. Performance metrics, such as frame rates, resolution, and latency, are key factors influencing consumer choices. Unique selling propositions for different products often center on exclusive game titles, advanced technological features, or specialized gaming experiences.
Key Drivers, Barriers & Challenges in Gaming Market
Key Drivers: Technological advancements (VR/AR, cloud gaming), rising smartphone penetration, growing popularity of esports, and increasing disposable incomes. Government support for the gaming industry in certain regions also acts as a key driver.
Key Challenges & Restraints: Intense competition, evolving consumer preferences, regulatory hurdles around content and data privacy, and supply chain disruptions impacting hardware production. The potential impact of these restraints on market growth is estimated at approximately xx% reduction in CAGR over the next decade.
Emerging Opportunities in Gaming Market
Emerging opportunities include the expansion of cloud gaming, the growth of the metaverse, and the increasing integration of NFTs and blockchain technology into gaming. Untapped markets in developing countries, particularly in Africa and Latin America, offer significant potential for growth. The development of innovative game genres and play experiences will attract new players. The shift towards personalized gaming experiences tailored to individual preferences is an area of opportunity as well.
Growth Accelerators in the Gaming Market Industry
Technological breakthroughs in areas such as AI-powered game development, advanced graphics rendering, and enhanced online connectivity are driving long-term growth. Strategic partnerships between hardware manufacturers, software developers, and technology companies are fostering innovation and market expansion. Aggressive marketing strategies by key players and the continuous development of new games are also helping to drive expansion in this sector.
Key Players Shaping the Gaming Market Market
- Jam City Inc
- Electronic Arts Inc
- NetEase Inc
- Beijing Elex Technology Co Ltd
- 37 Interactive Entertainment
- Microsoft Corporation
- Sega Sammy Holdings Inc
- Square Enix Holdings Co Ltd
- Ubisoft Entertainment SA
- Tencent Holdings Ltd
- Nintendo Co Ltd
- ZeptoLab UK limited
- Realnetworks LLC (Gamehouse)
- Take-Two Interactive Software Inc
- Apple Inc
- Bandai Namco Holdings Inc
- Nexon Co Ltd
- Sony Corporation
- Capcom Co Ltd
Notable Milestones in Gaming Market Sector
- June 2024: Microsoft unveils all-digital Xbox Series X and S consoles, including a 2TB premium model, alongside new game previews. This signifies a push towards digital distribution and higher-end gaming experiences.
- April 2024: Sony launches the PlayStation 5 Slim in India, a smaller, lighter version of its flagship console. This indicates a focus on improving accessibility and affordability.
In-Depth Gaming Market Market Outlook
The gaming market is poised for sustained growth, driven by technological advancements, increased accessibility, and expanding global reach. Strategic partnerships, acquisitions, and the development of innovative gaming experiences will shape the future of this dynamic sector. The increasing integration of gaming into other forms of entertainment, such as movies and live events, represents a significant long-term growth opportunity. This suggests that the market will continue to expand significantly in the coming years, with new products, innovative technologies, and changes in consumer behavior all contributing to a vibrant and profitable landscape.
Gaming Market Segmentation
-
1. Gaming Type
- 1.1. Mobile Games
- 1.2. Console Games
- 1.3. Downloaded/Box PC
- 1.4. E-sports
Gaming Market Segmentation By Geography
-
1. North America
- 1.1. United States
- 1.2. Canada
-
2. Europe
- 2.1. Germany
- 2.2. United Kingdom
- 2.3. France
- 2.4. Russia
- 2.5. Spain
- 2.6. Italy
-
3. Asia
- 3.1. China
- 3.2. Japan
- 3.3. South Korea
- 4. Australia and New Zealand
-
5. Latin America
- 5.1. Brazil
- 5.2. Argentina
- 5.3. Mexico
-
6. Middle East and Africa
- 6.1. United Arab Emirates
- 6.2. Saudi Arabia
- 6.3. Iran
- 6.4. Egypt
Gaming Market REPORT HIGHLIGHTS
| Aspects | Details |
|---|---|
| Study Period | 2019-2033 |
| Base Year | 2024 |
| Estimated Year | 2025 |
| Forecast Period | 2025-2033 |
| Historical Period | 2019-2024 |
| Growth Rate | CAGR of 10.17% from 2019-2033 |
| Segmentation |
|
Table of Contents
- 1. Introduction
- 1.1. Research Scope
- 1.2. Market Segmentation
- 1.3. Research Methodology
- 1.4. Definitions and Assumptions
- 2. Executive Summary
- 2.1. Introduction
- 3. Market Dynamics
- 3.1. Introduction
- 3.2. Market Drivers
- 3.2.1 Rising Internet Penetration; Emergence of Cloud Gaming; Adoption of Gaming Platforms
- 3.2.2 such as E-sports Betting and Fantasy Sites
- 3.3. Market Restrains
- 3.3.1 Issues such as Piracy
- 3.3.2 Laws and Regulations
- 3.3.3 and Concerns Relating to Fraud During Gaming Transactions
- 3.4. Market Trends
- 3.4.1. Console Games Gaming Type Segment Holds Significant Market Share
- 4. Market Factor Analysis
- 4.1. Porters Five Forces
- 4.2. Supply/Value Chain
- 4.3. PESTEL analysis
- 4.4. Market Entropy
- 4.5. Patent/Trademark Analysis
- 5. Global Gaming Market Analysis, Insights and Forecast, 2019-2031
- 5.1. Market Analysis, Insights and Forecast - by Gaming Type
- 5.1.1. Mobile Games
- 5.1.2. Console Games
- 5.1.3. Downloaded/Box PC
- 5.1.4. E-sports
- 5.2. Market Analysis, Insights and Forecast - by Region
- 5.2.1. North America
- 5.2.2. Europe
- 5.2.3. Asia
- 5.2.4. Australia and New Zealand
- 5.2.5. Latin America
- 5.2.6. Middle East and Africa
- 5.1. Market Analysis, Insights and Forecast - by Gaming Type
- 6. North America Gaming Market Analysis, Insights and Forecast, 2019-2031
- 6.1. Market Analysis, Insights and Forecast - by Gaming Type
- 6.1.1. Mobile Games
- 6.1.2. Console Games
- 6.1.3. Downloaded/Box PC
- 6.1.4. E-sports
- 6.1. Market Analysis, Insights and Forecast - by Gaming Type
- 7. Europe Gaming Market Analysis, Insights and Forecast, 2019-2031
- 7.1. Market Analysis, Insights and Forecast - by Gaming Type
- 7.1.1. Mobile Games
- 7.1.2. Console Games
- 7.1.3. Downloaded/Box PC
- 7.1.4. E-sports
- 7.1. Market Analysis, Insights and Forecast - by Gaming Type
- 8. Asia Gaming Market Analysis, Insights and Forecast, 2019-2031
- 8.1. Market Analysis, Insights and Forecast - by Gaming Type
- 8.1.1. Mobile Games
- 8.1.2. Console Games
- 8.1.3. Downloaded/Box PC
- 8.1.4. E-sports
- 8.1. Market Analysis, Insights and Forecast - by Gaming Type
- 9. Australia and New Zealand Gaming Market Analysis, Insights and Forecast, 2019-2031
- 9.1. Market Analysis, Insights and Forecast - by Gaming Type
- 9.1.1. Mobile Games
- 9.1.2. Console Games
- 9.1.3. Downloaded/Box PC
- 9.1.4. E-sports
- 9.1. Market Analysis, Insights and Forecast - by Gaming Type
- 10. Latin America Gaming Market Analysis, Insights and Forecast, 2019-2031
- 10.1. Market Analysis, Insights and Forecast - by Gaming Type
- 10.1.1. Mobile Games
- 10.1.2. Console Games
- 10.1.3. Downloaded/Box PC
- 10.1.4. E-sports
- 10.1. Market Analysis, Insights and Forecast - by Gaming Type
- 11. Middle East and Africa Gaming Market Analysis, Insights and Forecast, 2019-2031
- 11.1. Market Analysis, Insights and Forecast - by Gaming Type
- 11.1.1. Mobile Games
- 11.1.2. Console Games
- 11.1.3. Downloaded/Box PC
- 11.1.4. E-sports
- 11.1. Market Analysis, Insights and Forecast - by Gaming Type
- 12. North America Gaming Market Analysis, Insights and Forecast, 2019-2031
- 12.1. Market Analysis, Insights and Forecast - By Country/Sub-region
- 12.1.1 United States
- 12.1.2 Canada
- 13. Europe Gaming Market Analysis, Insights and Forecast, 2019-2031
- 13.1. Market Analysis, Insights and Forecast - By Country/Sub-region
- 13.1.1 Germany
- 13.1.2 United Kingdom
- 13.1.3 France
- 13.1.4 Russia
- 13.1.5 Spain
- 13.1.6 Italy
- 14. Asia Gaming Market Analysis, Insights and Forecast, 2019-2031
- 14.1. Market Analysis, Insights and Forecast - By Country/Sub-region
- 14.1.1 China
- 14.1.2 Japan
- 14.1.3 South Korea
- 15. Australia and New Zealand Gaming Market Analysis, Insights and Forecast, 2019-2031
- 15.1. Market Analysis, Insights and Forecast - By Country/Sub-region
- 15.1.1.
- 16. Latin America Gaming Market Analysis, Insights and Forecast, 2019-2031
- 16.1. Market Analysis, Insights and Forecast - By Country/Sub-region
- 16.1.1 Brazil
- 16.1.2 Argentina
- 16.1.3 Mexico
- 17. Middle East and Africa Gaming Market Analysis, Insights and Forecast, 2019-2031
- 17.1. Market Analysis, Insights and Forecast - By Country/Sub-region
- 17.1.1 United Arab Emirates
- 17.1.2 Saudi Arabia
- 17.1.3 Iran
- 17.1.4 Egypt
- 18. Competitive Analysis
- 18.1. Global Market Share Analysis 2024
- 18.2. Company Profiles
- 18.2.1 Jam City Inc
- 18.2.1.1. Overview
- 18.2.1.2. Products
- 18.2.1.3. SWOT Analysis
- 18.2.1.4. Recent Developments
- 18.2.1.5. Financials (Based on Availability)
- 18.2.2 Electronic Arts Inc
- 18.2.2.1. Overview
- 18.2.2.2. Products
- 18.2.2.3. SWOT Analysis
- 18.2.2.4. Recent Developments
- 18.2.2.5. Financials (Based on Availability)
- 18.2.3 NetEase Inc
- 18.2.3.1. Overview
- 18.2.3.2. Products
- 18.2.3.3. SWOT Analysis
- 18.2.3.4. Recent Developments
- 18.2.3.5. Financials (Based on Availability)
- 18.2.4 Beijing Elex Technology Co Ltd
- 18.2.4.1. Overview
- 18.2.4.2. Products
- 18.2.4.3. SWOT Analysis
- 18.2.4.4. Recent Developments
- 18.2.4.5. Financials (Based on Availability)
- 18.2.5 37 Interactive Entertainment
- 18.2.5.1. Overview
- 18.2.5.2. Products
- 18.2.5.3. SWOT Analysis
- 18.2.5.4. Recent Developments
- 18.2.5.5. Financials (Based on Availability)
- 18.2.6 Microsoft Corporation
- 18.2.6.1. Overview
- 18.2.6.2. Products
- 18.2.6.3. SWOT Analysis
- 18.2.6.4. Recent Developments
- 18.2.6.5. Financials (Based on Availability)
- 18.2.7 Sega Sammy Holdings Inc
- 18.2.7.1. Overview
- 18.2.7.2. Products
- 18.2.7.3. SWOT Analysis
- 18.2.7.4. Recent Developments
- 18.2.7.5. Financials (Based on Availability)
- 18.2.8 Square Enix Holdings Co Ltd
- 18.2.8.1. Overview
- 18.2.8.2. Products
- 18.2.8.3. SWOT Analysis
- 18.2.8.4. Recent Developments
- 18.2.8.5. Financials (Based on Availability)
- 18.2.9 Ubisoft Entertainment SA
- 18.2.9.1. Overview
- 18.2.9.2. Products
- 18.2.9.3. SWOT Analysis
- 18.2.9.4. Recent Developments
- 18.2.9.5. Financials (Based on Availability)
- 18.2.10 Tencent Holdings Ltd
- 18.2.10.1. Overview
- 18.2.10.2. Products
- 18.2.10.3. SWOT Analysis
- 18.2.10.4. Recent Developments
- 18.2.10.5. Financials (Based on Availability)
- 18.2.11 Nintendo Co Ltd
- 18.2.11.1. Overview
- 18.2.11.2. Products
- 18.2.11.3. SWOT Analysis
- 18.2.11.4. Recent Developments
- 18.2.11.5. Financials (Based on Availability)
- 18.2.12 ZeptoLab UK limited
- 18.2.12.1. Overview
- 18.2.12.2. Products
- 18.2.12.3. SWOT Analysis
- 18.2.12.4. Recent Developments
- 18.2.12.5. Financials (Based on Availability)
- 18.2.13 Realnetworks LLC (Gamehouse)
- 18.2.13.1. Overview
- 18.2.13.2. Products
- 18.2.13.3. SWOT Analysis
- 18.2.13.4. Recent Developments
- 18.2.13.5. Financials (Based on Availability)
- 18.2.14 Take-Two Interactive Software Inc
- 18.2.14.1. Overview
- 18.2.14.2. Products
- 18.2.14.3. SWOT Analysis
- 18.2.14.4. Recent Developments
- 18.2.14.5. Financials (Based on Availability)
- 18.2.15 Apple Inc
- 18.2.15.1. Overview
- 18.2.15.2. Products
- 18.2.15.3. SWOT Analysis
- 18.2.15.4. Recent Developments
- 18.2.15.5. Financials (Based on Availability)
- 18.2.16 Bandai Namco Holdings Inc
- 18.2.16.1. Overview
- 18.2.16.2. Products
- 18.2.16.3. SWOT Analysis
- 18.2.16.4. Recent Developments
- 18.2.16.5. Financials (Based on Availability)
- 18.2.17 Nexon Co Ltd
- 18.2.17.1. Overview
- 18.2.17.2. Products
- 18.2.17.3. SWOT Analysis
- 18.2.17.4. Recent Developments
- 18.2.17.5. Financials (Based on Availability)
- 18.2.18 Sony Corporation
- 18.2.18.1. Overview
- 18.2.18.2. Products
- 18.2.18.3. SWOT Analysis
- 18.2.18.4. Recent Developments
- 18.2.18.5. Financials (Based on Availability)
- 18.2.19 Capcom Co Ltd
- 18.2.19.1. Overview
- 18.2.19.2. Products
- 18.2.19.3. SWOT Analysis
- 18.2.19.4. Recent Developments
- 18.2.19.5. Financials (Based on Availability)
- 18.2.1 Jam City Inc
List of Figures
- Figure 1: Global Gaming Market Revenue Breakdown (Million, %) by Region 2024 & 2032
- Figure 2: North America Gaming Market Revenue (Million), by Country 2024 & 2032
- Figure 3: North America Gaming Market Revenue Share (%), by Country 2024 & 2032
- Figure 4: Europe Gaming Market Revenue (Million), by Country 2024 & 2032
- Figure 5: Europe Gaming Market Revenue Share (%), by Country 2024 & 2032
- Figure 6: Asia Gaming Market Revenue (Million), by Country 2024 & 2032
- Figure 7: Asia Gaming Market Revenue Share (%), by Country 2024 & 2032
- Figure 8: Australia and New Zealand Gaming Market Revenue (Million), by Country 2024 & 2032
- Figure 9: Australia and New Zealand Gaming Market Revenue Share (%), by Country 2024 & 2032
- Figure 10: Latin America Gaming Market Revenue (Million), by Country 2024 & 2032
- Figure 11: Latin America Gaming Market Revenue Share (%), by Country 2024 & 2032
- Figure 12: Middle East and Africa Gaming Market Revenue (Million), by Country 2024 & 2032
- Figure 13: Middle East and Africa Gaming Market Revenue Share (%), by Country 2024 & 2032
- Figure 14: North America Gaming Market Revenue (Million), by Gaming Type 2024 & 2032
- Figure 15: North America Gaming Market Revenue Share (%), by Gaming Type 2024 & 2032
- Figure 16: North America Gaming Market Revenue (Million), by Country 2024 & 2032
- Figure 17: North America Gaming Market Revenue Share (%), by Country 2024 & 2032
- Figure 18: Europe Gaming Market Revenue (Million), by Gaming Type 2024 & 2032
- Figure 19: Europe Gaming Market Revenue Share (%), by Gaming Type 2024 & 2032
- Figure 20: Europe Gaming Market Revenue (Million), by Country 2024 & 2032
- Figure 21: Europe Gaming Market Revenue Share (%), by Country 2024 & 2032
- Figure 22: Asia Gaming Market Revenue (Million), by Gaming Type 2024 & 2032
- Figure 23: Asia Gaming Market Revenue Share (%), by Gaming Type 2024 & 2032
- Figure 24: Asia Gaming Market Revenue (Million), by Country 2024 & 2032
- Figure 25: Asia Gaming Market Revenue Share (%), by Country 2024 & 2032
- Figure 26: Australia and New Zealand Gaming Market Revenue (Million), by Gaming Type 2024 & 2032
- Figure 27: Australia and New Zealand Gaming Market Revenue Share (%), by Gaming Type 2024 & 2032
- Figure 28: Australia and New Zealand Gaming Market Revenue (Million), by Country 2024 & 2032
- Figure 29: Australia and New Zealand Gaming Market Revenue Share (%), by Country 2024 & 2032
- Figure 30: Latin America Gaming Market Revenue (Million), by Gaming Type 2024 & 2032
- Figure 31: Latin America Gaming Market Revenue Share (%), by Gaming Type 2024 & 2032
- Figure 32: Latin America Gaming Market Revenue (Million), by Country 2024 & 2032
- Figure 33: Latin America Gaming Market Revenue Share (%), by Country 2024 & 2032
- Figure 34: Middle East and Africa Gaming Market Revenue (Million), by Gaming Type 2024 & 2032
- Figure 35: Middle East and Africa Gaming Market Revenue Share (%), by Gaming Type 2024 & 2032
- Figure 36: Middle East and Africa Gaming Market Revenue (Million), by Country 2024 & 2032
- Figure 37: Middle East and Africa Gaming Market Revenue Share (%), by Country 2024 & 2032
List of Tables
- Table 1: Global Gaming Market Revenue Million Forecast, by Region 2019 & 2032
- Table 2: Global Gaming Market Revenue Million Forecast, by Gaming Type 2019 & 2032
- Table 3: Global Gaming Market Revenue Million Forecast, by Region 2019 & 2032
- Table 4: Global Gaming Market Revenue Million Forecast, by Country 2019 & 2032
- Table 5: United States Gaming Market Revenue (Million) Forecast, by Application 2019 & 2032
- Table 6: Canada Gaming Market Revenue (Million) Forecast, by Application 2019 & 2032
- Table 7: Global Gaming Market Revenue Million Forecast, by Country 2019 & 2032
- Table 8: Germany Gaming Market Revenue (Million) Forecast, by Application 2019 & 2032
- Table 9: United Kingdom Gaming Market Revenue (Million) Forecast, by Application 2019 & 2032
- Table 10: France Gaming Market Revenue (Million) Forecast, by Application 2019 & 2032
- Table 11: Russia Gaming Market Revenue (Million) Forecast, by Application 2019 & 2032
- Table 12: Spain Gaming Market Revenue (Million) Forecast, by Application 2019 & 2032
- Table 13: Italy Gaming Market Revenue (Million) Forecast, by Application 2019 & 2032
- Table 14: Global Gaming Market Revenue Million Forecast, by Country 2019 & 2032
- Table 15: China Gaming Market Revenue (Million) Forecast, by Application 2019 & 2032
- Table 16: Japan Gaming Market Revenue (Million) Forecast, by Application 2019 & 2032
- Table 17: South Korea Gaming Market Revenue (Million) Forecast, by Application 2019 & 2032
- Table 18: Global Gaming Market Revenue Million Forecast, by Country 2019 & 2032
- Table 19: Gaming Market Revenue (Million) Forecast, by Application 2019 & 2032
- Table 20: Global Gaming Market Revenue Million Forecast, by Country 2019 & 2032
- Table 21: Brazil Gaming Market Revenue (Million) Forecast, by Application 2019 & 2032
- Table 22: Argentina Gaming Market Revenue (Million) Forecast, by Application 2019 & 2032
- Table 23: Mexico Gaming Market Revenue (Million) Forecast, by Application 2019 & 2032
- Table 24: Global Gaming Market Revenue Million Forecast, by Country 2019 & 2032
- Table 25: United Arab Emirates Gaming Market Revenue (Million) Forecast, by Application 2019 & 2032
- Table 26: Saudi Arabia Gaming Market Revenue (Million) Forecast, by Application 2019 & 2032
- Table 27: Iran Gaming Market Revenue (Million) Forecast, by Application 2019 & 2032
- Table 28: Egypt Gaming Market Revenue (Million) Forecast, by Application 2019 & 2032
- Table 29: Global Gaming Market Revenue Million Forecast, by Gaming Type 2019 & 2032
- Table 30: Global Gaming Market Revenue Million Forecast, by Country 2019 & 2032
- Table 31: United States Gaming Market Revenue (Million) Forecast, by Application 2019 & 2032
- Table 32: Canada Gaming Market Revenue (Million) Forecast, by Application 2019 & 2032
- Table 33: Global Gaming Market Revenue Million Forecast, by Gaming Type 2019 & 2032
- Table 34: Global Gaming Market Revenue Million Forecast, by Country 2019 & 2032
- Table 35: Germany Gaming Market Revenue (Million) Forecast, by Application 2019 & 2032
- Table 36: United Kingdom Gaming Market Revenue (Million) Forecast, by Application 2019 & 2032
- Table 37: France Gaming Market Revenue (Million) Forecast, by Application 2019 & 2032
- Table 38: Russia Gaming Market Revenue (Million) Forecast, by Application 2019 & 2032
- Table 39: Spain Gaming Market Revenue (Million) Forecast, by Application 2019 & 2032
- Table 40: Italy Gaming Market Revenue (Million) Forecast, by Application 2019 & 2032
- Table 41: Global Gaming Market Revenue Million Forecast, by Gaming Type 2019 & 2032
- Table 42: Global Gaming Market Revenue Million Forecast, by Country 2019 & 2032
- Table 43: China Gaming Market Revenue (Million) Forecast, by Application 2019 & 2032
- Table 44: Japan Gaming Market Revenue (Million) Forecast, by Application 2019 & 2032
- Table 45: South Korea Gaming Market Revenue (Million) Forecast, by Application 2019 & 2032
- Table 46: Global Gaming Market Revenue Million Forecast, by Gaming Type 2019 & 2032
- Table 47: Global Gaming Market Revenue Million Forecast, by Country 2019 & 2032
- Table 48: Global Gaming Market Revenue Million Forecast, by Gaming Type 2019 & 2032
- Table 49: Global Gaming Market Revenue Million Forecast, by Country 2019 & 2032
- Table 50: Brazil Gaming Market Revenue (Million) Forecast, by Application 2019 & 2032
- Table 51: Argentina Gaming Market Revenue (Million) Forecast, by Application 2019 & 2032
- Table 52: Mexico Gaming Market Revenue (Million) Forecast, by Application 2019 & 2032
- Table 53: Global Gaming Market Revenue Million Forecast, by Gaming Type 2019 & 2032
- Table 54: Global Gaming Market Revenue Million Forecast, by Country 2019 & 2032
- Table 55: United Arab Emirates Gaming Market Revenue (Million) Forecast, by Application 2019 & 2032
- Table 56: Saudi Arabia Gaming Market Revenue (Million) Forecast, by Application 2019 & 2032
- Table 57: Iran Gaming Market Revenue (Million) Forecast, by Application 2019 & 2032
- Table 58: Egypt Gaming Market Revenue (Million) Forecast, by Application 2019 & 2032
Frequently Asked Questions
1. What is the projected Compound Annual Growth Rate (CAGR) of the Gaming Market?
The projected CAGR is approximately 10.17%.
2. Which companies are prominent players in the Gaming Market?
Key companies in the market include Jam City Inc, Electronic Arts Inc, NetEase Inc, Beijing Elex Technology Co Ltd, 37 Interactive Entertainment, Microsoft Corporation, Sega Sammy Holdings Inc, Square Enix Holdings Co Ltd, Ubisoft Entertainment SA, Tencent Holdings Ltd, Nintendo Co Ltd, ZeptoLab UK limited, Realnetworks LLC (Gamehouse), Take-Two Interactive Software Inc, Apple Inc, Bandai Namco Holdings Inc, Nexon Co Ltd, Sony Corporation, Capcom Co Ltd.
3. What are the main segments of the Gaming Market?
The market segments include Gaming Type.
4. Can you provide details about the market size?
The market size is estimated to be USD 244.22 Million as of 2022.
5. What are some drivers contributing to market growth?
Rising Internet Penetration; Emergence of Cloud Gaming; Adoption of Gaming Platforms. such as E-sports Betting and Fantasy Sites.
6. What are the notable trends driving market growth?
Console Games Gaming Type Segment Holds Significant Market Share.
7. Are there any restraints impacting market growth?
Issues such as Piracy. Laws and Regulations. and Concerns Relating to Fraud During Gaming Transactions.
8. Can you provide examples of recent developments in the market?
June 2024: Microsoft unveiled an all-digital variant of its Xbox Series X and S consoles alongside previews for over a dozen games, notably the next "Call of Duty" installment. The tech giant showcased not just one but three consoles: a disc-less iteration of the Xbox Series X and S and a premium Series X model boasting a capacious 2-terabyte storage.
9. What pricing options are available for accessing the report?
Pricing options include single-user, multi-user, and enterprise licenses priced at USD 4750, USD 5250, and USD 8750 respectively.
10. Is the market size provided in terms of value or volume?
The market size is provided in terms of value, measured in Million.
11. Are there any specific market keywords associated with the report?
Yes, the market keyword associated with the report is "Gaming Market," which aids in identifying and referencing the specific market segment covered.
12. How do I determine which pricing option suits my needs best?
The pricing options vary based on user requirements and access needs. Individual users may opt for single-user licenses, while businesses requiring broader access may choose multi-user or enterprise licenses for cost-effective access to the report.
13. Are there any additional resources or data provided in the Gaming Market report?
While the report offers comprehensive insights, it's advisable to review the specific contents or supplementary materials provided to ascertain if additional resources or data are available.
14. How can I stay updated on further developments or reports in the Gaming Market?
To stay informed about further developments, trends, and reports in the Gaming Market, consider subscribing to industry newsletters, following relevant companies and organizations, or regularly checking reputable industry news sources and publications.
Methodology
Step 1 - Identification of Relevant Samples Size from Population Database


Step 2 - Approaches for Defining Global Market Size (Value, Volume* & Price*)

Note*: In applicable scenarios
Step 3 - Data Sources
Primary Research
- Web Analytics
- Survey Reports
- Research Institute
- Latest Research Reports
- Opinion Leaders
Secondary Research
- Annual Reports
- White Paper
- Latest Press Release
- Industry Association
- Paid Database
- Investor Presentations

Step 4 - Data Triangulation
Involves using different sources of information in order to increase the validity of a study
These sources are likely to be stakeholders in a program - participants, other researchers, program staff, other community members, and so on.
Then we put all data in single framework & apply various statistical tools to find out the dynamic on the market.
During the analysis stage, feedback from the stakeholder groups would be compared to determine areas of agreement as well as areas of divergence


