
Key Insights
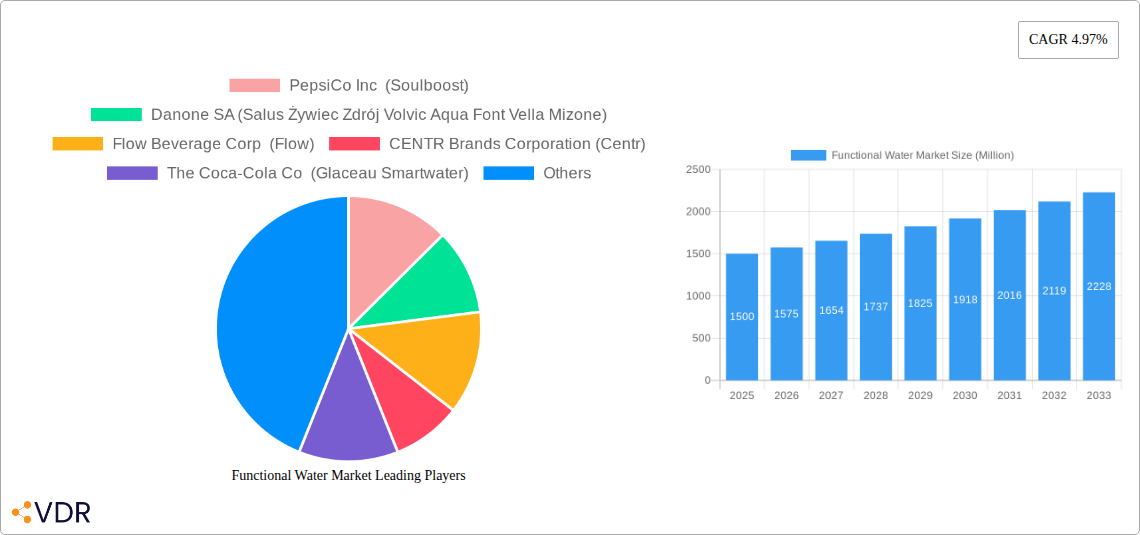
The functional water market, valued at approximately $XX million in 2025, is experiencing robust growth, projected to expand at a Compound Annual Growth Rate (CAGR) of 4.97% from 2025 to 2033. This growth is fueled by several key drivers. Increasing consumer awareness of health and wellness is a primary factor, with individuals seeking healthier hydration alternatives to sugary drinks. The rising prevalence of chronic diseases and the desire for proactive health management further contribute to this trend. Moreover, innovative product development, including enhanced flavor profiles and the addition of vitamins and minerals, is broadening the appeal of functional water, attracting a wider consumer base. The market segmentation reveals a strong presence across various distribution channels, with hypermarkets/supermarkets maintaining a significant share, while online retail stores are experiencing rapid expansion driven by e-commerce growth and consumer convenience. Competitive landscape analysis shows key players such as PepsiCo, Danone, and Coca-Cola strategically investing in the market, showcasing its lucrative potential.
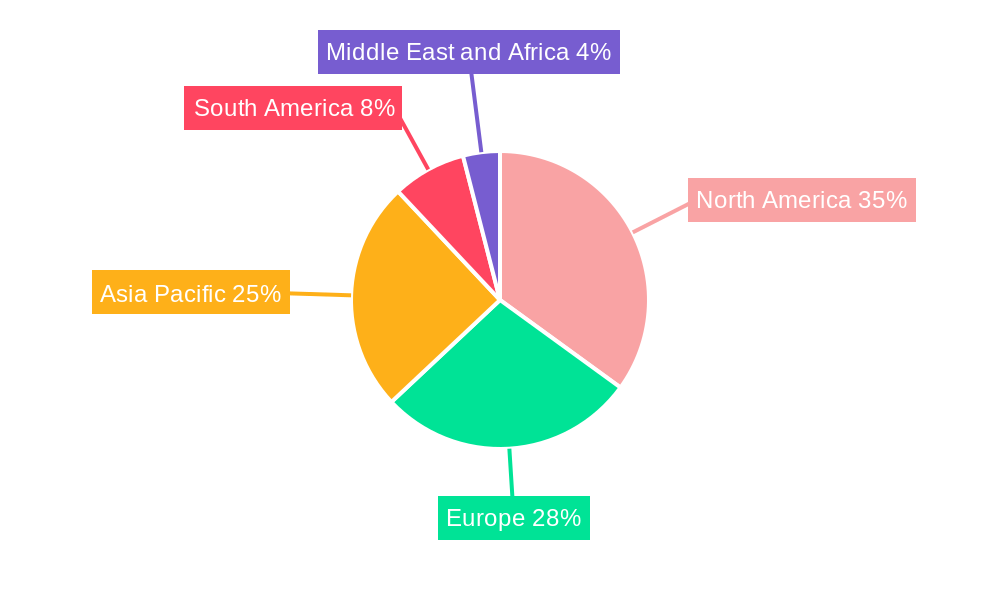
However, market restraints exist. Price sensitivity among consumers remains a challenge, particularly in developing economies. Furthermore, regulatory hurdles and concerns regarding the efficacy of certain functional ingredients may influence market growth. Despite these challenges, the long-term outlook for the functional water market remains positive, driven by sustained consumer demand for healthy and convenient hydration solutions. The Asia Pacific region, with its large and growing population, is poised for substantial growth, presenting considerable opportunities for market expansion. The continued focus on product innovation and targeted marketing strategies will be crucial in unlocking the market's full potential in the coming years. Companies are focusing on sustainable packaging options and increasing their sustainability efforts to resonate with eco-conscious consumers.
Functional Water Market: A Comprehensive Market Report (2019-2033)
This comprehensive report provides an in-depth analysis of the global functional water market, offering invaluable insights for industry professionals, investors, and strategic decision-makers. Covering the period from 2019 to 2033, with a focus on 2025 as the base and estimated year, this report meticulously examines market dynamics, growth trends, competitive landscape, and future opportunities within the parent beverage market and its functional water child market segment. The market size is presented in million units.
Functional Water Market Dynamics & Structure
The functional water market is experiencing robust growth, driven by increasing health consciousness and the demand for convenient, healthy hydration options. Market concentration is moderately high, with key players like PepsiCo and Coca-Cola holding significant shares, although smaller, innovative brands are also making inroads. Technological advancements in flavoring, fortification, and packaging are key innovation drivers. Regulatory frameworks concerning labeling and health claims influence product development and marketing strategies. Competitive substitutes include traditional bottled water, sports drinks, and juices. The end-user demographic is largely comprised of health-conscious millennials and Gen Z consumers, with growing adoption across age groups. M&A activity has been moderate, with larger players acquiring smaller brands to expand their portfolio and market reach.
- Market Concentration: Moderately high, with top 5 players holding approximately xx% market share (2024).
- Innovation Drivers: Novel flavor profiles, enhanced nutrient delivery systems, sustainable packaging.
- Regulatory Landscape: Stringent labeling requirements for health claims influence market strategies.
- Competitive Substitutes: Traditional bottled water, sports drinks, enhanced beverages.
- End-User Demographics: Health-conscious millennials and Gen Z, expanding to broader demographics.
- M&A Activity: Moderate level, driven by portfolio diversification and market expansion. xx M&A deals recorded in 2024.
Functional Water Market Growth Trends & Insights
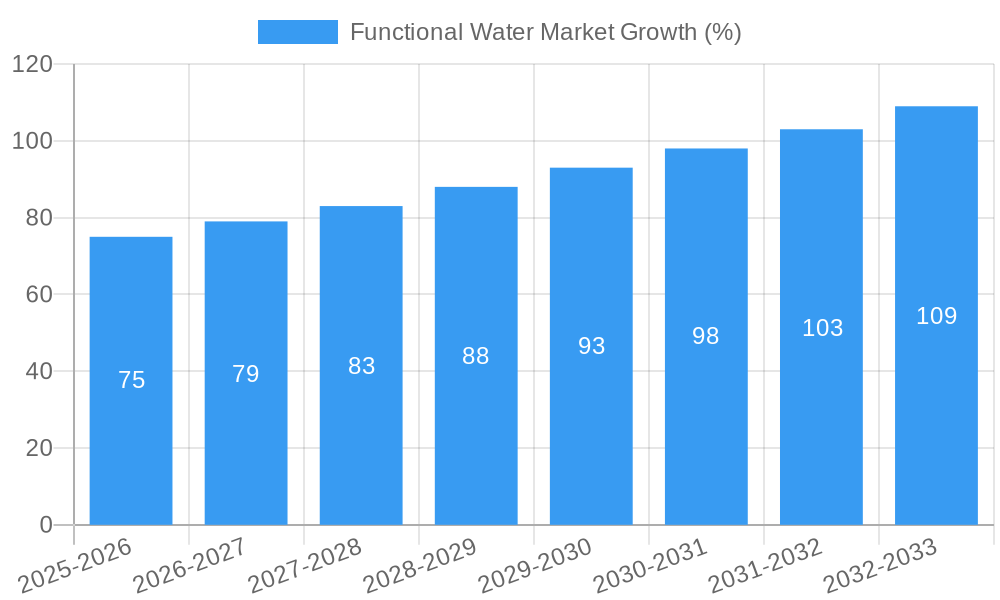
The functional water market exhibits a strong growth trajectory, fueled by rising health awareness and changing consumer preferences. The market size experienced significant expansion from xx million units in 2019 to xx million units in 2024, reflecting a CAGR of xx%. This growth is projected to continue, reaching xx million units by 2033, with a forecasted CAGR of xx% during 2025-2033. Market penetration is increasing steadily, particularly in developed markets, although significant untapped potential remains in emerging economies. Technological disruptions, such as innovative packaging and enhanced nutrient delivery systems, further contribute to market expansion. Consumer behavior shifts towards healthier lifestyles and convenience are key drivers of this growth. The increasing demand for natural and organic functional water is a notable trend.
Dominant Regions, Countries, or Segments in Functional Water Market
North America currently holds the largest market share within the functional water market, driven by high consumer awareness and spending power. Within product types, the vitamin-infused segment shows the highest growth potential, followed by protein-enhanced waters and other functional types. Distribution channels are diversifying, with hypermarkets/supermarkets maintaining a significant share, while online retail stores are experiencing rapid growth.
- Leading Region: North America (xx% market share in 2024).
- Leading Product Type: Vitamin-infused water (xx% market share in 2024).
- Fastest-Growing Distribution Channel: Online retail stores (xx% CAGR 2025-2033).
- Key Drivers: Rising health consciousness, increasing disposable incomes, expanding retail infrastructure.
Functional Water Market Product Landscape
The functional water market showcases a diverse range of products, from vitamin-infused waters to protein-enhanced and other functional types. Product innovation focuses on unique flavor profiles, enhanced nutrient delivery systems, and sustainable packaging. Key performance metrics include consumer preference, shelf life, and health benefits. Unique selling propositions (USPs) often highlight natural ingredients, superior taste, and specific health advantages. Technological advancements in manufacturing and packaging are continuously improving product quality and sustainability.
Key Drivers, Barriers & Challenges in Functional Water Market
Key Drivers:
- Increasing health and wellness awareness among consumers.
- Growing demand for convenient and healthy hydration options.
- Technological advancements in product formulation and packaging.
- Expanding distribution channels, including online retail.
Challenges & Restraints:
- Intense competition from established beverage brands and new entrants.
- Regulatory hurdles and stringent labeling requirements for health claims.
- Supply chain disruptions and fluctuations in raw material costs (estimated impact: xx% reduction in profit margins in 2024).
Emerging Opportunities in Functional Water Market
- Expansion into emerging markets with untapped potential.
- Development of functional waters targeting niche health needs.
- Focus on sustainable packaging and eco-friendly production processes.
- Strategic partnerships and collaborations to broaden market reach.
Growth Accelerators in the Functional Water Market Industry
Strategic partnerships between beverage companies and health and wellness brands are driving significant growth, along with technological breakthroughs in functional ingredient delivery and innovative packaging solutions. The expansion of distribution channels and an increasing focus on sustainability are also strong catalysts for market growth.
Key Players Shaping the Functional Water Market Market
- PepsiCo Inc (Soulboost)
- Danone SA (Salus Żywiec Zdrój Volvic Aqua Font Vella Mizone)
- Flow Beverage Corp (Flow)
- CENTR Brands Corporation (Centr)
- The Coca-Cola Co (Glaceau Smartwater)
- Hint Inc
- Function Drinks (function)
- Dr Pepper Snapple Group Inc (Canada Dry Schweppes Core Hydration bai)
- Balance Water Company (Balance Water)
- Disruptive Beverages Inc (Ayala's Herbal Water)
Notable Milestones in Functional Water Market Sector
- July 2022: Flow Beverage Corp. launched its Flow Vitamin-Infused Water line in three new organic flavors.
- October 2022: CENTR Brands Corporation expanded its portfolio with CENTR Enhanced sparkling water.
- September 2023: PepsiCo renewed its partnership with UC Berkeley, reinforcing its commitment to sustainability and wellness.
In-Depth Functional Water Market Market Outlook
The functional water market is poised for sustained growth, driven by ongoing health and wellness trends and innovative product development. Strategic partnerships, expansion into new markets, and a focus on sustainable practices will shape future market dynamics. The market's potential remains significant, presenting lucrative opportunities for both established players and new entrants.
Functional Water Market Segmentation
-
1. Product Type
- 1.1. Vitamin
- 1.2. Protein
- 1.3. Other Product Types
-
2. Distribution Channel
- 2.1. Hypermarkets/Supermarkets
- 2.2. Convenience/Grocery Stores
- 2.3. Online Retail Stores
- 2.4. Other Distribution Channels
Functional Water Market Segmentation By Geography
-
1. North America
- 1.1. United States
- 1.2. Canada
- 1.3. Mexico
- 1.4. Rest of North America
-
2. Europe
- 2.1. United Kingdom
- 2.2. Germany
- 2.3. Spain
- 2.4. France
- 2.5. Italy
- 2.6. Russia
- 2.7. Rest of Europe
-
3. Asia Pacific
- 3.1. China
- 3.2. Japan
- 3.3. India
- 3.4. Australia
- 3.5. Rest of Asia Pacific
-
4. South America
- 4.1. Brazil
- 4.2. Argentina
- 4.3. Rest of South America
-
5. Middle East and Africa
- 5.1. United Arab Emirates
- 5.2. South Africa
- 5.3. Rest of Middle East and Africa
Functional Water Market REPORT HIGHLIGHTS
| Aspects | Details |
|---|---|
| Study Period | 2019-2033 |
| Base Year | 2024 |
| Estimated Year | 2025 |
| Forecast Period | 2025-2033 |
| Historical Period | 2019-2024 |
| Growth Rate | CAGR of 4.97% from 2019-2033 |
| Segmentation |
|
Table of Contents
- 1. Introduction
- 1.1. Research Scope
- 1.2. Market Segmentation
- 1.3. Research Methodology
- 1.4. Definitions and Assumptions
- 2. Executive Summary
- 2.1. Introduction
- 3. Market Dynamics
- 3.1. Introduction
- 3.2. Market Drivers
- 3.2.1. Increasing consumer awareness about health and wellness is driving the demand for functional waters
- 3.3. Market Restrains
- 3.3.1. Higher production costs due to premium ingredients and advanced processing methods
- 3.4. Market Trends
- 3.4.1. Eco-friendly packaging and sustainable sourcing of ingredients
- 4. Market Factor Analysis
- 4.1. Porters Five Forces
- 4.2. Supply/Value Chain
- 4.3. PESTEL analysis
- 4.4. Market Entropy
- 4.5. Patent/Trademark Analysis
- 5. Global Functional Water Market Analysis, Insights and Forecast, 2019-2031
- 5.1. Market Analysis, Insights and Forecast - by Product Type
- 5.1.1. Vitamin
- 5.1.2. Protein
- 5.1.3. Other Product Types
- 5.2. Market Analysis, Insights and Forecast - by Distribution Channel
- 5.2.1. Hypermarkets/Supermarkets
- 5.2.2. Convenience/Grocery Stores
- 5.2.3. Online Retail Stores
- 5.2.4. Other Distribution Channels
- 5.3. Market Analysis, Insights and Forecast - by Region
- 5.3.1. North America
- 5.3.2. Europe
- 5.3.3. Asia Pacific
- 5.3.4. South America
- 5.3.5. Middle East and Africa
- 5.1. Market Analysis, Insights and Forecast - by Product Type
- 6. North America Functional Water Market Analysis, Insights and Forecast, 2019-2031
- 6.1. Market Analysis, Insights and Forecast - by Product Type
- 6.1.1. Vitamin
- 6.1.2. Protein
- 6.1.3. Other Product Types
- 6.2. Market Analysis, Insights and Forecast - by Distribution Channel
- 6.2.1. Hypermarkets/Supermarkets
- 6.2.2. Convenience/Grocery Stores
- 6.2.3. Online Retail Stores
- 6.2.4. Other Distribution Channels
- 6.1. Market Analysis, Insights and Forecast - by Product Type
- 7. Europe Functional Water Market Analysis, Insights and Forecast, 2019-2031
- 7.1. Market Analysis, Insights and Forecast - by Product Type
- 7.1.1. Vitamin
- 7.1.2. Protein
- 7.1.3. Other Product Types
- 7.2. Market Analysis, Insights and Forecast - by Distribution Channel
- 7.2.1. Hypermarkets/Supermarkets
- 7.2.2. Convenience/Grocery Stores
- 7.2.3. Online Retail Stores
- 7.2.4. Other Distribution Channels
- 7.1. Market Analysis, Insights and Forecast - by Product Type
- 8. Asia Pacific Functional Water Market Analysis, Insights and Forecast, 2019-2031
- 8.1. Market Analysis, Insights and Forecast - by Product Type
- 8.1.1. Vitamin
- 8.1.2. Protein
- 8.1.3. Other Product Types
- 8.2. Market Analysis, Insights and Forecast - by Distribution Channel
- 8.2.1. Hypermarkets/Supermarkets
- 8.2.2. Convenience/Grocery Stores
- 8.2.3. Online Retail Stores
- 8.2.4. Other Distribution Channels
- 8.1. Market Analysis, Insights and Forecast - by Product Type
- 9. South America Functional Water Market Analysis, Insights and Forecast, 2019-2031
- 9.1. Market Analysis, Insights and Forecast - by Product Type
- 9.1.1. Vitamin
- 9.1.2. Protein
- 9.1.3. Other Product Types
- 9.2. Market Analysis, Insights and Forecast - by Distribution Channel
- 9.2.1. Hypermarkets/Supermarkets
- 9.2.2. Convenience/Grocery Stores
- 9.2.3. Online Retail Stores
- 9.2.4. Other Distribution Channels
- 9.1. Market Analysis, Insights and Forecast - by Product Type
- 10. Middle East and Africa Functional Water Market Analysis, Insights and Forecast, 2019-2031
- 10.1. Market Analysis, Insights and Forecast - by Product Type
- 10.1.1. Vitamin
- 10.1.2. Protein
- 10.1.3. Other Product Types
- 10.2. Market Analysis, Insights and Forecast - by Distribution Channel
- 10.2.1. Hypermarkets/Supermarkets
- 10.2.2. Convenience/Grocery Stores
- 10.2.3. Online Retail Stores
- 10.2.4. Other Distribution Channels
- 10.1. Market Analysis, Insights and Forecast - by Product Type
- 11. North America Functional Water Market Analysis, Insights and Forecast, 2019-2031
- 11.1. Market Analysis, Insights and Forecast - By Country/Sub-region
- 11.1.1 United States
- 11.1.2 Canada
- 11.1.3 Mexico
- 11.1.4 Rest of North America
- 12. Europe Functional Water Market Analysis, Insights and Forecast, 2019-2031
- 12.1. Market Analysis, Insights and Forecast - By Country/Sub-region
- 12.1.1 United Kingdom
- 12.1.2 Germany
- 12.1.3 Spain
- 12.1.4 France
- 12.1.5 Italy
- 12.1.6 Russia
- 12.1.7 Rest of Europe
- 13. Asia Pacific Functional Water Market Analysis, Insights and Forecast, 2019-2031
- 13.1. Market Analysis, Insights and Forecast - By Country/Sub-region
- 13.1.1 China
- 13.1.2 Japan
- 13.1.3 India
- 13.1.4 Australia
- 13.1.5 Rest of Asia Pacific
- 14. South America Functional Water Market Analysis, Insights and Forecast, 2019-2031
- 14.1. Market Analysis, Insights and Forecast - By Country/Sub-region
- 14.1.1 Brazil
- 14.1.2 Argentina
- 14.1.3 Rest of South America
- 15. Middle East and Africa Functional Water Market Analysis, Insights and Forecast, 2019-2031
- 15.1. Market Analysis, Insights and Forecast - By Country/Sub-region
- 15.1.1 United Arab Emirates
- 15.1.2 South Africa
- 15.1.3 Rest of Middle East and Africa
- 16. Competitive Analysis
- 16.1. Global Market Share Analysis 2024
- 16.2. Company Profiles
- 16.2.1 PepsiCo Inc (Soulboost)
- 16.2.1.1. Overview
- 16.2.1.2. Products
- 16.2.1.3. SWOT Analysis
- 16.2.1.4. Recent Developments
- 16.2.1.5. Financials (Based on Availability)
- 16.2.2 Danone SA (Salus Żywiec Zdrój Volvic Aqua Font Vella Mizone)
- 16.2.2.1. Overview
- 16.2.2.2. Products
- 16.2.2.3. SWOT Analysis
- 16.2.2.4. Recent Developments
- 16.2.2.5. Financials (Based on Availability)
- 16.2.3 Flow Beverage Corp (Flow)
- 16.2.3.1. Overview
- 16.2.3.2. Products
- 16.2.3.3. SWOT Analysis
- 16.2.3.4. Recent Developments
- 16.2.3.5. Financials (Based on Availability)
- 16.2.4 CENTR Brands Corporation (Centr)
- 16.2.4.1. Overview
- 16.2.4.2. Products
- 16.2.4.3. SWOT Analysis
- 16.2.4.4. Recent Developments
- 16.2.4.5. Financials (Based on Availability)
- 16.2.5 The Coca-Cola Co (Glaceau Smartwater)
- 16.2.5.1. Overview
- 16.2.5.2. Products
- 16.2.5.3. SWOT Analysis
- 16.2.5.4. Recent Developments
- 16.2.5.5. Financials (Based on Availability)
- 16.2.6 Hint Inc
- 16.2.6.1. Overview
- 16.2.6.2. Products
- 16.2.6.3. SWOT Analysis
- 16.2.6.4. Recent Developments
- 16.2.6.5. Financials (Based on Availability)
- 16.2.7 Function Drinks (function)
- 16.2.7.1. Overview
- 16.2.7.2. Products
- 16.2.7.3. SWOT Analysis
- 16.2.7.4. Recent Developments
- 16.2.7.5. Financials (Based on Availability)
- 16.2.8 Dr Pepper Snapple Group Inc (Canada Dry Schweppes Core Hydration bai)
- 16.2.8.1. Overview
- 16.2.8.2. Products
- 16.2.8.3. SWOT Analysis
- 16.2.8.4. Recent Developments
- 16.2.8.5. Financials (Based on Availability)
- 16.2.9 Balance Water Company (Balance Water)
- 16.2.9.1. Overview
- 16.2.9.2. Products
- 16.2.9.3. SWOT Analysis
- 16.2.9.4. Recent Developments
- 16.2.9.5. Financials (Based on Availability)
- 16.2.10 Disruptive Beverages Inc (Ayala's Herbal Water)
- 16.2.10.1. Overview
- 16.2.10.2. Products
- 16.2.10.3. SWOT Analysis
- 16.2.10.4. Recent Developments
- 16.2.10.5. Financials (Based on Availability)
- 16.2.1 PepsiCo Inc (Soulboost)
List of Figures
- Figure 1: Global Functional Water Market Revenue Breakdown (Million, %) by Region 2024 & 2032
- Figure 2: Global Functional Water Market Volume Breakdown (K Litres, %) by Region 2024 & 2032
- Figure 3: North America Functional Water Market Revenue (Million), by Country 2024 & 2032
- Figure 4: North America Functional Water Market Volume (K Litres), by Country 2024 & 2032
- Figure 5: North America Functional Water Market Revenue Share (%), by Country 2024 & 2032
- Figure 6: North America Functional Water Market Volume Share (%), by Country 2024 & 2032
- Figure 7: Europe Functional Water Market Revenue (Million), by Country 2024 & 2032
- Figure 8: Europe Functional Water Market Volume (K Litres), by Country 2024 & 2032
- Figure 9: Europe Functional Water Market Revenue Share (%), by Country 2024 & 2032
- Figure 10: Europe Functional Water Market Volume Share (%), by Country 2024 & 2032
- Figure 11: Asia Pacific Functional Water Market Revenue (Million), by Country 2024 & 2032
- Figure 12: Asia Pacific Functional Water Market Volume (K Litres), by Country 2024 & 2032
- Figure 13: Asia Pacific Functional Water Market Revenue Share (%), by Country 2024 & 2032
- Figure 14: Asia Pacific Functional Water Market Volume Share (%), by Country 2024 & 2032
- Figure 15: South America Functional Water Market Revenue (Million), by Country 2024 & 2032
- Figure 16: South America Functional Water Market Volume (K Litres), by Country 2024 & 2032
- Figure 17: South America Functional Water Market Revenue Share (%), by Country 2024 & 2032
- Figure 18: South America Functional Water Market Volume Share (%), by Country 2024 & 2032
- Figure 19: Middle East and Africa Functional Water Market Revenue (Million), by Country 2024 & 2032
- Figure 20: Middle East and Africa Functional Water Market Volume (K Litres), by Country 2024 & 2032
- Figure 21: Middle East and Africa Functional Water Market Revenue Share (%), by Country 2024 & 2032
- Figure 22: Middle East and Africa Functional Water Market Volume Share (%), by Country 2024 & 2032
- Figure 23: North America Functional Water Market Revenue (Million), by Product Type 2024 & 2032
- Figure 24: North America Functional Water Market Volume (K Litres), by Product Type 2024 & 2032
- Figure 25: North America Functional Water Market Revenue Share (%), by Product Type 2024 & 2032
- Figure 26: North America Functional Water Market Volume Share (%), by Product Type 2024 & 2032
- Figure 27: North America Functional Water Market Revenue (Million), by Distribution Channel 2024 & 2032
- Figure 28: North America Functional Water Market Volume (K Litres), by Distribution Channel 2024 & 2032
- Figure 29: North America Functional Water Market Revenue Share (%), by Distribution Channel 2024 & 2032
- Figure 30: North America Functional Water Market Volume Share (%), by Distribution Channel 2024 & 2032
- Figure 31: North America Functional Water Market Revenue (Million), by Country 2024 & 2032
- Figure 32: North America Functional Water Market Volume (K Litres), by Country 2024 & 2032
- Figure 33: North America Functional Water Market Revenue Share (%), by Country 2024 & 2032
- Figure 34: North America Functional Water Market Volume Share (%), by Country 2024 & 2032
- Figure 35: Europe Functional Water Market Revenue (Million), by Product Type 2024 & 2032
- Figure 36: Europe Functional Water Market Volume (K Litres), by Product Type 2024 & 2032
- Figure 37: Europe Functional Water Market Revenue Share (%), by Product Type 2024 & 2032
- Figure 38: Europe Functional Water Market Volume Share (%), by Product Type 2024 & 2032
- Figure 39: Europe Functional Water Market Revenue (Million), by Distribution Channel 2024 & 2032
- Figure 40: Europe Functional Water Market Volume (K Litres), by Distribution Channel 2024 & 2032
- Figure 41: Europe Functional Water Market Revenue Share (%), by Distribution Channel 2024 & 2032
- Figure 42: Europe Functional Water Market Volume Share (%), by Distribution Channel 2024 & 2032
- Figure 43: Europe Functional Water Market Revenue (Million), by Country 2024 & 2032
- Figure 44: Europe Functional Water Market Volume (K Litres), by Country 2024 & 2032
- Figure 45: Europe Functional Water Market Revenue Share (%), by Country 2024 & 2032
- Figure 46: Europe Functional Water Market Volume Share (%), by Country 2024 & 2032
- Figure 47: Asia Pacific Functional Water Market Revenue (Million), by Product Type 2024 & 2032
- Figure 48: Asia Pacific Functional Water Market Volume (K Litres), by Product Type 2024 & 2032
- Figure 49: Asia Pacific Functional Water Market Revenue Share (%), by Product Type 2024 & 2032
- Figure 50: Asia Pacific Functional Water Market Volume Share (%), by Product Type 2024 & 2032
- Figure 51: Asia Pacific Functional Water Market Revenue (Million), by Distribution Channel 2024 & 2032
- Figure 52: Asia Pacific Functional Water Market Volume (K Litres), by Distribution Channel 2024 & 2032
- Figure 53: Asia Pacific Functional Water Market Revenue Share (%), by Distribution Channel 2024 & 2032
- Figure 54: Asia Pacific Functional Water Market Volume Share (%), by Distribution Channel 2024 & 2032
- Figure 55: Asia Pacific Functional Water Market Revenue (Million), by Country 2024 & 2032
- Figure 56: Asia Pacific Functional Water Market Volume (K Litres), by Country 2024 & 2032
- Figure 57: Asia Pacific Functional Water Market Revenue Share (%), by Country 2024 & 2032
- Figure 58: Asia Pacific Functional Water Market Volume Share (%), by Country 2024 & 2032
- Figure 59: South America Functional Water Market Revenue (Million), by Product Type 2024 & 2032
- Figure 60: South America Functional Water Market Volume (K Litres), by Product Type 2024 & 2032
- Figure 61: South America Functional Water Market Revenue Share (%), by Product Type 2024 & 2032
- Figure 62: South America Functional Water Market Volume Share (%), by Product Type 2024 & 2032
- Figure 63: South America Functional Water Market Revenue (Million), by Distribution Channel 2024 & 2032
- Figure 64: South America Functional Water Market Volume (K Litres), by Distribution Channel 2024 & 2032
- Figure 65: South America Functional Water Market Revenue Share (%), by Distribution Channel 2024 & 2032
- Figure 66: South America Functional Water Market Volume Share (%), by Distribution Channel 2024 & 2032
- Figure 67: South America Functional Water Market Revenue (Million), by Country 2024 & 2032
- Figure 68: South America Functional Water Market Volume (K Litres), by Country 2024 & 2032
- Figure 69: South America Functional Water Market Revenue Share (%), by Country 2024 & 2032
- Figure 70: South America Functional Water Market Volume Share (%), by Country 2024 & 2032
- Figure 71: Middle East and Africa Functional Water Market Revenue (Million), by Product Type 2024 & 2032
- Figure 72: Middle East and Africa Functional Water Market Volume (K Litres), by Product Type 2024 & 2032
- Figure 73: Middle East and Africa Functional Water Market Revenue Share (%), by Product Type 2024 & 2032
- Figure 74: Middle East and Africa Functional Water Market Volume Share (%), by Product Type 2024 & 2032
- Figure 75: Middle East and Africa Functional Water Market Revenue (Million), by Distribution Channel 2024 & 2032
- Figure 76: Middle East and Africa Functional Water Market Volume (K Litres), by Distribution Channel 2024 & 2032
- Figure 77: Middle East and Africa Functional Water Market Revenue Share (%), by Distribution Channel 2024 & 2032
- Figure 78: Middle East and Africa Functional Water Market Volume Share (%), by Distribution Channel 2024 & 2032
- Figure 79: Middle East and Africa Functional Water Market Revenue (Million), by Country 2024 & 2032
- Figure 80: Middle East and Africa Functional Water Market Volume (K Litres), by Country 2024 & 2032
- Figure 81: Middle East and Africa Functional Water Market Revenue Share (%), by Country 2024 & 2032
- Figure 82: Middle East and Africa Functional Water Market Volume Share (%), by Country 2024 & 2032
List of Tables
- Table 1: Global Functional Water Market Revenue Million Forecast, by Region 2019 & 2032
- Table 2: Global Functional Water Market Volume K Litres Forecast, by Region 2019 & 2032
- Table 3: Global Functional Water Market Revenue Million Forecast, by Product Type 2019 & 2032
- Table 4: Global Functional Water Market Volume K Litres Forecast, by Product Type 2019 & 2032
- Table 5: Global Functional Water Market Revenue Million Forecast, by Distribution Channel 2019 & 2032
- Table 6: Global Functional Water Market Volume K Litres Forecast, by Distribution Channel 2019 & 2032
- Table 7: Global Functional Water Market Revenue Million Forecast, by Region 2019 & 2032
- Table 8: Global Functional Water Market Volume K Litres Forecast, by Region 2019 & 2032
- Table 9: Global Functional Water Market Revenue Million Forecast, by Country 2019 & 2032
- Table 10: Global Functional Water Market Volume K Litres Forecast, by Country 2019 & 2032
- Table 11: United States Functional Water Market Revenue (Million) Forecast, by Application 2019 & 2032
- Table 12: United States Functional Water Market Volume (K Litres) Forecast, by Application 2019 & 2032
- Table 13: Canada Functional Water Market Revenue (Million) Forecast, by Application 2019 & 2032
- Table 14: Canada Functional Water Market Volume (K Litres) Forecast, by Application 2019 & 2032
- Table 15: Mexico Functional Water Market Revenue (Million) Forecast, by Application 2019 & 2032
- Table 16: Mexico Functional Water Market Volume (K Litres) Forecast, by Application 2019 & 2032
- Table 17: Rest of North America Functional Water Market Revenue (Million) Forecast, by Application 2019 & 2032
- Table 18: Rest of North America Functional Water Market Volume (K Litres) Forecast, by Application 2019 & 2032
- Table 19: Global Functional Water Market Revenue Million Forecast, by Country 2019 & 2032
- Table 20: Global Functional Water Market Volume K Litres Forecast, by Country 2019 & 2032
- Table 21: United Kingdom Functional Water Market Revenue (Million) Forecast, by Application 2019 & 2032
- Table 22: United Kingdom Functional Water Market Volume (K Litres) Forecast, by Application 2019 & 2032
- Table 23: Germany Functional Water Market Revenue (Million) Forecast, by Application 2019 & 2032
- Table 24: Germany Functional Water Market Volume (K Litres) Forecast, by Application 2019 & 2032
- Table 25: Spain Functional Water Market Revenue (Million) Forecast, by Application 2019 & 2032
- Table 26: Spain Functional Water Market Volume (K Litres) Forecast, by Application 2019 & 2032
- Table 27: France Functional Water Market Revenue (Million) Forecast, by Application 2019 & 2032
- Table 28: France Functional Water Market Volume (K Litres) Forecast, by Application 2019 & 2032
- Table 29: Italy Functional Water Market Revenue (Million) Forecast, by Application 2019 & 2032
- Table 30: Italy Functional Water Market Volume (K Litres) Forecast, by Application 2019 & 2032
- Table 31: Russia Functional Water Market Revenue (Million) Forecast, by Application 2019 & 2032
- Table 32: Russia Functional Water Market Volume (K Litres) Forecast, by Application 2019 & 2032
- Table 33: Rest of Europe Functional Water Market Revenue (Million) Forecast, by Application 2019 & 2032
- Table 34: Rest of Europe Functional Water Market Volume (K Litres) Forecast, by Application 2019 & 2032
- Table 35: Global Functional Water Market Revenue Million Forecast, by Country 2019 & 2032
- Table 36: Global Functional Water Market Volume K Litres Forecast, by Country 2019 & 2032
- Table 37: China Functional Water Market Revenue (Million) Forecast, by Application 2019 & 2032
- Table 38: China Functional Water Market Volume (K Litres) Forecast, by Application 2019 & 2032
- Table 39: Japan Functional Water Market Revenue (Million) Forecast, by Application 2019 & 2032
- Table 40: Japan Functional Water Market Volume (K Litres) Forecast, by Application 2019 & 2032
- Table 41: India Functional Water Market Revenue (Million) Forecast, by Application 2019 & 2032
- Table 42: India Functional Water Market Volume (K Litres) Forecast, by Application 2019 & 2032
- Table 43: Australia Functional Water Market Revenue (Million) Forecast, by Application 2019 & 2032
- Table 44: Australia Functional Water Market Volume (K Litres) Forecast, by Application 2019 & 2032
- Table 45: Rest of Asia Pacific Functional Water Market Revenue (Million) Forecast, by Application 2019 & 2032
- Table 46: Rest of Asia Pacific Functional Water Market Volume (K Litres) Forecast, by Application 2019 & 2032
- Table 47: Global Functional Water Market Revenue Million Forecast, by Country 2019 & 2032
- Table 48: Global Functional Water Market Volume K Litres Forecast, by Country 2019 & 2032
- Table 49: Brazil Functional Water Market Revenue (Million) Forecast, by Application 2019 & 2032
- Table 50: Brazil Functional Water Market Volume (K Litres) Forecast, by Application 2019 & 2032
- Table 51: Argentina Functional Water Market Revenue (Million) Forecast, by Application 2019 & 2032
- Table 52: Argentina Functional Water Market Volume (K Litres) Forecast, by Application 2019 & 2032
- Table 53: Rest of South America Functional Water Market Revenue (Million) Forecast, by Application 2019 & 2032
- Table 54: Rest of South America Functional Water Market Volume (K Litres) Forecast, by Application 2019 & 2032
- Table 55: Global Functional Water Market Revenue Million Forecast, by Country 2019 & 2032
- Table 56: Global Functional Water Market Volume K Litres Forecast, by Country 2019 & 2032
- Table 57: United Arab Emirates Functional Water Market Revenue (Million) Forecast, by Application 2019 & 2032
- Table 58: United Arab Emirates Functional Water Market Volume (K Litres) Forecast, by Application 2019 & 2032
- Table 59: South Africa Functional Water Market Revenue (Million) Forecast, by Application 2019 & 2032
- Table 60: South Africa Functional Water Market Volume (K Litres) Forecast, by Application 2019 & 2032
- Table 61: Rest of Middle East and Africa Functional Water Market Revenue (Million) Forecast, by Application 2019 & 2032
- Table 62: Rest of Middle East and Africa Functional Water Market Volume (K Litres) Forecast, by Application 2019 & 2032
- Table 63: Global Functional Water Market Revenue Million Forecast, by Product Type 2019 & 2032
- Table 64: Global Functional Water Market Volume K Litres Forecast, by Product Type 2019 & 2032
- Table 65: Global Functional Water Market Revenue Million Forecast, by Distribution Channel 2019 & 2032
- Table 66: Global Functional Water Market Volume K Litres Forecast, by Distribution Channel 2019 & 2032
- Table 67: Global Functional Water Market Revenue Million Forecast, by Country 2019 & 2032
- Table 68: Global Functional Water Market Volume K Litres Forecast, by Country 2019 & 2032
- Table 69: United States Functional Water Market Revenue (Million) Forecast, by Application 2019 & 2032
- Table 70: United States Functional Water Market Volume (K Litres) Forecast, by Application 2019 & 2032
- Table 71: Canada Functional Water Market Revenue (Million) Forecast, by Application 2019 & 2032
- Table 72: Canada Functional Water Market Volume (K Litres) Forecast, by Application 2019 & 2032
- Table 73: Mexico Functional Water Market Revenue (Million) Forecast, by Application 2019 & 2032
- Table 74: Mexico Functional Water Market Volume (K Litres) Forecast, by Application 2019 & 2032
- Table 75: Rest of North America Functional Water Market Revenue (Million) Forecast, by Application 2019 & 2032
- Table 76: Rest of North America Functional Water Market Volume (K Litres) Forecast, by Application 2019 & 2032
- Table 77: Global Functional Water Market Revenue Million Forecast, by Product Type 2019 & 2032
- Table 78: Global Functional Water Market Volume K Litres Forecast, by Product Type 2019 & 2032
- Table 79: Global Functional Water Market Revenue Million Forecast, by Distribution Channel 2019 & 2032
- Table 80: Global Functional Water Market Volume K Litres Forecast, by Distribution Channel 2019 & 2032
- Table 81: Global Functional Water Market Revenue Million Forecast, by Country 2019 & 2032
- Table 82: Global Functional Water Market Volume K Litres Forecast, by Country 2019 & 2032
- Table 83: United Kingdom Functional Water Market Revenue (Million) Forecast, by Application 2019 & 2032
- Table 84: United Kingdom Functional Water Market Volume (K Litres) Forecast, by Application 2019 & 2032
- Table 85: Germany Functional Water Market Revenue (Million) Forecast, by Application 2019 & 2032
- Table 86: Germany Functional Water Market Volume (K Litres) Forecast, by Application 2019 & 2032
- Table 87: Spain Functional Water Market Revenue (Million) Forecast, by Application 2019 & 2032
- Table 88: Spain Functional Water Market Volume (K Litres) Forecast, by Application 2019 & 2032
- Table 89: France Functional Water Market Revenue (Million) Forecast, by Application 2019 & 2032
- Table 90: France Functional Water Market Volume (K Litres) Forecast, by Application 2019 & 2032
- Table 91: Italy Functional Water Market Revenue (Million) Forecast, by Application 2019 & 2032
- Table 92: Italy Functional Water Market Volume (K Litres) Forecast, by Application 2019 & 2032
- Table 93: Russia Functional Water Market Revenue (Million) Forecast, by Application 2019 & 2032
- Table 94: Russia Functional Water Market Volume (K Litres) Forecast, by Application 2019 & 2032
- Table 95: Rest of Europe Functional Water Market Revenue (Million) Forecast, by Application 2019 & 2032
- Table 96: Rest of Europe Functional Water Market Volume (K Litres) Forecast, by Application 2019 & 2032
- Table 97: Global Functional Water Market Revenue Million Forecast, by Product Type 2019 & 2032
- Table 98: Global Functional Water Market Volume K Litres Forecast, by Product Type 2019 & 2032
- Table 99: Global Functional Water Market Revenue Million Forecast, by Distribution Channel 2019 & 2032
- Table 100: Global Functional Water Market Volume K Litres Forecast, by Distribution Channel 2019 & 2032
- Table 101: Global Functional Water Market Revenue Million Forecast, by Country 2019 & 2032
- Table 102: Global Functional Water Market Volume K Litres Forecast, by Country 2019 & 2032
- Table 103: China Functional Water Market Revenue (Million) Forecast, by Application 2019 & 2032
- Table 104: China Functional Water Market Volume (K Litres) Forecast, by Application 2019 & 2032
- Table 105: Japan Functional Water Market Revenue (Million) Forecast, by Application 2019 & 2032
- Table 106: Japan Functional Water Market Volume (K Litres) Forecast, by Application 2019 & 2032
- Table 107: India Functional Water Market Revenue (Million) Forecast, by Application 2019 & 2032
- Table 108: India Functional Water Market Volume (K Litres) Forecast, by Application 2019 & 2032
- Table 109: Australia Functional Water Market Revenue (Million) Forecast, by Application 2019 & 2032
- Table 110: Australia Functional Water Market Volume (K Litres) Forecast, by Application 2019 & 2032
- Table 111: Rest of Asia Pacific Functional Water Market Revenue (Million) Forecast, by Application 2019 & 2032
- Table 112: Rest of Asia Pacific Functional Water Market Volume (K Litres) Forecast, by Application 2019 & 2032
- Table 113: Global Functional Water Market Revenue Million Forecast, by Product Type 2019 & 2032
- Table 114: Global Functional Water Market Volume K Litres Forecast, by Product Type 2019 & 2032
- Table 115: Global Functional Water Market Revenue Million Forecast, by Distribution Channel 2019 & 2032
- Table 116: Global Functional Water Market Volume K Litres Forecast, by Distribution Channel 2019 & 2032
- Table 117: Global Functional Water Market Revenue Million Forecast, by Country 2019 & 2032
- Table 118: Global Functional Water Market Volume K Litres Forecast, by Country 2019 & 2032
- Table 119: Brazil Functional Water Market Revenue (Million) Forecast, by Application 2019 & 2032
- Table 120: Brazil Functional Water Market Volume (K Litres) Forecast, by Application 2019 & 2032
- Table 121: Argentina Functional Water Market Revenue (Million) Forecast, by Application 2019 & 2032
- Table 122: Argentina Functional Water Market Volume (K Litres) Forecast, by Application 2019 & 2032
- Table 123: Rest of South America Functional Water Market Revenue (Million) Forecast, by Application 2019 & 2032
- Table 124: Rest of South America Functional Water Market Volume (K Litres) Forecast, by Application 2019 & 2032
- Table 125: Global Functional Water Market Revenue Million Forecast, by Product Type 2019 & 2032
- Table 126: Global Functional Water Market Volume K Litres Forecast, by Product Type 2019 & 2032
- Table 127: Global Functional Water Market Revenue Million Forecast, by Distribution Channel 2019 & 2032
- Table 128: Global Functional Water Market Volume K Litres Forecast, by Distribution Channel 2019 & 2032
- Table 129: Global Functional Water Market Revenue Million Forecast, by Country 2019 & 2032
- Table 130: Global Functional Water Market Volume K Litres Forecast, by Country 2019 & 2032
- Table 131: United Arab Emirates Functional Water Market Revenue (Million) Forecast, by Application 2019 & 2032
- Table 132: United Arab Emirates Functional Water Market Volume (K Litres) Forecast, by Application 2019 & 2032
- Table 133: South Africa Functional Water Market Revenue (Million) Forecast, by Application 2019 & 2032
- Table 134: South Africa Functional Water Market Volume (K Litres) Forecast, by Application 2019 & 2032
- Table 135: Rest of Middle East and Africa Functional Water Market Revenue (Million) Forecast, by Application 2019 & 2032
- Table 136: Rest of Middle East and Africa Functional Water Market Volume (K Litres) Forecast, by Application 2019 & 2032
Frequently Asked Questions
1. What is the projected Compound Annual Growth Rate (CAGR) of the Functional Water Market?
The projected CAGR is approximately 4.97%.
2. Which companies are prominent players in the Functional Water Market?
Key companies in the market include PepsiCo Inc (Soulboost), Danone SA (Salus Żywiec Zdrój Volvic Aqua Font Vella Mizone), Flow Beverage Corp (Flow), CENTR Brands Corporation (Centr), The Coca-Cola Co (Glaceau Smartwater), Hint Inc , Function Drinks (function), Dr Pepper Snapple Group Inc (Canada Dry Schweppes Core Hydration bai), Balance Water Company (Balance Water), Disruptive Beverages Inc (Ayala's Herbal Water).
3. What are the main segments of the Functional Water Market?
The market segments include Product Type, Distribution Channel.
4. Can you provide details about the market size?
The market size is estimated to be USD XX Million as of 2022.
5. What are some drivers contributing to market growth?
Increasing consumer awareness about health and wellness is driving the demand for functional waters.
6. What are the notable trends driving market growth?
Eco-friendly packaging and sustainable sourcing of ingredients.
7. Are there any restraints impacting market growth?
Higher production costs due to premium ingredients and advanced processing methods.
8. Can you provide examples of recent developments in the market?
September 2023: UC Berkeley and PepsiCo renewed their partnership, confirming PepsiCo as the official beverage partner of the campus for the next decade. This extended collaboration with PepsiCo is anticipated to enhance the company's support for Berkeley's sustainability, equity, and health and wellness initiatives. Under the agreement and in alignment with PepsiCo's pep+ (PepsiCo Positive) business model, the company will provide energy-efficient beverage distribution and cooling equipment to Berkeley, along with financial support for campus sustainability priorities.
9. What pricing options are available for accessing the report?
Pricing options include single-user, multi-user, and enterprise licenses priced at USD 4750, USD 5250, and USD 8750 respectively.
10. Is the market size provided in terms of value or volume?
The market size is provided in terms of value, measured in Million and volume, measured in K Litres.
11. Are there any specific market keywords associated with the report?
Yes, the market keyword associated with the report is "Functional Water Market," which aids in identifying and referencing the specific market segment covered.
12. How do I determine which pricing option suits my needs best?
The pricing options vary based on user requirements and access needs. Individual users may opt for single-user licenses, while businesses requiring broader access may choose multi-user or enterprise licenses for cost-effective access to the report.
13. Are there any additional resources or data provided in the Functional Water Market report?
While the report offers comprehensive insights, it's advisable to review the specific contents or supplementary materials provided to ascertain if additional resources or data are available.
14. How can I stay updated on further developments or reports in the Functional Water Market?
To stay informed about further developments, trends, and reports in the Functional Water Market, consider subscribing to industry newsletters, following relevant companies and organizations, or regularly checking reputable industry news sources and publications.
Methodology
Step 1 - Identification of Relevant Samples Size from Population Database


Step 2 - Approaches for Defining Global Market Size (Value, Volume* & Price*)

Note*: In applicable scenarios
Step 3 - Data Sources
Primary Research
- Web Analytics
- Survey Reports
- Research Institute
- Latest Research Reports
- Opinion Leaders
Secondary Research
- Annual Reports
- White Paper
- Latest Press Release
- Industry Association
- Paid Database
- Investor Presentations

Step 4 - Data Triangulation
Involves using different sources of information in order to increase the validity of a study
These sources are likely to be stakeholders in a program - participants, other researchers, program staff, other community members, and so on.
Then we put all data in single framework & apply various statistical tools to find out the dynamic on the market.
During the analysis stage, feedback from the stakeholder groups would be compared to determine areas of agreement as well as areas of divergence


