
Key Insights
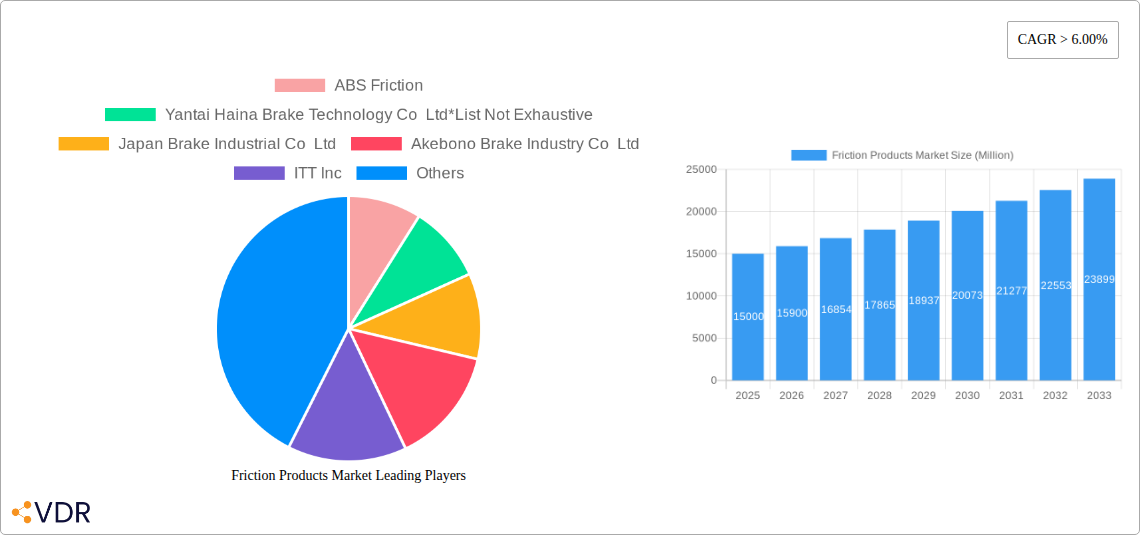
The global friction products market is experiencing robust growth, projected to maintain a Compound Annual Growth Rate (CAGR) exceeding 6% from 2025 to 2033. This expansion is driven by several key factors. The automotive industry, a major consumer of friction products, is witnessing continuous growth, particularly in emerging economies like India and China, fueling demand for braking systems and clutch components. Furthermore, the increasing adoption of advanced materials like ceramic and sintered metals in high-performance applications, such as aerospace and railway systems, is significantly contributing to market expansion. The shift towards electric vehicles (EVs) presents both opportunities and challenges; while the overall number of friction components might decrease per vehicle, the demand for high-performance, durable materials capable of withstanding increased braking torque remains strong. Government regulations promoting vehicle safety and stricter emission standards further bolster the market. However, fluctuations in raw material prices and the potential for substitution with alternative braking technologies represent significant restraints. The market is segmented by application (clutch and brake systems dominating), end-user industry (automotive holding the largest share), type (discs and pads being prevalent), and material (with a gradual shift away from asbestos towards ceramic and sintered metals). Leading players such as Brembo, Akebono, and others are engaged in continuous innovation and strategic partnerships to maintain their market positions.
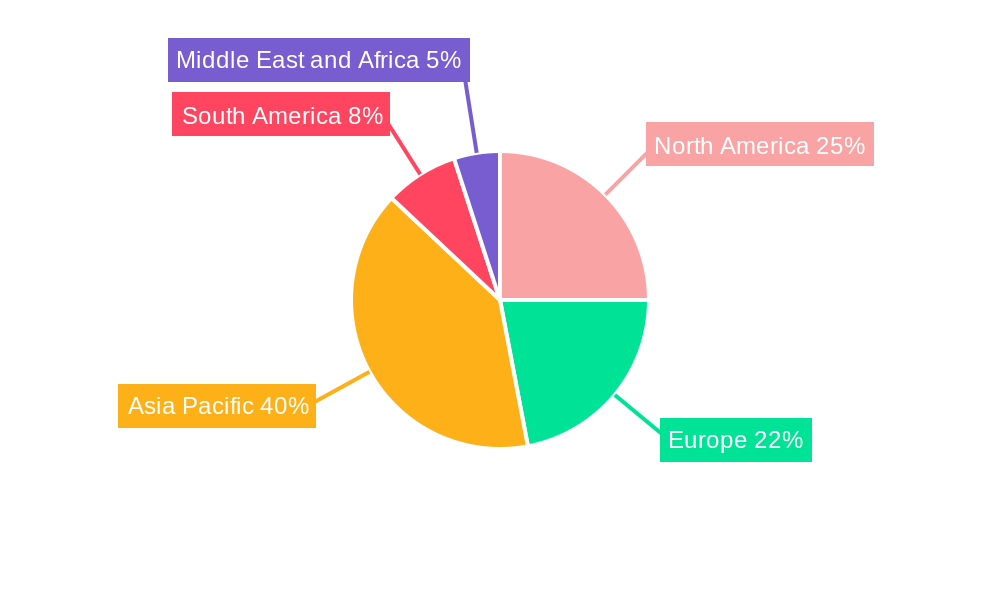
The regional distribution of the friction products market reflects global manufacturing and automotive trends. Asia-Pacific, driven by strong automotive production in China and India, commands a substantial market share. North America and Europe maintain significant presence owing to their established automotive industries and advanced technology adoption. While South America and the Middle East & Africa represent smaller shares currently, they are poised for growth as their automotive sectors develop. The market segmentation allows for tailored strategies by manufacturers, focusing on specific applications, end-user needs, and material innovations to capitalize on evolving market trends and technological advancements within the broader automotive and industrial sectors. The forecast period (2025-2033) signifies a period of consistent growth, although future market analysis should account for potential shifts in technological preferences and global economic conditions.
This comprehensive report provides a detailed analysis of the global Friction Products Market, encompassing its current state, future trends, and key players. The market is segmented by application (Clutch and Brake Systems, Gear Tooth Systems, Other Applications), end-user industry (Automotive, Railway, Aerospace, Mining, Other End-user Industries), type (Discs, Pads, Blocks, Linings, Other Types), and material (Ceramic, Asbestos, Semi-metallic, Sintered Metals, Aramid Fibers, Other Materials). The report covers the historical period (2019-2024), base year (2025), estimated year (2025), and forecast period (2025-2033), providing valuable insights for businesses operating in this dynamic sector. The total market size in 2025 is estimated at xx Million units.
Friction Products Market Dynamics & Structure
The Friction Products Market is characterized by a moderately concentrated landscape, with a few major players holding significant market share. Technological innovation, driven by the need for enhanced performance and durability, is a key driver. Stringent regulatory frameworks concerning material safety and environmental impact influence product development and manufacturing processes. Competitive substitutes, such as alternative braking systems, pose a challenge, while the growing demand from various end-user industries fuels market expansion. Mergers and acquisitions (M&A) activity is relatively frequent, with an estimated xx number of deals in the last 5 years, primarily focused on consolidating market positions and expanding product portfolios.
- Market Concentration: Moderately concentrated, with top 5 players holding approximately xx% market share in 2025.
- Technological Innovation: Focus on advanced materials (e.g., carbon ceramics), improved friction coefficients, and enhanced thermal stability.
- Regulatory Frameworks: Stringent safety and environmental regulations impacting material composition and manufacturing processes.
- Competitive Substitutes: Emergence of alternative braking technologies (e.g., regenerative braking) posing a competitive threat.
- End-User Demographics: Growing demand from the automotive and railway sectors, driven by increasing vehicle production and infrastructure development.
- M&A Trends: xx M&A deals in the last 5 years, predominantly aimed at expanding geographical reach and product portfolios. Consolidation is expected to continue.
Friction Products Market Growth Trends & Insights
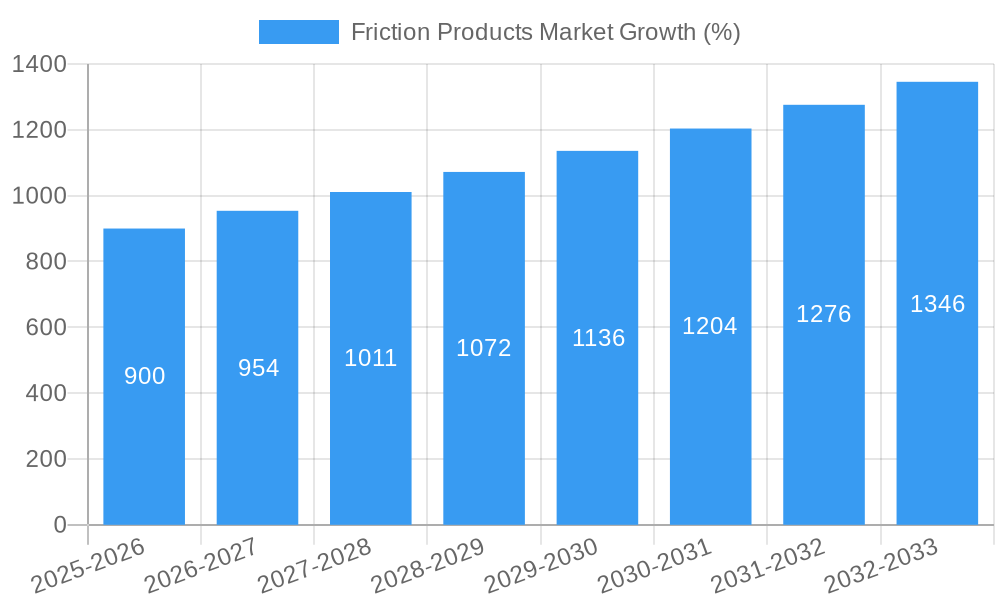
The Friction Products Market has witnessed consistent growth over the past few years, driven primarily by increasing demand from the automotive industry. The market size is projected to expand significantly over the forecast period. The compound annual growth rate (CAGR) is estimated at xx% from 2025 to 2033, fueled by factors such as rising vehicle production, infrastructure development in emerging economies, and the increasing adoption of advanced braking technologies. Technological disruptions, such as the development of new materials and manufacturing processes, are expected to further accelerate market growth. Consumer behavior shifts toward higher-performance and environmentally friendly vehicles are also shaping market dynamics. Market penetration is currently at xx%, projected to reach xx% by 2033.
Dominant Regions, Countries, or Segments in Friction Products Market
The Automotive segment within the end-user industry dominates the Friction Products Market, accounting for approximately xx% of the total market share in 2025. Geographically, Asia-Pacific is the leading region, fueled by robust automotive production and infrastructure development. Within Asia-Pacific, China and Japan are key contributors to market growth.
Key Drivers:
- Strong growth in the automotive sector, especially in emerging markets.
- Increased investment in railway infrastructure development globally.
- Rising demand for advanced braking systems in the aerospace and mining industries.
- Favorable government policies and economic growth in certain regions.
Dominance Factors:
- High vehicle production rates in Asia-Pacific.
- Expanding railway networks in developing countries.
- Stringent safety regulations driving demand for high-performance friction products.
- Growing adoption of electric and hybrid vehicles.
Friction Products Market Product Landscape
The friction products market offers a diverse range of products, including discs, pads, blocks, and linings, each tailored to specific applications and end-user requirements. Recent innovations focus on enhanced material compositions, improved friction coefficients, and increased thermal stability to meet the demands of high-performance vehicles and demanding industrial applications. Unique selling propositions emphasize extended lifespan, reduced noise and vibration, and superior braking performance under various operating conditions. Technological advancements include the incorporation of advanced materials like ceramic composites and sintered metals to optimize friction characteristics and durability.
Key Drivers, Barriers & Challenges in Friction Products Market
Key Drivers:
- Growing demand from the automotive industry, particularly in emerging markets.
- Increasing adoption of advanced braking systems in various sectors.
- Technological advancements in material science leading to improved product performance.
- Stringent safety regulations driving the demand for high-quality friction products.
Challenges and Restraints:
- Fluctuations in raw material prices impacting manufacturing costs.
- Environmental regulations restricting the use of certain materials (e.g., asbestos).
- Intense competition among manufacturers leading to price pressure.
- Supply chain disruptions impacting production and availability. A recent xx% increase in raw material costs caused a xx% decrease in production volume in Q3 2024.
Emerging Opportunities in Friction Products Market
Emerging opportunities include the growing demand for electric and hybrid vehicles, requiring advanced braking systems with enhanced energy recovery capabilities. The development of friction materials with improved environmental friendliness and sustainable sourcing is also gaining traction. Untapped markets in developing economies present significant growth potential. Innovative applications in robotics and automation are emerging as well.
Growth Accelerators in the Friction Products Market Industry
Technological breakthroughs in material science, enabling the development of high-performance friction products with superior durability and efficiency, are key growth accelerators. Strategic partnerships between manufacturers and technology providers further enhance innovation and market penetration. Market expansion strategies targeting developing economies and diverse end-user industries contribute to long-term growth prospects.
Key Players Shaping the Friction Products Market Market
- ABS Friction
- Yantai Haina Brake Technology Co Ltd
- Japan Brake Industrial Co Ltd
- Akebono Brake Industry Co Ltd
- ITT Inc
- ANAND Group
- Miba AG
- Tenneco Inc
- Brembo SpA
- Nisshinbo Holdings Inc
Notable Milestones in Friction Products Market Sector
- 2022-Q4: Brembo SpA launched a new line of high-performance ceramic brake pads for electric vehicles.
- 2023-Q2: Akebono Brake Industry Co Ltd partnered with a material science company to develop a new friction material with improved thermal stability.
- 2024-Q1: ABS Friction acquired a smaller competitor, expanding its market share in North America.
In-Depth Friction Products Market Market Outlook
The Friction Products Market is poised for continued growth, driven by technological advancements, strategic partnerships, and expanding end-user applications. The increasing demand for environmentally friendly friction materials and the growing adoption of advanced braking systems in various sectors will further contribute to market expansion. Strategic opportunities lie in investing in research and development, forming strategic partnerships, and expanding into untapped markets, particularly in developing economies. This growth will be further enhanced by continuing efforts to improve sustainability within the manufacturing process.
Friction Products Market Segmentation
-
1. Type
- 1.1. Discs
- 1.2. Pads
- 1.3. Blocks
- 1.4. Linings
- 1.5. Other Types
-
2. Material
- 2.1. Ceramic
- 2.2. Asbestos
- 2.3. Semi-metallic
- 2.4. Sintered Metals
- 2.5. Aramid Fibers
- 2.6. Other Materials
-
3. Application
- 3.1. Clutch and Brake Systems
- 3.2. Gear Tooth Systems
- 3.3. Other Applications
-
4. End-user Industry
- 4.1. Automotive
- 4.2. Railway
- 4.3. Aerospace
- 4.4. Mining
- 4.5. Other End-user Industries
Friction Products Market Segmentation By Geography
-
1. Asia Pacific
- 1.1. China
- 1.2. India
- 1.3. Japan
- 1.4. South Korea
- 1.5. Rest of Asia Pacific
-
2. North America
- 2.1. United States
- 2.2. Canada
- 2.3. Mexico
-
3. Europe
- 3.1. Germany
- 3.2. United Kingdom
- 3.3. France
- 3.4. Italy
- 3.5. Rest of Europe
-
4. South America
- 4.1. Brazil
- 4.2. Argentina
- 4.3. Rest of South America
-
5. Middle East and Africa
- 5.1. Saudi Arabia
- 5.2. South Africa
- 5.3. Rest of Middle East and Africa
Friction Products Market REPORT HIGHLIGHTS
| Aspects | Details |
|---|---|
| Study Period | 2019-2033 |
| Base Year | 2024 |
| Estimated Year | 2025 |
| Forecast Period | 2025-2033 |
| Historical Period | 2019-2024 |
| Growth Rate | CAGR of > 6.00% from 2019-2033 |
| Segmentation |
|
Table of Contents
- 1. Introduction
- 1.1. Research Scope
- 1.2. Market Segmentation
- 1.3. Research Methodology
- 1.4. Definitions and Assumptions
- 2. Executive Summary
- 2.1. Introduction
- 3. Market Dynamics
- 3.1. Introduction
- 3.2. Market Drivers
- 3.2.1. Growing Need for Industrial Machinery; Other Drivers
- 3.3. Market Restrains
- 3.3.1. High Maintenance and Cost of Friction Materials; Impact of COVID-19 Outbreak; Other Restraints
- 3.4. Market Trends
- 3.4.1. The Automotive Industry Dominates the Market
- 4. Market Factor Analysis
- 4.1. Porters Five Forces
- 4.2. Supply/Value Chain
- 4.3. PESTEL analysis
- 4.4. Market Entropy
- 4.5. Patent/Trademark Analysis
- 5. Global Friction Products Market Analysis, Insights and Forecast, 2019-2031
- 5.1. Market Analysis, Insights and Forecast - by Type
- 5.1.1. Discs
- 5.1.2. Pads
- 5.1.3. Blocks
- 5.1.4. Linings
- 5.1.5. Other Types
- 5.2. Market Analysis, Insights and Forecast - by Material
- 5.2.1. Ceramic
- 5.2.2. Asbestos
- 5.2.3. Semi-metallic
- 5.2.4. Sintered Metals
- 5.2.5. Aramid Fibers
- 5.2.6. Other Materials
- 5.3. Market Analysis, Insights and Forecast - by Application
- 5.3.1. Clutch and Brake Systems
- 5.3.2. Gear Tooth Systems
- 5.3.3. Other Applications
- 5.4. Market Analysis, Insights and Forecast - by End-user Industry
- 5.4.1. Automotive
- 5.4.2. Railway
- 5.4.3. Aerospace
- 5.4.4. Mining
- 5.4.5. Other End-user Industries
- 5.5. Market Analysis, Insights and Forecast - by Region
- 5.5.1. Asia Pacific
- 5.5.2. North America
- 5.5.3. Europe
- 5.5.4. South America
- 5.5.5. Middle East and Africa
- 5.1. Market Analysis, Insights and Forecast - by Type
- 6. Asia Pacific Friction Products Market Analysis, Insights and Forecast, 2019-2031
- 6.1. Market Analysis, Insights and Forecast - by Type
- 6.1.1. Discs
- 6.1.2. Pads
- 6.1.3. Blocks
- 6.1.4. Linings
- 6.1.5. Other Types
- 6.2. Market Analysis, Insights and Forecast - by Material
- 6.2.1. Ceramic
- 6.2.2. Asbestos
- 6.2.3. Semi-metallic
- 6.2.4. Sintered Metals
- 6.2.5. Aramid Fibers
- 6.2.6. Other Materials
- 6.3. Market Analysis, Insights and Forecast - by Application
- 6.3.1. Clutch and Brake Systems
- 6.3.2. Gear Tooth Systems
- 6.3.3. Other Applications
- 6.4. Market Analysis, Insights and Forecast - by End-user Industry
- 6.4.1. Automotive
- 6.4.2. Railway
- 6.4.3. Aerospace
- 6.4.4. Mining
- 6.4.5. Other End-user Industries
- 6.1. Market Analysis, Insights and Forecast - by Type
- 7. North America Friction Products Market Analysis, Insights and Forecast, 2019-2031
- 7.1. Market Analysis, Insights and Forecast - by Type
- 7.1.1. Discs
- 7.1.2. Pads
- 7.1.3. Blocks
- 7.1.4. Linings
- 7.1.5. Other Types
- 7.2. Market Analysis, Insights and Forecast - by Material
- 7.2.1. Ceramic
- 7.2.2. Asbestos
- 7.2.3. Semi-metallic
- 7.2.4. Sintered Metals
- 7.2.5. Aramid Fibers
- 7.2.6. Other Materials
- 7.3. Market Analysis, Insights and Forecast - by Application
- 7.3.1. Clutch and Brake Systems
- 7.3.2. Gear Tooth Systems
- 7.3.3. Other Applications
- 7.4. Market Analysis, Insights and Forecast - by End-user Industry
- 7.4.1. Automotive
- 7.4.2. Railway
- 7.4.3. Aerospace
- 7.4.4. Mining
- 7.4.5. Other End-user Industries
- 7.1. Market Analysis, Insights and Forecast - by Type
- 8. Europe Friction Products Market Analysis, Insights and Forecast, 2019-2031
- 8.1. Market Analysis, Insights and Forecast - by Type
- 8.1.1. Discs
- 8.1.2. Pads
- 8.1.3. Blocks
- 8.1.4. Linings
- 8.1.5. Other Types
- 8.2. Market Analysis, Insights and Forecast - by Material
- 8.2.1. Ceramic
- 8.2.2. Asbestos
- 8.2.3. Semi-metallic
- 8.2.4. Sintered Metals
- 8.2.5. Aramid Fibers
- 8.2.6. Other Materials
- 8.3. Market Analysis, Insights and Forecast - by Application
- 8.3.1. Clutch and Brake Systems
- 8.3.2. Gear Tooth Systems
- 8.3.3. Other Applications
- 8.4. Market Analysis, Insights and Forecast - by End-user Industry
- 8.4.1. Automotive
- 8.4.2. Railway
- 8.4.3. Aerospace
- 8.4.4. Mining
- 8.4.5. Other End-user Industries
- 8.1. Market Analysis, Insights and Forecast - by Type
- 9. South America Friction Products Market Analysis, Insights and Forecast, 2019-2031
- 9.1. Market Analysis, Insights and Forecast - by Type
- 9.1.1. Discs
- 9.1.2. Pads
- 9.1.3. Blocks
- 9.1.4. Linings
- 9.1.5. Other Types
- 9.2. Market Analysis, Insights and Forecast - by Material
- 9.2.1. Ceramic
- 9.2.2. Asbestos
- 9.2.3. Semi-metallic
- 9.2.4. Sintered Metals
- 9.2.5. Aramid Fibers
- 9.2.6. Other Materials
- 9.3. Market Analysis, Insights and Forecast - by Application
- 9.3.1. Clutch and Brake Systems
- 9.3.2. Gear Tooth Systems
- 9.3.3. Other Applications
- 9.4. Market Analysis, Insights and Forecast - by End-user Industry
- 9.4.1. Automotive
- 9.4.2. Railway
- 9.4.3. Aerospace
- 9.4.4. Mining
- 9.4.5. Other End-user Industries
- 9.1. Market Analysis, Insights and Forecast - by Type
- 10. Middle East and Africa Friction Products Market Analysis, Insights and Forecast, 2019-2031
- 10.1. Market Analysis, Insights and Forecast - by Type
- 10.1.1. Discs
- 10.1.2. Pads
- 10.1.3. Blocks
- 10.1.4. Linings
- 10.1.5. Other Types
- 10.2. Market Analysis, Insights and Forecast - by Material
- 10.2.1. Ceramic
- 10.2.2. Asbestos
- 10.2.3. Semi-metallic
- 10.2.4. Sintered Metals
- 10.2.5. Aramid Fibers
- 10.2.6. Other Materials
- 10.3. Market Analysis, Insights and Forecast - by Application
- 10.3.1. Clutch and Brake Systems
- 10.3.2. Gear Tooth Systems
- 10.3.3. Other Applications
- 10.4. Market Analysis, Insights and Forecast - by End-user Industry
- 10.4.1. Automotive
- 10.4.2. Railway
- 10.4.3. Aerospace
- 10.4.4. Mining
- 10.4.5. Other End-user Industries
- 10.1. Market Analysis, Insights and Forecast - by Type
- 11. Asia Pacific Friction Products Market Analysis, Insights and Forecast, 2019-2031
- 11.1. Market Analysis, Insights and Forecast - By Country/Sub-region
- 11.1.1 China
- 11.1.2 India
- 11.1.3 Japan
- 11.1.4 South Korea
- 11.1.5 Rest of Asia Pacific
- 12. North America Friction Products Market Analysis, Insights and Forecast, 2019-2031
- 12.1. Market Analysis, Insights and Forecast - By Country/Sub-region
- 12.1.1 United States
- 12.1.2 Canada
- 12.1.3 Mexico
- 13. Europe Friction Products Market Analysis, Insights and Forecast, 2019-2031
- 13.1. Market Analysis, Insights and Forecast - By Country/Sub-region
- 13.1.1 Germany
- 13.1.2 United Kingdom
- 13.1.3 France
- 13.1.4 Italy
- 13.1.5 Rest of Europe
- 14. South America Friction Products Market Analysis, Insights and Forecast, 2019-2031
- 14.1. Market Analysis, Insights and Forecast - By Country/Sub-region
- 14.1.1 Brazil
- 14.1.2 Argentina
- 14.1.3 Rest of South America
- 15. Middle East and Africa Friction Products Market Analysis, Insights and Forecast, 2019-2031
- 15.1. Market Analysis, Insights and Forecast - By Country/Sub-region
- 15.1.1 Saudi Arabia
- 15.1.2 South Africa
- 15.1.3 Rest of Middle East and Africa
- 16. Competitive Analysis
- 16.1. Global Market Share Analysis 2024
- 16.2. Company Profiles
- 16.2.1 ABS Friction
- 16.2.1.1. Overview
- 16.2.1.2. Products
- 16.2.1.3. SWOT Analysis
- 16.2.1.4. Recent Developments
- 16.2.1.5. Financials (Based on Availability)
- 16.2.2 Yantai Haina Brake Technology Co Ltd*List Not Exhaustive
- 16.2.2.1. Overview
- 16.2.2.2. Products
- 16.2.2.3. SWOT Analysis
- 16.2.2.4. Recent Developments
- 16.2.2.5. Financials (Based on Availability)
- 16.2.3 Japan Brake Industrial Co Ltd
- 16.2.3.1. Overview
- 16.2.3.2. Products
- 16.2.3.3. SWOT Analysis
- 16.2.3.4. Recent Developments
- 16.2.3.5. Financials (Based on Availability)
- 16.2.4 Akebono Brake Industry Co Ltd
- 16.2.4.1. Overview
- 16.2.4.2. Products
- 16.2.4.3. SWOT Analysis
- 16.2.4.4. Recent Developments
- 16.2.4.5. Financials (Based on Availability)
- 16.2.5 ITT Inc
- 16.2.5.1. Overview
- 16.2.5.2. Products
- 16.2.5.3. SWOT Analysis
- 16.2.5.4. Recent Developments
- 16.2.5.5. Financials (Based on Availability)
- 16.2.6 ANAND Group
- 16.2.6.1. Overview
- 16.2.6.2. Products
- 16.2.6.3. SWOT Analysis
- 16.2.6.4. Recent Developments
- 16.2.6.5. Financials (Based on Availability)
- 16.2.7 Miba AG
- 16.2.7.1. Overview
- 16.2.7.2. Products
- 16.2.7.3. SWOT Analysis
- 16.2.7.4. Recent Developments
- 16.2.7.5. Financials (Based on Availability)
- 16.2.8 Tenneco Inc
- 16.2.8.1. Overview
- 16.2.8.2. Products
- 16.2.8.3. SWOT Analysis
- 16.2.8.4. Recent Developments
- 16.2.8.5. Financials (Based on Availability)
- 16.2.9 Brembo SpA
- 16.2.9.1. Overview
- 16.2.9.2. Products
- 16.2.9.3. SWOT Analysis
- 16.2.9.4. Recent Developments
- 16.2.9.5. Financials (Based on Availability)
- 16.2.10 Nisshinbo Holdings Inc
- 16.2.10.1. Overview
- 16.2.10.2. Products
- 16.2.10.3. SWOT Analysis
- 16.2.10.4. Recent Developments
- 16.2.10.5. Financials (Based on Availability)
- 16.2.1 ABS Friction
List of Figures
- Figure 1: Global Friction Products Market Revenue Breakdown (Million, %) by Region 2024 & 2032
- Figure 2: Asia Pacific Friction Products Market Revenue (Million), by Country 2024 & 2032
- Figure 3: Asia Pacific Friction Products Market Revenue Share (%), by Country 2024 & 2032
- Figure 4: North America Friction Products Market Revenue (Million), by Country 2024 & 2032
- Figure 5: North America Friction Products Market Revenue Share (%), by Country 2024 & 2032
- Figure 6: Europe Friction Products Market Revenue (Million), by Country 2024 & 2032
- Figure 7: Europe Friction Products Market Revenue Share (%), by Country 2024 & 2032
- Figure 8: South America Friction Products Market Revenue (Million), by Country 2024 & 2032
- Figure 9: South America Friction Products Market Revenue Share (%), by Country 2024 & 2032
- Figure 10: Middle East and Africa Friction Products Market Revenue (Million), by Country 2024 & 2032
- Figure 11: Middle East and Africa Friction Products Market Revenue Share (%), by Country 2024 & 2032
- Figure 12: Asia Pacific Friction Products Market Revenue (Million), by Type 2024 & 2032
- Figure 13: Asia Pacific Friction Products Market Revenue Share (%), by Type 2024 & 2032
- Figure 14: Asia Pacific Friction Products Market Revenue (Million), by Material 2024 & 2032
- Figure 15: Asia Pacific Friction Products Market Revenue Share (%), by Material 2024 & 2032
- Figure 16: Asia Pacific Friction Products Market Revenue (Million), by Application 2024 & 2032
- Figure 17: Asia Pacific Friction Products Market Revenue Share (%), by Application 2024 & 2032
- Figure 18: Asia Pacific Friction Products Market Revenue (Million), by End-user Industry 2024 & 2032
- Figure 19: Asia Pacific Friction Products Market Revenue Share (%), by End-user Industry 2024 & 2032
- Figure 20: Asia Pacific Friction Products Market Revenue (Million), by Country 2024 & 2032
- Figure 21: Asia Pacific Friction Products Market Revenue Share (%), by Country 2024 & 2032
- Figure 22: North America Friction Products Market Revenue (Million), by Type 2024 & 2032
- Figure 23: North America Friction Products Market Revenue Share (%), by Type 2024 & 2032
- Figure 24: North America Friction Products Market Revenue (Million), by Material 2024 & 2032
- Figure 25: North America Friction Products Market Revenue Share (%), by Material 2024 & 2032
- Figure 26: North America Friction Products Market Revenue (Million), by Application 2024 & 2032
- Figure 27: North America Friction Products Market Revenue Share (%), by Application 2024 & 2032
- Figure 28: North America Friction Products Market Revenue (Million), by End-user Industry 2024 & 2032
- Figure 29: North America Friction Products Market Revenue Share (%), by End-user Industry 2024 & 2032
- Figure 30: North America Friction Products Market Revenue (Million), by Country 2024 & 2032
- Figure 31: North America Friction Products Market Revenue Share (%), by Country 2024 & 2032
- Figure 32: Europe Friction Products Market Revenue (Million), by Type 2024 & 2032
- Figure 33: Europe Friction Products Market Revenue Share (%), by Type 2024 & 2032
- Figure 34: Europe Friction Products Market Revenue (Million), by Material 2024 & 2032
- Figure 35: Europe Friction Products Market Revenue Share (%), by Material 2024 & 2032
- Figure 36: Europe Friction Products Market Revenue (Million), by Application 2024 & 2032
- Figure 37: Europe Friction Products Market Revenue Share (%), by Application 2024 & 2032
- Figure 38: Europe Friction Products Market Revenue (Million), by End-user Industry 2024 & 2032
- Figure 39: Europe Friction Products Market Revenue Share (%), by End-user Industry 2024 & 2032
- Figure 40: Europe Friction Products Market Revenue (Million), by Country 2024 & 2032
- Figure 41: Europe Friction Products Market Revenue Share (%), by Country 2024 & 2032
- Figure 42: South America Friction Products Market Revenue (Million), by Type 2024 & 2032
- Figure 43: South America Friction Products Market Revenue Share (%), by Type 2024 & 2032
- Figure 44: South America Friction Products Market Revenue (Million), by Material 2024 & 2032
- Figure 45: South America Friction Products Market Revenue Share (%), by Material 2024 & 2032
- Figure 46: South America Friction Products Market Revenue (Million), by Application 2024 & 2032
- Figure 47: South America Friction Products Market Revenue Share (%), by Application 2024 & 2032
- Figure 48: South America Friction Products Market Revenue (Million), by End-user Industry 2024 & 2032
- Figure 49: South America Friction Products Market Revenue Share (%), by End-user Industry 2024 & 2032
- Figure 50: South America Friction Products Market Revenue (Million), by Country 2024 & 2032
- Figure 51: South America Friction Products Market Revenue Share (%), by Country 2024 & 2032
- Figure 52: Middle East and Africa Friction Products Market Revenue (Million), by Type 2024 & 2032
- Figure 53: Middle East and Africa Friction Products Market Revenue Share (%), by Type 2024 & 2032
- Figure 54: Middle East and Africa Friction Products Market Revenue (Million), by Material 2024 & 2032
- Figure 55: Middle East and Africa Friction Products Market Revenue Share (%), by Material 2024 & 2032
- Figure 56: Middle East and Africa Friction Products Market Revenue (Million), by Application 2024 & 2032
- Figure 57: Middle East and Africa Friction Products Market Revenue Share (%), by Application 2024 & 2032
- Figure 58: Middle East and Africa Friction Products Market Revenue (Million), by End-user Industry 2024 & 2032
- Figure 59: Middle East and Africa Friction Products Market Revenue Share (%), by End-user Industry 2024 & 2032
- Figure 60: Middle East and Africa Friction Products Market Revenue (Million), by Country 2024 & 2032
- Figure 61: Middle East and Africa Friction Products Market Revenue Share (%), by Country 2024 & 2032
List of Tables
- Table 1: Global Friction Products Market Revenue Million Forecast, by Region 2019 & 2032
- Table 2: Global Friction Products Market Revenue Million Forecast, by Type 2019 & 2032
- Table 3: Global Friction Products Market Revenue Million Forecast, by Material 2019 & 2032
- Table 4: Global Friction Products Market Revenue Million Forecast, by Application 2019 & 2032
- Table 5: Global Friction Products Market Revenue Million Forecast, by End-user Industry 2019 & 2032
- Table 6: Global Friction Products Market Revenue Million Forecast, by Region 2019 & 2032
- Table 7: Global Friction Products Market Revenue Million Forecast, by Country 2019 & 2032
- Table 8: China Friction Products Market Revenue (Million) Forecast, by Application 2019 & 2032
- Table 9: India Friction Products Market Revenue (Million) Forecast, by Application 2019 & 2032
- Table 10: Japan Friction Products Market Revenue (Million) Forecast, by Application 2019 & 2032
- Table 11: South Korea Friction Products Market Revenue (Million) Forecast, by Application 2019 & 2032
- Table 12: Rest of Asia Pacific Friction Products Market Revenue (Million) Forecast, by Application 2019 & 2032
- Table 13: Global Friction Products Market Revenue Million Forecast, by Country 2019 & 2032
- Table 14: United States Friction Products Market Revenue (Million) Forecast, by Application 2019 & 2032
- Table 15: Canada Friction Products Market Revenue (Million) Forecast, by Application 2019 & 2032
- Table 16: Mexico Friction Products Market Revenue (Million) Forecast, by Application 2019 & 2032
- Table 17: Global Friction Products Market Revenue Million Forecast, by Country 2019 & 2032
- Table 18: Germany Friction Products Market Revenue (Million) Forecast, by Application 2019 & 2032
- Table 19: United Kingdom Friction Products Market Revenue (Million) Forecast, by Application 2019 & 2032
- Table 20: France Friction Products Market Revenue (Million) Forecast, by Application 2019 & 2032
- Table 21: Italy Friction Products Market Revenue (Million) Forecast, by Application 2019 & 2032
- Table 22: Rest of Europe Friction Products Market Revenue (Million) Forecast, by Application 2019 & 2032
- Table 23: Global Friction Products Market Revenue Million Forecast, by Country 2019 & 2032
- Table 24: Brazil Friction Products Market Revenue (Million) Forecast, by Application 2019 & 2032
- Table 25: Argentina Friction Products Market Revenue (Million) Forecast, by Application 2019 & 2032
- Table 26: Rest of South America Friction Products Market Revenue (Million) Forecast, by Application 2019 & 2032
- Table 27: Global Friction Products Market Revenue Million Forecast, by Country 2019 & 2032
- Table 28: Saudi Arabia Friction Products Market Revenue (Million) Forecast, by Application 2019 & 2032
- Table 29: South Africa Friction Products Market Revenue (Million) Forecast, by Application 2019 & 2032
- Table 30: Rest of Middle East and Africa Friction Products Market Revenue (Million) Forecast, by Application 2019 & 2032
- Table 31: Global Friction Products Market Revenue Million Forecast, by Type 2019 & 2032
- Table 32: Global Friction Products Market Revenue Million Forecast, by Material 2019 & 2032
- Table 33: Global Friction Products Market Revenue Million Forecast, by Application 2019 & 2032
- Table 34: Global Friction Products Market Revenue Million Forecast, by End-user Industry 2019 & 2032
- Table 35: Global Friction Products Market Revenue Million Forecast, by Country 2019 & 2032
- Table 36: China Friction Products Market Revenue (Million) Forecast, by Application 2019 & 2032
- Table 37: India Friction Products Market Revenue (Million) Forecast, by Application 2019 & 2032
- Table 38: Japan Friction Products Market Revenue (Million) Forecast, by Application 2019 & 2032
- Table 39: South Korea Friction Products Market Revenue (Million) Forecast, by Application 2019 & 2032
- Table 40: Rest of Asia Pacific Friction Products Market Revenue (Million) Forecast, by Application 2019 & 2032
- Table 41: Global Friction Products Market Revenue Million Forecast, by Type 2019 & 2032
- Table 42: Global Friction Products Market Revenue Million Forecast, by Material 2019 & 2032
- Table 43: Global Friction Products Market Revenue Million Forecast, by Application 2019 & 2032
- Table 44: Global Friction Products Market Revenue Million Forecast, by End-user Industry 2019 & 2032
- Table 45: Global Friction Products Market Revenue Million Forecast, by Country 2019 & 2032
- Table 46: United States Friction Products Market Revenue (Million) Forecast, by Application 2019 & 2032
- Table 47: Canada Friction Products Market Revenue (Million) Forecast, by Application 2019 & 2032
- Table 48: Mexico Friction Products Market Revenue (Million) Forecast, by Application 2019 & 2032
- Table 49: Global Friction Products Market Revenue Million Forecast, by Type 2019 & 2032
- Table 50: Global Friction Products Market Revenue Million Forecast, by Material 2019 & 2032
- Table 51: Global Friction Products Market Revenue Million Forecast, by Application 2019 & 2032
- Table 52: Global Friction Products Market Revenue Million Forecast, by End-user Industry 2019 & 2032
- Table 53: Global Friction Products Market Revenue Million Forecast, by Country 2019 & 2032
- Table 54: Germany Friction Products Market Revenue (Million) Forecast, by Application 2019 & 2032
- Table 55: United Kingdom Friction Products Market Revenue (Million) Forecast, by Application 2019 & 2032
- Table 56: France Friction Products Market Revenue (Million) Forecast, by Application 2019 & 2032
- Table 57: Italy Friction Products Market Revenue (Million) Forecast, by Application 2019 & 2032
- Table 58: Rest of Europe Friction Products Market Revenue (Million) Forecast, by Application 2019 & 2032
- Table 59: Global Friction Products Market Revenue Million Forecast, by Type 2019 & 2032
- Table 60: Global Friction Products Market Revenue Million Forecast, by Material 2019 & 2032
- Table 61: Global Friction Products Market Revenue Million Forecast, by Application 2019 & 2032
- Table 62: Global Friction Products Market Revenue Million Forecast, by End-user Industry 2019 & 2032
- Table 63: Global Friction Products Market Revenue Million Forecast, by Country 2019 & 2032
- Table 64: Brazil Friction Products Market Revenue (Million) Forecast, by Application 2019 & 2032
- Table 65: Argentina Friction Products Market Revenue (Million) Forecast, by Application 2019 & 2032
- Table 66: Rest of South America Friction Products Market Revenue (Million) Forecast, by Application 2019 & 2032
- Table 67: Global Friction Products Market Revenue Million Forecast, by Type 2019 & 2032
- Table 68: Global Friction Products Market Revenue Million Forecast, by Material 2019 & 2032
- Table 69: Global Friction Products Market Revenue Million Forecast, by Application 2019 & 2032
- Table 70: Global Friction Products Market Revenue Million Forecast, by End-user Industry 2019 & 2032
- Table 71: Global Friction Products Market Revenue Million Forecast, by Country 2019 & 2032
- Table 72: Saudi Arabia Friction Products Market Revenue (Million) Forecast, by Application 2019 & 2032
- Table 73: South Africa Friction Products Market Revenue (Million) Forecast, by Application 2019 & 2032
- Table 74: Rest of Middle East and Africa Friction Products Market Revenue (Million) Forecast, by Application 2019 & 2032
Frequently Asked Questions
1. What is the projected Compound Annual Growth Rate (CAGR) of the Friction Products Market?
The projected CAGR is approximately > 6.00%.
2. Which companies are prominent players in the Friction Products Market?
Key companies in the market include ABS Friction, Yantai Haina Brake Technology Co Ltd*List Not Exhaustive, Japan Brake Industrial Co Ltd, Akebono Brake Industry Co Ltd, ITT Inc, ANAND Group, Miba AG, Tenneco Inc, Brembo SpA, Nisshinbo Holdings Inc.
3. What are the main segments of the Friction Products Market?
The market segments include Type, Material, Application, End-user Industry.
4. Can you provide details about the market size?
The market size is estimated to be USD XX Million as of 2022.
5. What are some drivers contributing to market growth?
Growing Need for Industrial Machinery; Other Drivers.
6. What are the notable trends driving market growth?
The Automotive Industry Dominates the Market.
7. Are there any restraints impacting market growth?
High Maintenance and Cost of Friction Materials; Impact of COVID-19 Outbreak; Other Restraints.
8. Can you provide examples of recent developments in the market?
N/A
9. What pricing options are available for accessing the report?
Pricing options include single-user, multi-user, and enterprise licenses priced at USD 4750, USD 5250, and USD 8750 respectively.
10. Is the market size provided in terms of value or volume?
The market size is provided in terms of value, measured in Million.
11. Are there any specific market keywords associated with the report?
Yes, the market keyword associated with the report is "Friction Products Market," which aids in identifying and referencing the specific market segment covered.
12. How do I determine which pricing option suits my needs best?
The pricing options vary based on user requirements and access needs. Individual users may opt for single-user licenses, while businesses requiring broader access may choose multi-user or enterprise licenses for cost-effective access to the report.
13. Are there any additional resources or data provided in the Friction Products Market report?
While the report offers comprehensive insights, it's advisable to review the specific contents or supplementary materials provided to ascertain if additional resources or data are available.
14. How can I stay updated on further developments or reports in the Friction Products Market?
To stay informed about further developments, trends, and reports in the Friction Products Market, consider subscribing to industry newsletters, following relevant companies and organizations, or regularly checking reputable industry news sources and publications.
Methodology
Step 1 - Identification of Relevant Samples Size from Population Database


Step 2 - Approaches for Defining Global Market Size (Value, Volume* & Price*)

Note*: In applicable scenarios
Step 3 - Data Sources
Primary Research
- Web Analytics
- Survey Reports
- Research Institute
- Latest Research Reports
- Opinion Leaders
Secondary Research
- Annual Reports
- White Paper
- Latest Press Release
- Industry Association
- Paid Database
- Investor Presentations

Step 4 - Data Triangulation
Involves using different sources of information in order to increase the validity of a study
These sources are likely to be stakeholders in a program - participants, other researchers, program staff, other community members, and so on.
Then we put all data in single framework & apply various statistical tools to find out the dynamic on the market.
During the analysis stage, feedback from the stakeholder groups would be compared to determine areas of agreement as well as areas of divergence


