
Key Insights
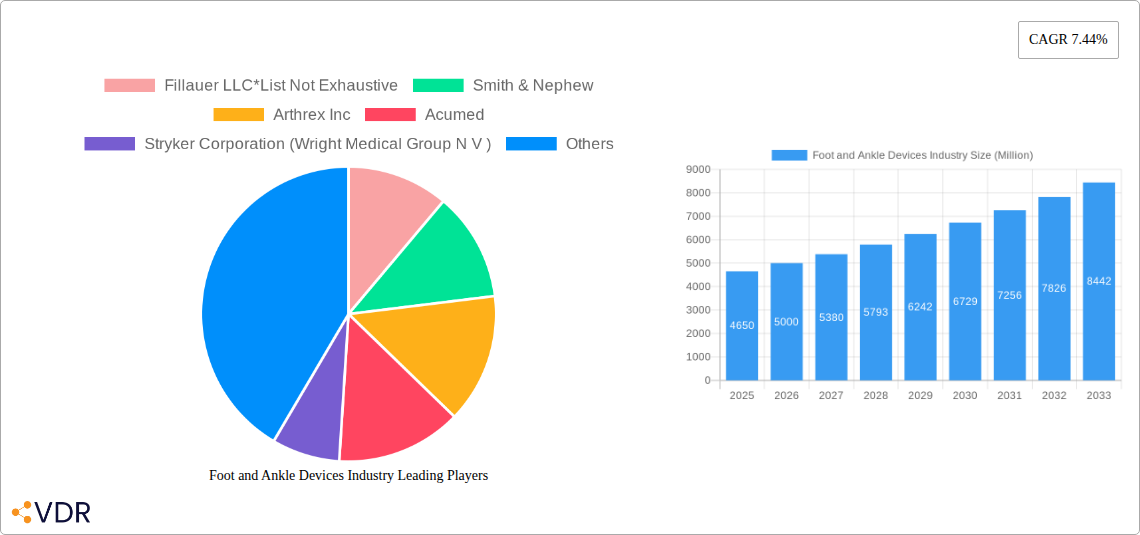
The global foot and ankle devices market, valued at $4.65 billion in 2025, is projected to experience robust growth, driven by several key factors. The aging global population, coupled with increasing incidence of foot and ankle disorders like osteoarthritis, trauma-related injuries, and diabetes-related complications, significantly fuels demand for advanced surgical and non-surgical devices. Technological advancements in minimally invasive surgical techniques, such as robotic surgery and 3D printing for customized implants, are contributing to improved patient outcomes and market expansion. Furthermore, the rising adoption of biologics and implants, offering faster recovery times and enhanced functionality, further accelerates market growth. The market is segmented by device type (ankle replacement devices, external fixation devices, plates, screws, biologics and implants, and others) and procedure type (osteotomy, fracture repair, fusion procedures, and others), reflecting the diverse needs of the patient population and the range of treatment options available. This diverse product portfolio, coupled with ongoing R&D efforts focused on improving device efficacy and safety, positions the market for sustained expansion.
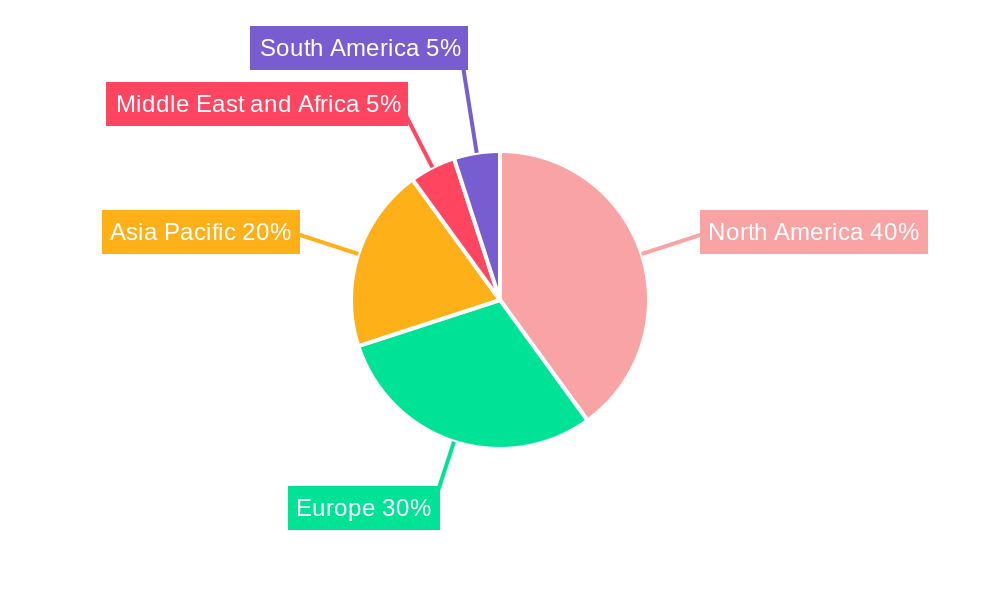
Regional variations in market growth are expected, with North America and Europe maintaining significant market shares due to established healthcare infrastructure, higher healthcare spending, and a larger patient base. However, the Asia-Pacific region is anticipated to witness substantial growth owing to rapid economic development, rising healthcare awareness, and an increasing prevalence of foot and ankle pathologies. Competitive dynamics within the market are intense, with major players such as Johnson & Johnson, Zimmer Biomet, and Stryker Corporation vying for market leadership through strategic acquisitions, new product launches, and geographic expansions. The ongoing emphasis on value-based healthcare and cost containment measures may influence pricing strategies and market competition in the coming years. The long-term forecast suggests continued expansion, driven by the aforementioned factors, leading to substantial market growth throughout the projected period.
Foot and Ankle Devices Industry Market Report: 2019-2033
This comprehensive report provides a detailed analysis of the Foot and Ankle Devices market, encompassing market dynamics, growth trends, regional analysis, product landscape, key players, and future outlook. The study period covers 2019-2033, with a base year of 2025 and a forecast period of 2025-2033. The report segments the market by device type (Ankle Replacement Devices, External Fixation Devices, Plates, Screws, Biologics and Implants, Other Device Types) and by procedure (Osteotomy, Fracture Repair, Fusion Procedures, Other Procedures), providing granular insights into market size and growth potential. The global market is valued at xx Million units in 2025 and is projected to reach xx Million units by 2033.
Foot and Ankle Devices Industry Market Dynamics & Structure
The Foot and Ankle Devices market is characterized by a moderately concentrated structure, with key players such as Smith & Nephew, Zimmer Biomet, and Johnson & Johnson (DePuy Synthes) holding significant market share. However, smaller, specialized companies also contribute significantly to innovation and market competition. Technological advancements, particularly in minimally invasive surgical techniques and biomaterials, are key drivers of market growth. Stringent regulatory frameworks, particularly in developed markets, influence product development and market entry. Competitive pressures are evident through the introduction of substitute products and the ongoing pursuit of improved device performance and cost-effectiveness. The market exhibits diverse end-user demographics, including hospitals, orthopedic clinics, and ambulatory surgical centers. M&A activity within the industry is relatively frequent, driven by strategic acquisitions aimed at expanding product portfolios and market reach. An estimated xx% of the market is consolidated among the top 5 players.
- Market Concentration: Moderately concentrated, with top 5 players holding approximately xx% market share in 2025.
- Technological Innovation: Focus on minimally invasive surgery, improved biomaterials, and advanced imaging techniques.
- Regulatory Framework: Stringent regulatory approvals (e.g., FDA) impact product development and market access.
- Competitive Substitutes: Alternative treatments like conservative management and non-surgical interventions pose competition.
- End-User Demographics: Hospitals, orthopedic clinics, and ambulatory surgical centers are primary end-users.
- M&A Trends: Moderate levels of M&A activity, driven by strategic expansion and diversification.
Foot and Ankle Devices Industry Growth Trends & Insights
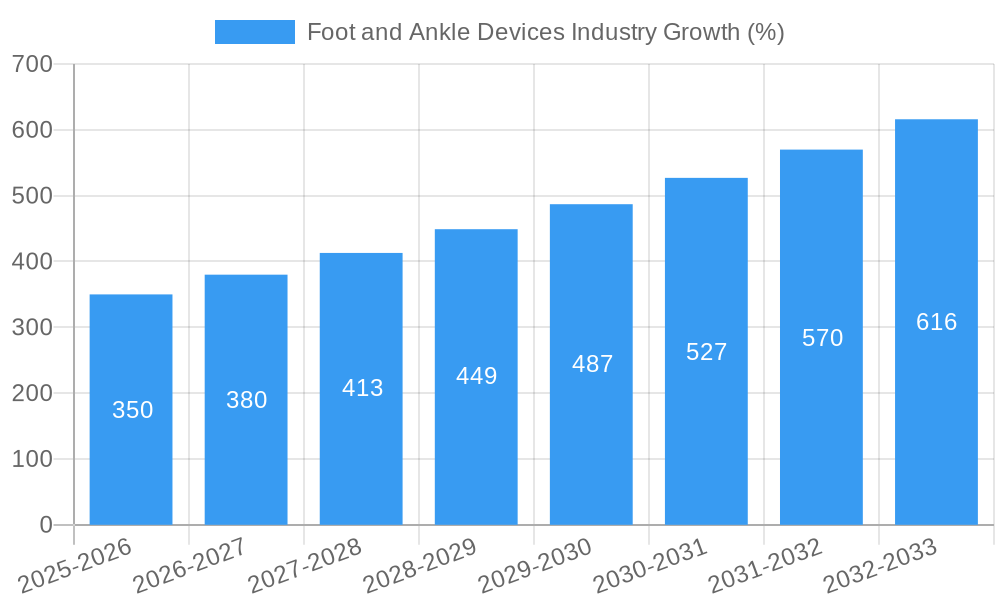
The Foot and Ankle Devices market is projected to experience significant growth during the forecast period (2025-2033), driven by factors such as the rising prevalence of foot and ankle injuries and disorders, an aging global population, technological advancements leading to improved device efficacy, and increasing healthcare expenditure. The market witnessed a CAGR of xx% during the historical period (2019-2024) and is anticipated to maintain a strong CAGR of xx% during the forecast period, reaching xx Million units by 2033. This growth is fueled by increasing adoption rates of minimally invasive surgical techniques, technological disruptions leading to the development of more sophisticated and effective devices, and shifts in consumer preferences towards personalized and minimally invasive treatment options. Market penetration rates are expected to improve further as access to advanced healthcare expands in emerging markets.
Dominant Regions, Countries, or Segments in Foot and Ankle Devices Industry
North America currently holds the largest market share in the Foot and Ankle Devices industry, driven by high healthcare expenditure, a large aging population, and a well-established healthcare infrastructure. However, Asia-Pacific is projected to experience the fastest growth rate during the forecast period due to increasing healthcare expenditure, rising prevalence of foot and ankle disorders, and growing awareness of advanced treatment options. Within the device type segment, Ankle Replacement Devices and External Fixation Devices are currently the dominant segments, however, the demand for biologics and implants is steadily increasing, driven by improved treatment outcomes and reduced recovery times. In terms of procedures, Fracture Repair dominates the market share, owing to the high incidence of trauma-related injuries.
- Key Drivers (North America): High healthcare expenditure, advanced healthcare infrastructure, large aging population.
- Key Drivers (Asia-Pacific): Increasing healthcare expenditure, rising prevalence of foot and ankle disorders, expanding awareness.
- Dominant Segments (Device Type): Ankle Replacement Devices, External Fixation Devices, showing the highest growth potential.
- Dominant Segment (Procedure): Fracture Repair holds the largest market share.
Foot and Ankle Devices Industry Product Landscape
The foot and ankle device market showcases a diverse range of products, characterized by continuous innovation in materials, designs, and functionalities. Recent advancements include the development of minimally invasive implants, biocompatible materials that enhance osseointegration, and smart implants that enable remote monitoring of patient progress. These innovations are driven by the demand for improved patient outcomes, reduced recovery times, and enhanced surgical precision. Companies are focusing on creating devices with unique selling propositions, such as enhanced durability, improved fixation strength, and patient-specific customization options.
Key Drivers, Barriers & Challenges in Foot and Ankle Devices Industry
Key Drivers: The rising prevalence of foot and ankle injuries and disorders, an aging global population, technological advancements leading to improved device efficacy and minimally invasive techniques, increasing healthcare expenditure, and the growing awareness of advanced treatment options are among the key drivers fueling market growth.
Challenges: Stringent regulatory approvals and reimbursement policies can hinder market entry and adoption. High manufacturing costs can limit accessibility, particularly in emerging markets. Intense competition among established players and the entry of new entrants pose challenges to market share and profitability. Supply chain disruptions can impact the availability and cost of devices.
Emerging Opportunities in Foot and Ankle Devices Industry
Untapped markets in developing countries present significant growth potential. The increasing demand for minimally invasive procedures and personalized medicine offers opportunities for innovative device designs and applications. The development of smart implants with remote monitoring capabilities is expected to create new opportunities for improved patient care and data-driven decision-making. Focus on personalized treatment plans, including regenerative medicine techniques, presents significant market opportunities.
Growth Accelerators in the Foot and Ankle Devices Industry
Technological breakthroughs, such as the development of biocompatible and biodegradable materials, smart implants, and advanced imaging techniques, significantly accelerate market growth. Strategic partnerships between device manufacturers and healthcare providers enhance market access and adoption. Market expansion strategies, including focusing on emerging markets and targeting underserved patient populations, propel market expansion and growth.
Key Players Shaping the Foot and Ankle Devices Industry Market
- Fillauer LLC
- Smith & Nephew
- Arthrex Inc
- Acumed
- Stryker Corporation (Wright Medical Group N V )
- Globus Medical Inc
- Orthofix US LLC
- Johnson & Johnson (DePuy Synthes)
- Zimmer Biomet
- Ortho Solutions UK Ltd
Notable Milestones in Foot and Ankle Devices Industry Sector
- April 2023: Enovis Corporation launched Enofix with Constrictor Technology, a repair system demonstrating superior fixation under cyclic loading, expanding its foot and ankle product portfolio.
- April 2022: Medline UNITE Foot & Ankle received FDA approval for its Calcaneal Fracture Plating System and IM Fibula Implant, providing surgeons with a complete titanium foot and ankle trauma system.
In-Depth Foot and Ankle Devices Industry Market Outlook
The Foot and Ankle Devices market is poised for continued strong growth, driven by a confluence of factors, including technological advancements, an aging population, increasing incidence of foot and ankle disorders, and rising healthcare expenditure globally. Strategic opportunities lie in developing innovative devices, expanding into emerging markets, and leveraging data analytics for improved patient care. The focus on minimally invasive procedures and personalized medicine will continue to shape the product landscape and drive market growth in the coming years.
Foot and Ankle Devices Industry Segmentation
-
1. Device Type
- 1.1. Ankle Replacement Devices
- 1.2. External Fixation Devices
- 1.3. Plates
- 1.4. Screws
- 1.5. Biologics and Implants
- 1.6. Other De
-
2. Procedure
- 2.1. Osteotomy
- 2.2. Fracture Repair
- 2.3. Fusion Procedures
- 2.4. Other Procedures
Foot and Ankle Devices Industry Segmentation By Geography
-
1. North America
- 1.1. United States
- 1.2. Canada
- 1.3. Mexico
-
2. Europe
- 2.1. Germany
- 2.2. United Kingdom
- 2.3. France
- 2.4. Italy
- 2.5. Spain
- 2.6. Rest of Europe
-
3. Asia Pacific
- 3.1. China
- 3.2. Japan
- 3.3. India
- 3.4. Australia
- 3.5. South Korea
- 3.6. Rest of Asia Pacific
-
4. Middle East and Africa
- 4.1. GCC
- 4.2. South Africa
- 4.3. Rest of Middle East and Africa
-
5. South America
- 5.1. Brazil
- 5.2. Argentina
- 5.3. Rest of South America
Foot and Ankle Devices Industry REPORT HIGHLIGHTS
| Aspects | Details |
|---|---|
| Study Period | 2019-2033 |
| Base Year | 2024 |
| Estimated Year | 2025 |
| Forecast Period | 2025-2033 |
| Historical Period | 2019-2024 |
| Growth Rate | CAGR of 7.44% from 2019-2033 |
| Segmentation |
|
Table of Contents
- 1. Introduction
- 1.1. Research Scope
- 1.2. Market Segmentation
- 1.3. Research Methodology
- 1.4. Definitions and Assumptions
- 2. Executive Summary
- 2.1. Introduction
- 3. Market Dynamics
- 3.1. Introduction
- 3.2. Market Drivers
- 3.2.1. Increasing Number of Sports Injuries and Road Accidents; Rising Incidences of Diabetes and Foot-related Disorders; Technological Advances in Foot and Ankle Surgeries
- 3.3. Market Restrains
- 3.3.1. Stringent Regulatory Guidelines; Huge Cost and Lack of Reimbursement for Devices
- 3.4. Market Trends
- 3.4.1. Fracture Repair Segment is Expected to Hold Significant Share in the Procedure Segment
- 4. Market Factor Analysis
- 4.1. Porters Five Forces
- 4.2. Supply/Value Chain
- 4.3. PESTEL analysis
- 4.4. Market Entropy
- 4.5. Patent/Trademark Analysis
- 5. Global Foot and Ankle Devices Industry Analysis, Insights and Forecast, 2019-2031
- 5.1. Market Analysis, Insights and Forecast - by Device Type
- 5.1.1. Ankle Replacement Devices
- 5.1.2. External Fixation Devices
- 5.1.3. Plates
- 5.1.4. Screws
- 5.1.5. Biologics and Implants
- 5.1.6. Other De
- 5.2. Market Analysis, Insights and Forecast - by Procedure
- 5.2.1. Osteotomy
- 5.2.2. Fracture Repair
- 5.2.3. Fusion Procedures
- 5.2.4. Other Procedures
- 5.3. Market Analysis, Insights and Forecast - by Region
- 5.3.1. North America
- 5.3.2. Europe
- 5.3.3. Asia Pacific
- 5.3.4. Middle East and Africa
- 5.3.5. South America
- 5.1. Market Analysis, Insights and Forecast - by Device Type
- 6. North America Foot and Ankle Devices Industry Analysis, Insights and Forecast, 2019-2031
- 6.1. Market Analysis, Insights and Forecast - by Device Type
- 6.1.1. Ankle Replacement Devices
- 6.1.2. External Fixation Devices
- 6.1.3. Plates
- 6.1.4. Screws
- 6.1.5. Biologics and Implants
- 6.1.6. Other De
- 6.2. Market Analysis, Insights and Forecast - by Procedure
- 6.2.1. Osteotomy
- 6.2.2. Fracture Repair
- 6.2.3. Fusion Procedures
- 6.2.4. Other Procedures
- 6.1. Market Analysis, Insights and Forecast - by Device Type
- 7. Europe Foot and Ankle Devices Industry Analysis, Insights and Forecast, 2019-2031
- 7.1. Market Analysis, Insights and Forecast - by Device Type
- 7.1.1. Ankle Replacement Devices
- 7.1.2. External Fixation Devices
- 7.1.3. Plates
- 7.1.4. Screws
- 7.1.5. Biologics and Implants
- 7.1.6. Other De
- 7.2. Market Analysis, Insights and Forecast - by Procedure
- 7.2.1. Osteotomy
- 7.2.2. Fracture Repair
- 7.2.3. Fusion Procedures
- 7.2.4. Other Procedures
- 7.1. Market Analysis, Insights and Forecast - by Device Type
- 8. Asia Pacific Foot and Ankle Devices Industry Analysis, Insights and Forecast, 2019-2031
- 8.1. Market Analysis, Insights and Forecast - by Device Type
- 8.1.1. Ankle Replacement Devices
- 8.1.2. External Fixation Devices
- 8.1.3. Plates
- 8.1.4. Screws
- 8.1.5. Biologics and Implants
- 8.1.6. Other De
- 8.2. Market Analysis, Insights and Forecast - by Procedure
- 8.2.1. Osteotomy
- 8.2.2. Fracture Repair
- 8.2.3. Fusion Procedures
- 8.2.4. Other Procedures
- 8.1. Market Analysis, Insights and Forecast - by Device Type
- 9. Middle East and Africa Foot and Ankle Devices Industry Analysis, Insights and Forecast, 2019-2031
- 9.1. Market Analysis, Insights and Forecast - by Device Type
- 9.1.1. Ankle Replacement Devices
- 9.1.2. External Fixation Devices
- 9.1.3. Plates
- 9.1.4. Screws
- 9.1.5. Biologics and Implants
- 9.1.6. Other De
- 9.2. Market Analysis, Insights and Forecast - by Procedure
- 9.2.1. Osteotomy
- 9.2.2. Fracture Repair
- 9.2.3. Fusion Procedures
- 9.2.4. Other Procedures
- 9.1. Market Analysis, Insights and Forecast - by Device Type
- 10. South America Foot and Ankle Devices Industry Analysis, Insights and Forecast, 2019-2031
- 10.1. Market Analysis, Insights and Forecast - by Device Type
- 10.1.1. Ankle Replacement Devices
- 10.1.2. External Fixation Devices
- 10.1.3. Plates
- 10.1.4. Screws
- 10.1.5. Biologics and Implants
- 10.1.6. Other De
- 10.2. Market Analysis, Insights and Forecast - by Procedure
- 10.2.1. Osteotomy
- 10.2.2. Fracture Repair
- 10.2.3. Fusion Procedures
- 10.2.4. Other Procedures
- 10.1. Market Analysis, Insights and Forecast - by Device Type
- 11. North America Foot and Ankle Devices Industry Analysis, Insights and Forecast, 2019-2031
- 11.1. Market Analysis, Insights and Forecast - By Country/Sub-region
- 11.1.1 United States
- 11.1.2 Canada
- 11.1.3 Mexico
- 12. Europe Foot and Ankle Devices Industry Analysis, Insights and Forecast, 2019-2031
- 12.1. Market Analysis, Insights and Forecast - By Country/Sub-region
- 12.1.1 Germany
- 12.1.2 United Kingdom
- 12.1.3 France
- 12.1.4 Italy
- 12.1.5 Spain
- 12.1.6 Rest of Europe
- 13. Asia Pacific Foot and Ankle Devices Industry Analysis, Insights and Forecast, 2019-2031
- 13.1. Market Analysis, Insights and Forecast - By Country/Sub-region
- 13.1.1 China
- 13.1.2 Japan
- 13.1.3 India
- 13.1.4 Australia
- 13.1.5 South Korea
- 13.1.6 Rest of Asia Pacific
- 14. Middle East and Africa Foot and Ankle Devices Industry Analysis, Insights and Forecast, 2019-2031
- 14.1. Market Analysis, Insights and Forecast - By Country/Sub-region
- 14.1.1 GCC
- 14.1.2 South Africa
- 14.1.3 Rest of Middle East and Africa
- 15. South America Foot and Ankle Devices Industry Analysis, Insights and Forecast, 2019-2031
- 15.1. Market Analysis, Insights and Forecast - By Country/Sub-region
- 15.1.1 Brazil
- 15.1.2 Argentina
- 15.1.3 Rest of South America
- 16. Competitive Analysis
- 16.1. Global Market Share Analysis 2024
- 16.2. Company Profiles
- 16.2.1 Fillauer LLC*List Not Exhaustive
- 16.2.1.1. Overview
- 16.2.1.2. Products
- 16.2.1.3. SWOT Analysis
- 16.2.1.4. Recent Developments
- 16.2.1.5. Financials (Based on Availability)
- 16.2.2 Smith & Nephew
- 16.2.2.1. Overview
- 16.2.2.2. Products
- 16.2.2.3. SWOT Analysis
- 16.2.2.4. Recent Developments
- 16.2.2.5. Financials (Based on Availability)
- 16.2.3 Arthrex Inc
- 16.2.3.1. Overview
- 16.2.3.2. Products
- 16.2.3.3. SWOT Analysis
- 16.2.3.4. Recent Developments
- 16.2.3.5. Financials (Based on Availability)
- 16.2.4 Acumed
- 16.2.4.1. Overview
- 16.2.4.2. Products
- 16.2.4.3. SWOT Analysis
- 16.2.4.4. Recent Developments
- 16.2.4.5. Financials (Based on Availability)
- 16.2.5 Stryker Corporation (Wright Medical Group N V )
- 16.2.5.1. Overview
- 16.2.5.2. Products
- 16.2.5.3. SWOT Analysis
- 16.2.5.4. Recent Developments
- 16.2.5.5. Financials (Based on Availability)
- 16.2.6 Globus Medical Inc
- 16.2.6.1. Overview
- 16.2.6.2. Products
- 16.2.6.3. SWOT Analysis
- 16.2.6.4. Recent Developments
- 16.2.6.5. Financials (Based on Availability)
- 16.2.7 Orthofix US LLC
- 16.2.7.1. Overview
- 16.2.7.2. Products
- 16.2.7.3. SWOT Analysis
- 16.2.7.4. Recent Developments
- 16.2.7.5. Financials (Based on Availability)
- 16.2.8 Johnson & Johnson (DePuy Synthes)
- 16.2.8.1. Overview
- 16.2.8.2. Products
- 16.2.8.3. SWOT Analysis
- 16.2.8.4. Recent Developments
- 16.2.8.5. Financials (Based on Availability)
- 16.2.9 Zimmer Biomet
- 16.2.9.1. Overview
- 16.2.9.2. Products
- 16.2.9.3. SWOT Analysis
- 16.2.9.4. Recent Developments
- 16.2.9.5. Financials (Based on Availability)
- 16.2.10 Ortho Solutions UK Ltd
- 16.2.10.1. Overview
- 16.2.10.2. Products
- 16.2.10.3. SWOT Analysis
- 16.2.10.4. Recent Developments
- 16.2.10.5. Financials (Based on Availability)
- 16.2.1 Fillauer LLC*List Not Exhaustive
List of Figures
- Figure 1: Global Foot and Ankle Devices Industry Revenue Breakdown (Million, %) by Region 2024 & 2032
- Figure 2: North America Foot and Ankle Devices Industry Revenue (Million), by Country 2024 & 2032
- Figure 3: North America Foot and Ankle Devices Industry Revenue Share (%), by Country 2024 & 2032
- Figure 4: Europe Foot and Ankle Devices Industry Revenue (Million), by Country 2024 & 2032
- Figure 5: Europe Foot and Ankle Devices Industry Revenue Share (%), by Country 2024 & 2032
- Figure 6: Asia Pacific Foot and Ankle Devices Industry Revenue (Million), by Country 2024 & 2032
- Figure 7: Asia Pacific Foot and Ankle Devices Industry Revenue Share (%), by Country 2024 & 2032
- Figure 8: Middle East and Africa Foot and Ankle Devices Industry Revenue (Million), by Country 2024 & 2032
- Figure 9: Middle East and Africa Foot and Ankle Devices Industry Revenue Share (%), by Country 2024 & 2032
- Figure 10: South America Foot and Ankle Devices Industry Revenue (Million), by Country 2024 & 2032
- Figure 11: South America Foot and Ankle Devices Industry Revenue Share (%), by Country 2024 & 2032
- Figure 12: North America Foot and Ankle Devices Industry Revenue (Million), by Device Type 2024 & 2032
- Figure 13: North America Foot and Ankle Devices Industry Revenue Share (%), by Device Type 2024 & 2032
- Figure 14: North America Foot and Ankle Devices Industry Revenue (Million), by Procedure 2024 & 2032
- Figure 15: North America Foot and Ankle Devices Industry Revenue Share (%), by Procedure 2024 & 2032
- Figure 16: North America Foot and Ankle Devices Industry Revenue (Million), by Country 2024 & 2032
- Figure 17: North America Foot and Ankle Devices Industry Revenue Share (%), by Country 2024 & 2032
- Figure 18: Europe Foot and Ankle Devices Industry Revenue (Million), by Device Type 2024 & 2032
- Figure 19: Europe Foot and Ankle Devices Industry Revenue Share (%), by Device Type 2024 & 2032
- Figure 20: Europe Foot and Ankle Devices Industry Revenue (Million), by Procedure 2024 & 2032
- Figure 21: Europe Foot and Ankle Devices Industry Revenue Share (%), by Procedure 2024 & 2032
- Figure 22: Europe Foot and Ankle Devices Industry Revenue (Million), by Country 2024 & 2032
- Figure 23: Europe Foot and Ankle Devices Industry Revenue Share (%), by Country 2024 & 2032
- Figure 24: Asia Pacific Foot and Ankle Devices Industry Revenue (Million), by Device Type 2024 & 2032
- Figure 25: Asia Pacific Foot and Ankle Devices Industry Revenue Share (%), by Device Type 2024 & 2032
- Figure 26: Asia Pacific Foot and Ankle Devices Industry Revenue (Million), by Procedure 2024 & 2032
- Figure 27: Asia Pacific Foot and Ankle Devices Industry Revenue Share (%), by Procedure 2024 & 2032
- Figure 28: Asia Pacific Foot and Ankle Devices Industry Revenue (Million), by Country 2024 & 2032
- Figure 29: Asia Pacific Foot and Ankle Devices Industry Revenue Share (%), by Country 2024 & 2032
- Figure 30: Middle East and Africa Foot and Ankle Devices Industry Revenue (Million), by Device Type 2024 & 2032
- Figure 31: Middle East and Africa Foot and Ankle Devices Industry Revenue Share (%), by Device Type 2024 & 2032
- Figure 32: Middle East and Africa Foot and Ankle Devices Industry Revenue (Million), by Procedure 2024 & 2032
- Figure 33: Middle East and Africa Foot and Ankle Devices Industry Revenue Share (%), by Procedure 2024 & 2032
- Figure 34: Middle East and Africa Foot and Ankle Devices Industry Revenue (Million), by Country 2024 & 2032
- Figure 35: Middle East and Africa Foot and Ankle Devices Industry Revenue Share (%), by Country 2024 & 2032
- Figure 36: South America Foot and Ankle Devices Industry Revenue (Million), by Device Type 2024 & 2032
- Figure 37: South America Foot and Ankle Devices Industry Revenue Share (%), by Device Type 2024 & 2032
- Figure 38: South America Foot and Ankle Devices Industry Revenue (Million), by Procedure 2024 & 2032
- Figure 39: South America Foot and Ankle Devices Industry Revenue Share (%), by Procedure 2024 & 2032
- Figure 40: South America Foot and Ankle Devices Industry Revenue (Million), by Country 2024 & 2032
- Figure 41: South America Foot and Ankle Devices Industry Revenue Share (%), by Country 2024 & 2032
List of Tables
- Table 1: Global Foot and Ankle Devices Industry Revenue Million Forecast, by Region 2019 & 2032
- Table 2: Global Foot and Ankle Devices Industry Revenue Million Forecast, by Device Type 2019 & 2032
- Table 3: Global Foot and Ankle Devices Industry Revenue Million Forecast, by Procedure 2019 & 2032
- Table 4: Global Foot and Ankle Devices Industry Revenue Million Forecast, by Region 2019 & 2032
- Table 5: Global Foot and Ankle Devices Industry Revenue Million Forecast, by Country 2019 & 2032
- Table 6: United States Foot and Ankle Devices Industry Revenue (Million) Forecast, by Application 2019 & 2032
- Table 7: Canada Foot and Ankle Devices Industry Revenue (Million) Forecast, by Application 2019 & 2032
- Table 8: Mexico Foot and Ankle Devices Industry Revenue (Million) Forecast, by Application 2019 & 2032
- Table 9: Global Foot and Ankle Devices Industry Revenue Million Forecast, by Country 2019 & 2032
- Table 10: Germany Foot and Ankle Devices Industry Revenue (Million) Forecast, by Application 2019 & 2032
- Table 11: United Kingdom Foot and Ankle Devices Industry Revenue (Million) Forecast, by Application 2019 & 2032
- Table 12: France Foot and Ankle Devices Industry Revenue (Million) Forecast, by Application 2019 & 2032
- Table 13: Italy Foot and Ankle Devices Industry Revenue (Million) Forecast, by Application 2019 & 2032
- Table 14: Spain Foot and Ankle Devices Industry Revenue (Million) Forecast, by Application 2019 & 2032
- Table 15: Rest of Europe Foot and Ankle Devices Industry Revenue (Million) Forecast, by Application 2019 & 2032
- Table 16: Global Foot and Ankle Devices Industry Revenue Million Forecast, by Country 2019 & 2032
- Table 17: China Foot and Ankle Devices Industry Revenue (Million) Forecast, by Application 2019 & 2032
- Table 18: Japan Foot and Ankle Devices Industry Revenue (Million) Forecast, by Application 2019 & 2032
- Table 19: India Foot and Ankle Devices Industry Revenue (Million) Forecast, by Application 2019 & 2032
- Table 20: Australia Foot and Ankle Devices Industry Revenue (Million) Forecast, by Application 2019 & 2032
- Table 21: South Korea Foot and Ankle Devices Industry Revenue (Million) Forecast, by Application 2019 & 2032
- Table 22: Rest of Asia Pacific Foot and Ankle Devices Industry Revenue (Million) Forecast, by Application 2019 & 2032
- Table 23: Global Foot and Ankle Devices Industry Revenue Million Forecast, by Country 2019 & 2032
- Table 24: GCC Foot and Ankle Devices Industry Revenue (Million) Forecast, by Application 2019 & 2032
- Table 25: South Africa Foot and Ankle Devices Industry Revenue (Million) Forecast, by Application 2019 & 2032
- Table 26: Rest of Middle East and Africa Foot and Ankle Devices Industry Revenue (Million) Forecast, by Application 2019 & 2032
- Table 27: Global Foot and Ankle Devices Industry Revenue Million Forecast, by Country 2019 & 2032
- Table 28: Brazil Foot and Ankle Devices Industry Revenue (Million) Forecast, by Application 2019 & 2032
- Table 29: Argentina Foot and Ankle Devices Industry Revenue (Million) Forecast, by Application 2019 & 2032
- Table 30: Rest of South America Foot and Ankle Devices Industry Revenue (Million) Forecast, by Application 2019 & 2032
- Table 31: Global Foot and Ankle Devices Industry Revenue Million Forecast, by Device Type 2019 & 2032
- Table 32: Global Foot and Ankle Devices Industry Revenue Million Forecast, by Procedure 2019 & 2032
- Table 33: Global Foot and Ankle Devices Industry Revenue Million Forecast, by Country 2019 & 2032
- Table 34: United States Foot and Ankle Devices Industry Revenue (Million) Forecast, by Application 2019 & 2032
- Table 35: Canada Foot and Ankle Devices Industry Revenue (Million) Forecast, by Application 2019 & 2032
- Table 36: Mexico Foot and Ankle Devices Industry Revenue (Million) Forecast, by Application 2019 & 2032
- Table 37: Global Foot and Ankle Devices Industry Revenue Million Forecast, by Device Type 2019 & 2032
- Table 38: Global Foot and Ankle Devices Industry Revenue Million Forecast, by Procedure 2019 & 2032
- Table 39: Global Foot and Ankle Devices Industry Revenue Million Forecast, by Country 2019 & 2032
- Table 40: Germany Foot and Ankle Devices Industry Revenue (Million) Forecast, by Application 2019 & 2032
- Table 41: United Kingdom Foot and Ankle Devices Industry Revenue (Million) Forecast, by Application 2019 & 2032
- Table 42: France Foot and Ankle Devices Industry Revenue (Million) Forecast, by Application 2019 & 2032
- Table 43: Italy Foot and Ankle Devices Industry Revenue (Million) Forecast, by Application 2019 & 2032
- Table 44: Spain Foot and Ankle Devices Industry Revenue (Million) Forecast, by Application 2019 & 2032
- Table 45: Rest of Europe Foot and Ankle Devices Industry Revenue (Million) Forecast, by Application 2019 & 2032
- Table 46: Global Foot and Ankle Devices Industry Revenue Million Forecast, by Device Type 2019 & 2032
- Table 47: Global Foot and Ankle Devices Industry Revenue Million Forecast, by Procedure 2019 & 2032
- Table 48: Global Foot and Ankle Devices Industry Revenue Million Forecast, by Country 2019 & 2032
- Table 49: China Foot and Ankle Devices Industry Revenue (Million) Forecast, by Application 2019 & 2032
- Table 50: Japan Foot and Ankle Devices Industry Revenue (Million) Forecast, by Application 2019 & 2032
- Table 51: India Foot and Ankle Devices Industry Revenue (Million) Forecast, by Application 2019 & 2032
- Table 52: Australia Foot and Ankle Devices Industry Revenue (Million) Forecast, by Application 2019 & 2032
- Table 53: South Korea Foot and Ankle Devices Industry Revenue (Million) Forecast, by Application 2019 & 2032
- Table 54: Rest of Asia Pacific Foot and Ankle Devices Industry Revenue (Million) Forecast, by Application 2019 & 2032
- Table 55: Global Foot and Ankle Devices Industry Revenue Million Forecast, by Device Type 2019 & 2032
- Table 56: Global Foot and Ankle Devices Industry Revenue Million Forecast, by Procedure 2019 & 2032
- Table 57: Global Foot and Ankle Devices Industry Revenue Million Forecast, by Country 2019 & 2032
- Table 58: GCC Foot and Ankle Devices Industry Revenue (Million) Forecast, by Application 2019 & 2032
- Table 59: South Africa Foot and Ankle Devices Industry Revenue (Million) Forecast, by Application 2019 & 2032
- Table 60: Rest of Middle East and Africa Foot and Ankle Devices Industry Revenue (Million) Forecast, by Application 2019 & 2032
- Table 61: Global Foot and Ankle Devices Industry Revenue Million Forecast, by Device Type 2019 & 2032
- Table 62: Global Foot and Ankle Devices Industry Revenue Million Forecast, by Procedure 2019 & 2032
- Table 63: Global Foot and Ankle Devices Industry Revenue Million Forecast, by Country 2019 & 2032
- Table 64: Brazil Foot and Ankle Devices Industry Revenue (Million) Forecast, by Application 2019 & 2032
- Table 65: Argentina Foot and Ankle Devices Industry Revenue (Million) Forecast, by Application 2019 & 2032
- Table 66: Rest of South America Foot and Ankle Devices Industry Revenue (Million) Forecast, by Application 2019 & 2032
Frequently Asked Questions
1. What is the projected Compound Annual Growth Rate (CAGR) of the Foot and Ankle Devices Industry?
The projected CAGR is approximately 7.44%.
2. Which companies are prominent players in the Foot and Ankle Devices Industry?
Key companies in the market include Fillauer LLC*List Not Exhaustive, Smith & Nephew, Arthrex Inc, Acumed, Stryker Corporation (Wright Medical Group N V ), Globus Medical Inc, Orthofix US LLC, Johnson & Johnson (DePuy Synthes), Zimmer Biomet, Ortho Solutions UK Ltd.
3. What are the main segments of the Foot and Ankle Devices Industry?
The market segments include Device Type, Procedure.
4. Can you provide details about the market size?
The market size is estimated to be USD 4.65 Million as of 2022.
5. What are some drivers contributing to market growth?
Increasing Number of Sports Injuries and Road Accidents; Rising Incidences of Diabetes and Foot-related Disorders; Technological Advances in Foot and Ankle Surgeries.
6. What are the notable trends driving market growth?
Fracture Repair Segment is Expected to Hold Significant Share in the Procedure Segment.
7. Are there any restraints impacting market growth?
Stringent Regulatory Guidelines; Huge Cost and Lack of Reimbursement for Devices.
8. Can you provide examples of recent developments in the market?
April 2023: Enovis Corporation launched Enofix with Constrictor Technology, the latest addition to Enovis' growing suite of foot and ankle products. Enofix with Constrictor Technology is a repair system demonstrating superior fixation under cyclic loading.
9. What pricing options are available for accessing the report?
Pricing options include single-user, multi-user, and enterprise licenses priced at USD 4750, USD 5250, and USD 8750 respectively.
10. Is the market size provided in terms of value or volume?
The market size is provided in terms of value, measured in Million.
11. Are there any specific market keywords associated with the report?
Yes, the market keyword associated with the report is "Foot and Ankle Devices Industry," which aids in identifying and referencing the specific market segment covered.
12. How do I determine which pricing option suits my needs best?
The pricing options vary based on user requirements and access needs. Individual users may opt for single-user licenses, while businesses requiring broader access may choose multi-user or enterprise licenses for cost-effective access to the report.
13. Are there any additional resources or data provided in the Foot and Ankle Devices Industry report?
While the report offers comprehensive insights, it's advisable to review the specific contents or supplementary materials provided to ascertain if additional resources or data are available.
14. How can I stay updated on further developments or reports in the Foot and Ankle Devices Industry?
To stay informed about further developments, trends, and reports in the Foot and Ankle Devices Industry, consider subscribing to industry newsletters, following relevant companies and organizations, or regularly checking reputable industry news sources and publications.
Methodology
Step 1 - Identification of Relevant Samples Size from Population Database


Step 2 - Approaches for Defining Global Market Size (Value, Volume* & Price*)

Note*: In applicable scenarios
Step 3 - Data Sources
Primary Research
- Web Analytics
- Survey Reports
- Research Institute
- Latest Research Reports
- Opinion Leaders
Secondary Research
- Annual Reports
- White Paper
- Latest Press Release
- Industry Association
- Paid Database
- Investor Presentations

Step 4 - Data Triangulation
Involves using different sources of information in order to increase the validity of a study
These sources are likely to be stakeholders in a program - participants, other researchers, program staff, other community members, and so on.
Then we put all data in single framework & apply various statistical tools to find out the dynamic on the market.
During the analysis stage, feedback from the stakeholder groups would be compared to determine areas of agreement as well as areas of divergence


