
Key Insights
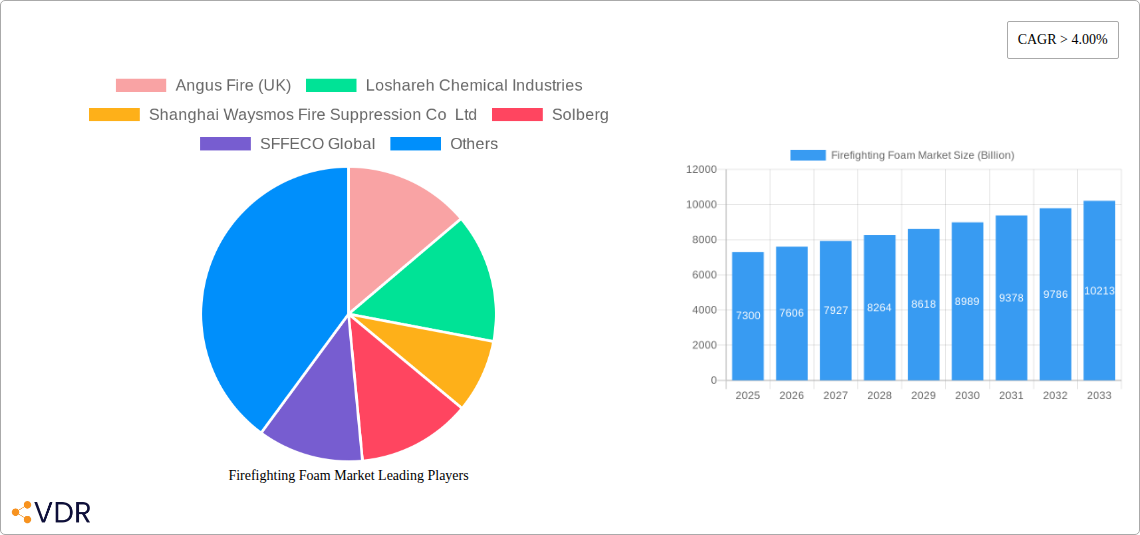
The global firefighting foam market, valued at $7.3 billion in 2025, is projected to experience robust growth, exhibiting a compound annual growth rate (CAGR) exceeding 4% from 2025 to 2033. This expansion is driven by several key factors. Increasing industrialization and urbanization lead to a higher demand for effective fire suppression systems across diverse sectors, including oil and gas, chemical processing, and transportation. Stringent government regulations regarding fire safety and environmental protection are further bolstering market growth. The rising adoption of advanced foam technologies, such as alcohol-resistant aqueous film-forming foams (AR-AFFF) and synthetic foams, offering improved performance and reduced environmental impact, is another significant driver. Moreover, the increasing awareness of the risks associated with traditional fluorosurfactant-based foams and the subsequent shift towards environmentally friendly alternatives is reshaping the market landscape. The market is segmented by foam type (AFFF, AR-AFFF, synthetic, protein, others), end-user industry (oil & gas, chemical, mining, transportation, others), and material type (surfactants, fluorosurfactants, PFOA, others). Geographic variations exist, with North America and Asia-Pacific anticipated to be key regional contributors due to significant industrial activity and proactive fire safety measures.
However, market growth faces certain challenges. The high cost associated with advanced firefighting foams and the stringent regulatory landscape surrounding the use of certain chemicals, particularly those containing PFOA, can act as restraints. Furthermore, the ongoing research and development efforts focused on finding even more sustainable and effective alternatives will continue to influence market dynamics. Despite these challenges, the long-term outlook for the firefighting foam market remains positive, driven by sustained growth in key end-user industries and the ongoing need for superior fire protection solutions. The market is expected to see increased competition as companies focus on innovation and product diversification to cater to specific industry needs and evolving environmental regulations. This will create opportunities for both established players and emerging businesses entering the market.
Firefighting Foam Market: A Comprehensive Report (2019-2033)
This comprehensive report provides an in-depth analysis of the global firefighting foam market, encompassing its dynamics, growth trends, regional segmentation, product landscape, key players, and future outlook. The study period covers 2019-2033, with 2025 as the base and estimated year. The report segments the market by foam type, end-user industry, material type, and expansion rate, offering granular insights for informed decision-making. The market is projected to reach xx Billion by 2033.
Firefighting Foam Market Market Dynamics & Structure
The global firefighting foam market exhibits a moderately concentrated structure, with several key players holding significant market share. Technological innovation, driven by the need for environmentally friendly alternatives to PFAS-containing foams, is a crucial dynamic. Stringent regulations regarding the use and disposal of certain foam types, particularly those containing Per- and Polyfluoroalkyl Substances (PFAS), significantly influence market dynamics. The presence of substitute products, such as water-based extinguishing agents, creates competitive pressure. End-user demographics, primarily driven by the oil & gas, chemical, and transportation sectors, shape demand. The market has witnessed several M&A activities in recent years, further shaping its competitive landscape.
- Market Concentration: Moderately concentrated, with top 5 players holding approximately xx% market share in 2025.
- Technological Innovation: Focus on developing PFAS-free alternatives and improving foam efficiency.
- Regulatory Framework: Stringent regulations on PFAS-containing foams are driving market shifts.
- Competitive Substitutes: Water-based agents and other extinguishing systems pose competition.
- End-User Demographics: Oil & gas, chemical, and transportation sectors are major consumers.
- M&A Trends: xx M&A deals recorded between 2019-2024, with a projected xx deals for 2025-2033. Consolidation expected to continue.
Firefighting Foam Market Growth Trends & Insights
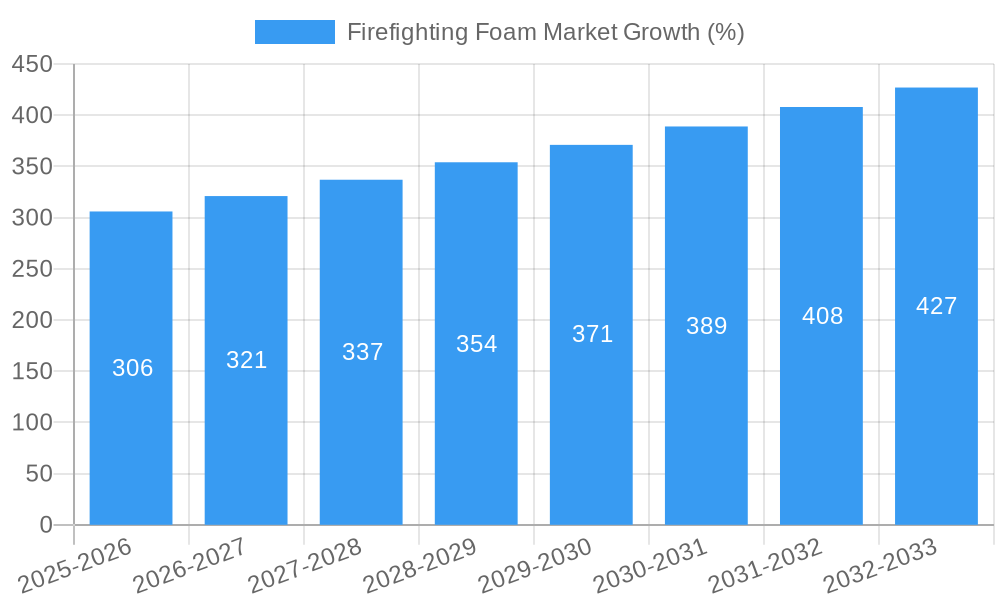
The firefighting foam market has experienced robust growth over the historical period (2019-2024), primarily driven by increasing industrialization, rising safety concerns, and expanding regulations. The market is projected to witness a Compound Annual Growth Rate (CAGR) of xx% during the forecast period (2025-2033), reaching a market size of xx Billion by 2033. This growth is fueled by the increasing demand for effective and environmentally sustainable firefighting solutions. Technological advancements, such as the development of high-expansion foams and PFAS-free alternatives, are further accelerating market adoption. Changing consumer preferences towards safer and eco-friendly products are influencing purchasing decisions. Market penetration is expected to reach xx% by 2033, particularly in developing economies. The shift towards stringent environmental regulations is driving the demand for eco-friendly firefighting foams.
Dominant Regions, Countries, or Segments in Firefighting Foam Market
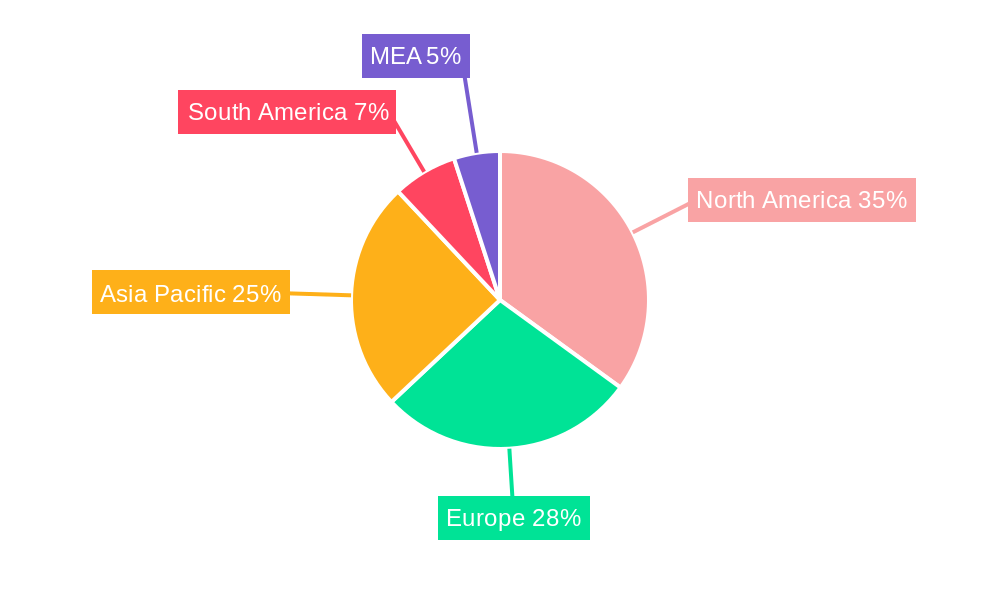
North America currently holds the largest market share, driven by stringent safety regulations and a robust oil & gas sector. However, the Asia-Pacific region is projected to exhibit the highest growth rate during the forecast period due to rapid industrialization and infrastructure development. Within foam types, Aqueous Film Forming Foam (AFFF) and Alcohol Resistant (AR-AFFF) currently dominate, but the demand for Synthetic/Detergent Foam Concentrates is rapidly increasing due to its environmentally friendly nature. The Oil & Gas and Chemical & Pharmaceutical end-user industries are the primary drivers of market growth, owing to their inherent risks and stringent safety protocols.
- Key Drivers: Stringent safety regulations, industrialization, infrastructure development, rising awareness of fire safety.
- Regional Dominance: North America holds the largest market share, while Asia-Pacific shows the highest growth potential.
- Segmental Dominance: AFFF and AR-AFFF hold significant market share, with increasing demand for Synthetic/Detergent Foam Concentrates.
- Growth Potential: Asia-Pacific and the Middle East are poised for significant growth due to industrial expansion and rising safety standards.
Firefighting Foam Market Product Landscape
The firefighting foam market offers a diverse range of products, categorized by foam type, expansion ratio, and material composition. Recent innovations focus on improving foam efficacy, expanding extinguishing capabilities, and reducing environmental impact. Key advancements include the development of PFAS-free formulations and high-expansion foams for enhanced coverage. The unique selling propositions center around enhanced fire suppression capabilities, reduced environmental footprint, and improved application methods.
Key Drivers, Barriers & Challenges in Firefighting Foam Market
Key Drivers:
- Increasing industrialization and urbanization leading to a higher risk of fire incidents.
- Stringent environmental regulations driving the demand for eco-friendly foams.
- Growing awareness of fire safety among industries and the public.
Challenges and Restraints:
- High initial investment costs associated with adopting new firefighting technologies.
- The complexity of managing and disposing of firefighting foams, particularly those containing PFAS.
- Intense competition among existing players, leading to price wars.
- Supply chain disruptions impacting the availability of raw materials. This has impacted production by approximately xx% in 2024.
Emerging Opportunities in Firefighting Foam Market
- Growing demand for sustainable and eco-friendly firefighting foams.
- Expansion into new and untapped markets in developing economies.
- Increasing adoption of advanced firefighting technologies, such as high-expansion foams and robotic systems.
- Opportunities for innovative applications in various sectors beyond traditional firefighting.
Growth Accelerators in the Firefighting Foam Market Industry
Technological advancements in foam formulations, particularly the development of high-performance, environmentally friendly alternatives, are significant growth catalysts. Strategic partnerships between foam manufacturers and end-user industries are streamlining supply chains and accelerating adoption. Market expansion strategies focused on emerging economies are further propelling growth.
Key Players Shaping the Firefighting Foam Market Market
- Angus Fire (UK)
- Loshareh Chemical Industries
- Shanghai Waysmos Fire Suppression Co Ltd
- Solberg
- SFFECO Global
- Johnson Controls
- Pgisystems
- SEPPIC
- Kerr Fire (UK)
- Albilad Fighting Systems Ltd
- National Foam
Notable Milestones in Firefighting Foam Market Sector
- 2022 Q3: Introduction of a new PFAS-free AFFF by National Foam.
- 2021 Q4: Merger between two major players in the European market, leading to increased market concentration.
- 2020 Q1: Implementation of stricter environmental regulations in several regions, impacting the production of PFAS-containing foams.
In-Depth Firefighting Foam Market Market Outlook
The firefighting foam market is poised for sustained growth over the long term, driven by technological innovations, increasing demand for eco-friendly products, and expansion into new markets. Strategic partnerships and investments in research and development will further shape market dynamics. The focus on sustainable and efficient firefighting solutions will remain a key driver of market growth in the coming years. The market is expected to reach xx Billion by 2033, driven by factors like increasing industrialization, stringent safety regulations, and the growing demand for eco-friendly products.
Firefighting Foam Market Segmentation
-
1. Foam Type
- 1.1. Aqueous Film Forming Foam (AFFF)
- 1.2. Alcohol Resistant (AR-AFFF)
- 1.3. Synthetic/Detergent Foam Concentrate
- 1.4. Protein Foam Concentrate
- 1.5. Other Foam Types
-
2. End-user Industry
- 2.1. Oil and Gas
- 2.2. Chemical and Pharmaceutical
- 2.3. Mining
- 2.4. Transportation
- 2.5. Other End-user Industries
Firefighting Foam Market Segmentation By Geography
-
1. Asia Pacific
- 1.1. China
- 1.2. India
- 1.3. Japan
- 1.4. South Korea
- 1.5. Rest of Asia Pacific
-
2. North America
- 2.1. United States
- 2.2. Canada
- 2.3. Mexico
-
3. Europe
- 3.1. Germany
- 3.2. United Kingdom
- 3.3. Italy
- 3.4. France
- 3.5. Rest of Europe
-
4. South America
- 4.1. Brazil
- 4.2. Argentina
- 4.3. Rest of South America
-
5. Middle East and Africa
- 5.1. Saudi Arabia
- 5.2. South Africa
- 5.3. Rest of Middle East and Africa
Firefighting Foam Market REPORT HIGHLIGHTS
| Aspects | Details |
|---|---|
| Study Period | 2019-2033 |
| Base Year | 2024 |
| Estimated Year | 2025 |
| Forecast Period | 2025-2033 |
| Historical Period | 2019-2024 |
| Growth Rate | CAGR of > 4.00% from 2019-2033 |
| Segmentation |
|
Table of Contents
- 1. Introduction
- 1.1. Research Scope
- 1.2. Market Segmentation
- 1.3. Research Methodology
- 1.4. Definitions and Assumptions
- 2. Executive Summary
- 2.1. Introduction
- 3. Market Dynamics
- 3.1. Introduction
- 3.2. Market Drivers
- 3.2.1. Strict Regulations from Governments to Maintain Industrial Safety; Other Drivers
- 3.3. Market Restrains
- 3.3.1. Volatility in the Supply Demand Scenario; Environmental Considerations During Mining Activities
- 3.4. Market Trends
- 3.4.1. Increasing Demand from the Oil and Gas Industry
- 4. Market Factor Analysis
- 4.1. Porters Five Forces
- 4.2. Supply/Value Chain
- 4.3. PESTEL analysis
- 4.4. Market Entropy
- 4.5. Patent/Trademark Analysis
- 5. Global Firefighting Foam Market Analysis, Insights and Forecast, 2019-2031
- 5.1. Market Analysis, Insights and Forecast - by Foam Type
- 5.1.1. Aqueous Film Forming Foam (AFFF)
- 5.1.2. Alcohol Resistant (AR-AFFF)
- 5.1.3. Synthetic/Detergent Foam Concentrate
- 5.1.4. Protein Foam Concentrate
- 5.1.5. Other Foam Types
- 5.2. Market Analysis, Insights and Forecast - by End-user Industry
- 5.2.1. Oil and Gas
- 5.2.2. Chemical and Pharmaceutical
- 5.2.3. Mining
- 5.2.4. Transportation
- 5.2.5. Other End-user Industries
- 5.3. Market Analysis, Insights and Forecast - by Region
- 5.3.1. Asia Pacific
- 5.3.2. North America
- 5.3.3. Europe
- 5.3.4. South America
- 5.3.5. Middle East and Africa
- 5.1. Market Analysis, Insights and Forecast - by Foam Type
- 6. Asia Pacific Firefighting Foam Market Analysis, Insights and Forecast, 2019-2031
- 6.1. Market Analysis, Insights and Forecast - by Foam Type
- 6.1.1. Aqueous Film Forming Foam (AFFF)
- 6.1.2. Alcohol Resistant (AR-AFFF)
- 6.1.3. Synthetic/Detergent Foam Concentrate
- 6.1.4. Protein Foam Concentrate
- 6.1.5. Other Foam Types
- 6.2. Market Analysis, Insights and Forecast - by End-user Industry
- 6.2.1. Oil and Gas
- 6.2.2. Chemical and Pharmaceutical
- 6.2.3. Mining
- 6.2.4. Transportation
- 6.2.5. Other End-user Industries
- 6.1. Market Analysis, Insights and Forecast - by Foam Type
- 7. North America Firefighting Foam Market Analysis, Insights and Forecast, 2019-2031
- 7.1. Market Analysis, Insights and Forecast - by Foam Type
- 7.1.1. Aqueous Film Forming Foam (AFFF)
- 7.1.2. Alcohol Resistant (AR-AFFF)
- 7.1.3. Synthetic/Detergent Foam Concentrate
- 7.1.4. Protein Foam Concentrate
- 7.1.5. Other Foam Types
- 7.2. Market Analysis, Insights and Forecast - by End-user Industry
- 7.2.1. Oil and Gas
- 7.2.2. Chemical and Pharmaceutical
- 7.2.3. Mining
- 7.2.4. Transportation
- 7.2.5. Other End-user Industries
- 7.1. Market Analysis, Insights and Forecast - by Foam Type
- 8. Europe Firefighting Foam Market Analysis, Insights and Forecast, 2019-2031
- 8.1. Market Analysis, Insights and Forecast - by Foam Type
- 8.1.1. Aqueous Film Forming Foam (AFFF)
- 8.1.2. Alcohol Resistant (AR-AFFF)
- 8.1.3. Synthetic/Detergent Foam Concentrate
- 8.1.4. Protein Foam Concentrate
- 8.1.5. Other Foam Types
- 8.2. Market Analysis, Insights and Forecast - by End-user Industry
- 8.2.1. Oil and Gas
- 8.2.2. Chemical and Pharmaceutical
- 8.2.3. Mining
- 8.2.4. Transportation
- 8.2.5. Other End-user Industries
- 8.1. Market Analysis, Insights and Forecast - by Foam Type
- 9. South America Firefighting Foam Market Analysis, Insights and Forecast, 2019-2031
- 9.1. Market Analysis, Insights and Forecast - by Foam Type
- 9.1.1. Aqueous Film Forming Foam (AFFF)
- 9.1.2. Alcohol Resistant (AR-AFFF)
- 9.1.3. Synthetic/Detergent Foam Concentrate
- 9.1.4. Protein Foam Concentrate
- 9.1.5. Other Foam Types
- 9.2. Market Analysis, Insights and Forecast - by End-user Industry
- 9.2.1. Oil and Gas
- 9.2.2. Chemical and Pharmaceutical
- 9.2.3. Mining
- 9.2.4. Transportation
- 9.2.5. Other End-user Industries
- 9.1. Market Analysis, Insights and Forecast - by Foam Type
- 10. Middle East and Africa Firefighting Foam Market Analysis, Insights and Forecast, 2019-2031
- 10.1. Market Analysis, Insights and Forecast - by Foam Type
- 10.1.1. Aqueous Film Forming Foam (AFFF)
- 10.1.2. Alcohol Resistant (AR-AFFF)
- 10.1.3. Synthetic/Detergent Foam Concentrate
- 10.1.4. Protein Foam Concentrate
- 10.1.5. Other Foam Types
- 10.2. Market Analysis, Insights and Forecast - by End-user Industry
- 10.2.1. Oil and Gas
- 10.2.2. Chemical and Pharmaceutical
- 10.2.3. Mining
- 10.2.4. Transportation
- 10.2.5. Other End-user Industries
- 10.1. Market Analysis, Insights and Forecast - by Foam Type
- 11. North America Firefighting Foam Market Analysis, Insights and Forecast, 2019-2031
- 11.1. Market Analysis, Insights and Forecast - By Country/Sub-region
- 11.1.1 United States
- 11.1.2 Canada
- 11.1.3 Mexico
- 12. Europe Firefighting Foam Market Analysis, Insights and Forecast, 2019-2031
- 12.1. Market Analysis, Insights and Forecast - By Country/Sub-region
- 12.1.1 Germany
- 12.1.2 France
- 12.1.3 Italy
- 12.1.4 United Kingdom
- 12.1.5 Netherlands
- 12.1.6 Rest of Europe
- 13. Asia Pacific Firefighting Foam Market Analysis, Insights and Forecast, 2019-2031
- 13.1. Market Analysis, Insights and Forecast - By Country/Sub-region
- 13.1.1 China
- 13.1.2 Japan
- 13.1.3 India
- 13.1.4 South Korea
- 13.1.5 Taiwan
- 13.1.6 Australia
- 13.1.7 Rest of Asia-Pacific
- 14. South America Firefighting Foam Market Analysis, Insights and Forecast, 2019-2031
- 14.1. Market Analysis, Insights and Forecast - By Country/Sub-region
- 14.1.1 Brazil
- 14.1.2 Argentina
- 14.1.3 Rest of South America
- 15. MEA Firefighting Foam Market Analysis, Insights and Forecast, 2019-2031
- 15.1. Market Analysis, Insights and Forecast - By Country/Sub-region
- 15.1.1 Middle East
- 15.1.2 Africa
- 16. Competitive Analysis
- 16.1. Global Market Share Analysis 2024
- 16.2. Company Profiles
- 16.2.1 Angus Fire (UK)
- 16.2.1.1. Overview
- 16.2.1.2. Products
- 16.2.1.3. SWOT Analysis
- 16.2.1.4. Recent Developments
- 16.2.1.5. Financials (Based on Availability)
- 16.2.2 Loshareh Chemical Industries
- 16.2.2.1. Overview
- 16.2.2.2. Products
- 16.2.2.3. SWOT Analysis
- 16.2.2.4. Recent Developments
- 16.2.2.5. Financials (Based on Availability)
- 16.2.3 Shanghai Waysmos Fire Suppression Co Ltd
- 16.2.3.1. Overview
- 16.2.3.2. Products
- 16.2.3.3. SWOT Analysis
- 16.2.3.4. Recent Developments
- 16.2.3.5. Financials (Based on Availability)
- 16.2.4 Solberg
- 16.2.4.1. Overview
- 16.2.4.2. Products
- 16.2.4.3. SWOT Analysis
- 16.2.4.4. Recent Developments
- 16.2.4.5. Financials (Based on Availability)
- 16.2.5 SFFECO Global
- 16.2.5.1. Overview
- 16.2.5.2. Products
- 16.2.5.3. SWOT Analysis
- 16.2.5.4. Recent Developments
- 16.2.5.5. Financials (Based on Availability)
- 16.2.6 Johnson Controls
- 16.2.6.1. Overview
- 16.2.6.2. Products
- 16.2.6.3. SWOT Analysis
- 16.2.6.4. Recent Developments
- 16.2.6.5. Financials (Based on Availability)
- 16.2.7 Pgisystems
- 16.2.7.1. Overview
- 16.2.7.2. Products
- 16.2.7.3. SWOT Analysis
- 16.2.7.4. Recent Developments
- 16.2.7.5. Financials (Based on Availability)
- 16.2.8 SEPPIC
- 16.2.8.1. Overview
- 16.2.8.2. Products
- 16.2.8.3. SWOT Analysis
- 16.2.8.4. Recent Developments
- 16.2.8.5. Financials (Based on Availability)
- 16.2.9 Kerr Fire (UK)
- 16.2.9.1. Overview
- 16.2.9.2. Products
- 16.2.9.3. SWOT Analysis
- 16.2.9.4. Recent Developments
- 16.2.9.5. Financials (Based on Availability)
- 16.2.10 Albilad Fighting Systems Ltd
- 16.2.10.1. Overview
- 16.2.10.2. Products
- 16.2.10.3. SWOT Analysis
- 16.2.10.4. Recent Developments
- 16.2.10.5. Financials (Based on Availability)
- 16.2.11 National Foam
- 16.2.11.1. Overview
- 16.2.11.2. Products
- 16.2.11.3. SWOT Analysis
- 16.2.11.4. Recent Developments
- 16.2.11.5. Financials (Based on Availability)
- 16.2.1 Angus Fire (UK)
List of Figures
- Figure 1: Global Firefighting Foam Market Revenue Breakdown (Billion, %) by Region 2024 & 2032
- Figure 2: Global Firefighting Foam Market Volume Breakdown (K Tons, %) by Region 2024 & 2032
- Figure 3: North America Firefighting Foam Market Revenue (Billion), by Country 2024 & 2032
- Figure 4: North America Firefighting Foam Market Volume (K Tons), by Country 2024 & 2032
- Figure 5: North America Firefighting Foam Market Revenue Share (%), by Country 2024 & 2032
- Figure 6: North America Firefighting Foam Market Volume Share (%), by Country 2024 & 2032
- Figure 7: Europe Firefighting Foam Market Revenue (Billion), by Country 2024 & 2032
- Figure 8: Europe Firefighting Foam Market Volume (K Tons), by Country 2024 & 2032
- Figure 9: Europe Firefighting Foam Market Revenue Share (%), by Country 2024 & 2032
- Figure 10: Europe Firefighting Foam Market Volume Share (%), by Country 2024 & 2032
- Figure 11: Asia Pacific Firefighting Foam Market Revenue (Billion), by Country 2024 & 2032
- Figure 12: Asia Pacific Firefighting Foam Market Volume (K Tons), by Country 2024 & 2032
- Figure 13: Asia Pacific Firefighting Foam Market Revenue Share (%), by Country 2024 & 2032
- Figure 14: Asia Pacific Firefighting Foam Market Volume Share (%), by Country 2024 & 2032
- Figure 15: South America Firefighting Foam Market Revenue (Billion), by Country 2024 & 2032
- Figure 16: South America Firefighting Foam Market Volume (K Tons), by Country 2024 & 2032
- Figure 17: South America Firefighting Foam Market Revenue Share (%), by Country 2024 & 2032
- Figure 18: South America Firefighting Foam Market Volume Share (%), by Country 2024 & 2032
- Figure 19: MEA Firefighting Foam Market Revenue (Billion), by Country 2024 & 2032
- Figure 20: MEA Firefighting Foam Market Volume (K Tons), by Country 2024 & 2032
- Figure 21: MEA Firefighting Foam Market Revenue Share (%), by Country 2024 & 2032
- Figure 22: MEA Firefighting Foam Market Volume Share (%), by Country 2024 & 2032
- Figure 23: Asia Pacific Firefighting Foam Market Revenue (Billion), by Foam Type 2024 & 2032
- Figure 24: Asia Pacific Firefighting Foam Market Volume (K Tons), by Foam Type 2024 & 2032
- Figure 25: Asia Pacific Firefighting Foam Market Revenue Share (%), by Foam Type 2024 & 2032
- Figure 26: Asia Pacific Firefighting Foam Market Volume Share (%), by Foam Type 2024 & 2032
- Figure 27: Asia Pacific Firefighting Foam Market Revenue (Billion), by End-user Industry 2024 & 2032
- Figure 28: Asia Pacific Firefighting Foam Market Volume (K Tons), by End-user Industry 2024 & 2032
- Figure 29: Asia Pacific Firefighting Foam Market Revenue Share (%), by End-user Industry 2024 & 2032
- Figure 30: Asia Pacific Firefighting Foam Market Volume Share (%), by End-user Industry 2024 & 2032
- Figure 31: Asia Pacific Firefighting Foam Market Revenue (Billion), by Country 2024 & 2032
- Figure 32: Asia Pacific Firefighting Foam Market Volume (K Tons), by Country 2024 & 2032
- Figure 33: Asia Pacific Firefighting Foam Market Revenue Share (%), by Country 2024 & 2032
- Figure 34: Asia Pacific Firefighting Foam Market Volume Share (%), by Country 2024 & 2032
- Figure 35: North America Firefighting Foam Market Revenue (Billion), by Foam Type 2024 & 2032
- Figure 36: North America Firefighting Foam Market Volume (K Tons), by Foam Type 2024 & 2032
- Figure 37: North America Firefighting Foam Market Revenue Share (%), by Foam Type 2024 & 2032
- Figure 38: North America Firefighting Foam Market Volume Share (%), by Foam Type 2024 & 2032
- Figure 39: North America Firefighting Foam Market Revenue (Billion), by End-user Industry 2024 & 2032
- Figure 40: North America Firefighting Foam Market Volume (K Tons), by End-user Industry 2024 & 2032
- Figure 41: North America Firefighting Foam Market Revenue Share (%), by End-user Industry 2024 & 2032
- Figure 42: North America Firefighting Foam Market Volume Share (%), by End-user Industry 2024 & 2032
- Figure 43: North America Firefighting Foam Market Revenue (Billion), by Country 2024 & 2032
- Figure 44: North America Firefighting Foam Market Volume (K Tons), by Country 2024 & 2032
- Figure 45: North America Firefighting Foam Market Revenue Share (%), by Country 2024 & 2032
- Figure 46: North America Firefighting Foam Market Volume Share (%), by Country 2024 & 2032
- Figure 47: Europe Firefighting Foam Market Revenue (Billion), by Foam Type 2024 & 2032
- Figure 48: Europe Firefighting Foam Market Volume (K Tons), by Foam Type 2024 & 2032
- Figure 49: Europe Firefighting Foam Market Revenue Share (%), by Foam Type 2024 & 2032
- Figure 50: Europe Firefighting Foam Market Volume Share (%), by Foam Type 2024 & 2032
- Figure 51: Europe Firefighting Foam Market Revenue (Billion), by End-user Industry 2024 & 2032
- Figure 52: Europe Firefighting Foam Market Volume (K Tons), by End-user Industry 2024 & 2032
- Figure 53: Europe Firefighting Foam Market Revenue Share (%), by End-user Industry 2024 & 2032
- Figure 54: Europe Firefighting Foam Market Volume Share (%), by End-user Industry 2024 & 2032
- Figure 55: Europe Firefighting Foam Market Revenue (Billion), by Country 2024 & 2032
- Figure 56: Europe Firefighting Foam Market Volume (K Tons), by Country 2024 & 2032
- Figure 57: Europe Firefighting Foam Market Revenue Share (%), by Country 2024 & 2032
- Figure 58: Europe Firefighting Foam Market Volume Share (%), by Country 2024 & 2032
- Figure 59: South America Firefighting Foam Market Revenue (Billion), by Foam Type 2024 & 2032
- Figure 60: South America Firefighting Foam Market Volume (K Tons), by Foam Type 2024 & 2032
- Figure 61: South America Firefighting Foam Market Revenue Share (%), by Foam Type 2024 & 2032
- Figure 62: South America Firefighting Foam Market Volume Share (%), by Foam Type 2024 & 2032
- Figure 63: South America Firefighting Foam Market Revenue (Billion), by End-user Industry 2024 & 2032
- Figure 64: South America Firefighting Foam Market Volume (K Tons), by End-user Industry 2024 & 2032
- Figure 65: South America Firefighting Foam Market Revenue Share (%), by End-user Industry 2024 & 2032
- Figure 66: South America Firefighting Foam Market Volume Share (%), by End-user Industry 2024 & 2032
- Figure 67: South America Firefighting Foam Market Revenue (Billion), by Country 2024 & 2032
- Figure 68: South America Firefighting Foam Market Volume (K Tons), by Country 2024 & 2032
- Figure 69: South America Firefighting Foam Market Revenue Share (%), by Country 2024 & 2032
- Figure 70: South America Firefighting Foam Market Volume Share (%), by Country 2024 & 2032
- Figure 71: Middle East and Africa Firefighting Foam Market Revenue (Billion), by Foam Type 2024 & 2032
- Figure 72: Middle East and Africa Firefighting Foam Market Volume (K Tons), by Foam Type 2024 & 2032
- Figure 73: Middle East and Africa Firefighting Foam Market Revenue Share (%), by Foam Type 2024 & 2032
- Figure 74: Middle East and Africa Firefighting Foam Market Volume Share (%), by Foam Type 2024 & 2032
- Figure 75: Middle East and Africa Firefighting Foam Market Revenue (Billion), by End-user Industry 2024 & 2032
- Figure 76: Middle East and Africa Firefighting Foam Market Volume (K Tons), by End-user Industry 2024 & 2032
- Figure 77: Middle East and Africa Firefighting Foam Market Revenue Share (%), by End-user Industry 2024 & 2032
- Figure 78: Middle East and Africa Firefighting Foam Market Volume Share (%), by End-user Industry 2024 & 2032
- Figure 79: Middle East and Africa Firefighting Foam Market Revenue (Billion), by Country 2024 & 2032
- Figure 80: Middle East and Africa Firefighting Foam Market Volume (K Tons), by Country 2024 & 2032
- Figure 81: Middle East and Africa Firefighting Foam Market Revenue Share (%), by Country 2024 & 2032
- Figure 82: Middle East and Africa Firefighting Foam Market Volume Share (%), by Country 2024 & 2032
List of Tables
- Table 1: Global Firefighting Foam Market Revenue Billion Forecast, by Region 2019 & 2032
- Table 2: Global Firefighting Foam Market Volume K Tons Forecast, by Region 2019 & 2032
- Table 3: Global Firefighting Foam Market Revenue Billion Forecast, by Foam Type 2019 & 2032
- Table 4: Global Firefighting Foam Market Volume K Tons Forecast, by Foam Type 2019 & 2032
- Table 5: Global Firefighting Foam Market Revenue Billion Forecast, by End-user Industry 2019 & 2032
- Table 6: Global Firefighting Foam Market Volume K Tons Forecast, by End-user Industry 2019 & 2032
- Table 7: Global Firefighting Foam Market Revenue Billion Forecast, by Region 2019 & 2032
- Table 8: Global Firefighting Foam Market Volume K Tons Forecast, by Region 2019 & 2032
- Table 9: Global Firefighting Foam Market Revenue Billion Forecast, by Country 2019 & 2032
- Table 10: Global Firefighting Foam Market Volume K Tons Forecast, by Country 2019 & 2032
- Table 11: United States Firefighting Foam Market Revenue (Billion) Forecast, by Application 2019 & 2032
- Table 12: United States Firefighting Foam Market Volume (K Tons) Forecast, by Application 2019 & 2032
- Table 13: Canada Firefighting Foam Market Revenue (Billion) Forecast, by Application 2019 & 2032
- Table 14: Canada Firefighting Foam Market Volume (K Tons) Forecast, by Application 2019 & 2032
- Table 15: Mexico Firefighting Foam Market Revenue (Billion) Forecast, by Application 2019 & 2032
- Table 16: Mexico Firefighting Foam Market Volume (K Tons) Forecast, by Application 2019 & 2032
- Table 17: Global Firefighting Foam Market Revenue Billion Forecast, by Country 2019 & 2032
- Table 18: Global Firefighting Foam Market Volume K Tons Forecast, by Country 2019 & 2032
- Table 19: Germany Firefighting Foam Market Revenue (Billion) Forecast, by Application 2019 & 2032
- Table 20: Germany Firefighting Foam Market Volume (K Tons) Forecast, by Application 2019 & 2032
- Table 21: France Firefighting Foam Market Revenue (Billion) Forecast, by Application 2019 & 2032
- Table 22: France Firefighting Foam Market Volume (K Tons) Forecast, by Application 2019 & 2032
- Table 23: Italy Firefighting Foam Market Revenue (Billion) Forecast, by Application 2019 & 2032
- Table 24: Italy Firefighting Foam Market Volume (K Tons) Forecast, by Application 2019 & 2032
- Table 25: United Kingdom Firefighting Foam Market Revenue (Billion) Forecast, by Application 2019 & 2032
- Table 26: United Kingdom Firefighting Foam Market Volume (K Tons) Forecast, by Application 2019 & 2032
- Table 27: Netherlands Firefighting Foam Market Revenue (Billion) Forecast, by Application 2019 & 2032
- Table 28: Netherlands Firefighting Foam Market Volume (K Tons) Forecast, by Application 2019 & 2032
- Table 29: Rest of Europe Firefighting Foam Market Revenue (Billion) Forecast, by Application 2019 & 2032
- Table 30: Rest of Europe Firefighting Foam Market Volume (K Tons) Forecast, by Application 2019 & 2032
- Table 31: Global Firefighting Foam Market Revenue Billion Forecast, by Country 2019 & 2032
- Table 32: Global Firefighting Foam Market Volume K Tons Forecast, by Country 2019 & 2032
- Table 33: China Firefighting Foam Market Revenue (Billion) Forecast, by Application 2019 & 2032
- Table 34: China Firefighting Foam Market Volume (K Tons) Forecast, by Application 2019 & 2032
- Table 35: Japan Firefighting Foam Market Revenue (Billion) Forecast, by Application 2019 & 2032
- Table 36: Japan Firefighting Foam Market Volume (K Tons) Forecast, by Application 2019 & 2032
- Table 37: India Firefighting Foam Market Revenue (Billion) Forecast, by Application 2019 & 2032
- Table 38: India Firefighting Foam Market Volume (K Tons) Forecast, by Application 2019 & 2032
- Table 39: South Korea Firefighting Foam Market Revenue (Billion) Forecast, by Application 2019 & 2032
- Table 40: South Korea Firefighting Foam Market Volume (K Tons) Forecast, by Application 2019 & 2032
- Table 41: Taiwan Firefighting Foam Market Revenue (Billion) Forecast, by Application 2019 & 2032
- Table 42: Taiwan Firefighting Foam Market Volume (K Tons) Forecast, by Application 2019 & 2032
- Table 43: Australia Firefighting Foam Market Revenue (Billion) Forecast, by Application 2019 & 2032
- Table 44: Australia Firefighting Foam Market Volume (K Tons) Forecast, by Application 2019 & 2032
- Table 45: Rest of Asia-Pacific Firefighting Foam Market Revenue (Billion) Forecast, by Application 2019 & 2032
- Table 46: Rest of Asia-Pacific Firefighting Foam Market Volume (K Tons) Forecast, by Application 2019 & 2032
- Table 47: Global Firefighting Foam Market Revenue Billion Forecast, by Country 2019 & 2032
- Table 48: Global Firefighting Foam Market Volume K Tons Forecast, by Country 2019 & 2032
- Table 49: Brazil Firefighting Foam Market Revenue (Billion) Forecast, by Application 2019 & 2032
- Table 50: Brazil Firefighting Foam Market Volume (K Tons) Forecast, by Application 2019 & 2032
- Table 51: Argentina Firefighting Foam Market Revenue (Billion) Forecast, by Application 2019 & 2032
- Table 52: Argentina Firefighting Foam Market Volume (K Tons) Forecast, by Application 2019 & 2032
- Table 53: Rest of South America Firefighting Foam Market Revenue (Billion) Forecast, by Application 2019 & 2032
- Table 54: Rest of South America Firefighting Foam Market Volume (K Tons) Forecast, by Application 2019 & 2032
- Table 55: Global Firefighting Foam Market Revenue Billion Forecast, by Country 2019 & 2032
- Table 56: Global Firefighting Foam Market Volume K Tons Forecast, by Country 2019 & 2032
- Table 57: Middle East Firefighting Foam Market Revenue (Billion) Forecast, by Application 2019 & 2032
- Table 58: Middle East Firefighting Foam Market Volume (K Tons) Forecast, by Application 2019 & 2032
- Table 59: Africa Firefighting Foam Market Revenue (Billion) Forecast, by Application 2019 & 2032
- Table 60: Africa Firefighting Foam Market Volume (K Tons) Forecast, by Application 2019 & 2032
- Table 61: Global Firefighting Foam Market Revenue Billion Forecast, by Foam Type 2019 & 2032
- Table 62: Global Firefighting Foam Market Volume K Tons Forecast, by Foam Type 2019 & 2032
- Table 63: Global Firefighting Foam Market Revenue Billion Forecast, by End-user Industry 2019 & 2032
- Table 64: Global Firefighting Foam Market Volume K Tons Forecast, by End-user Industry 2019 & 2032
- Table 65: Global Firefighting Foam Market Revenue Billion Forecast, by Country 2019 & 2032
- Table 66: Global Firefighting Foam Market Volume K Tons Forecast, by Country 2019 & 2032
- Table 67: China Firefighting Foam Market Revenue (Billion) Forecast, by Application 2019 & 2032
- Table 68: China Firefighting Foam Market Volume (K Tons) Forecast, by Application 2019 & 2032
- Table 69: India Firefighting Foam Market Revenue (Billion) Forecast, by Application 2019 & 2032
- Table 70: India Firefighting Foam Market Volume (K Tons) Forecast, by Application 2019 & 2032
- Table 71: Japan Firefighting Foam Market Revenue (Billion) Forecast, by Application 2019 & 2032
- Table 72: Japan Firefighting Foam Market Volume (K Tons) Forecast, by Application 2019 & 2032
- Table 73: South Korea Firefighting Foam Market Revenue (Billion) Forecast, by Application 2019 & 2032
- Table 74: South Korea Firefighting Foam Market Volume (K Tons) Forecast, by Application 2019 & 2032
- Table 75: Rest of Asia Pacific Firefighting Foam Market Revenue (Billion) Forecast, by Application 2019 & 2032
- Table 76: Rest of Asia Pacific Firefighting Foam Market Volume (K Tons) Forecast, by Application 2019 & 2032
- Table 77: Global Firefighting Foam Market Revenue Billion Forecast, by Foam Type 2019 & 2032
- Table 78: Global Firefighting Foam Market Volume K Tons Forecast, by Foam Type 2019 & 2032
- Table 79: Global Firefighting Foam Market Revenue Billion Forecast, by End-user Industry 2019 & 2032
- Table 80: Global Firefighting Foam Market Volume K Tons Forecast, by End-user Industry 2019 & 2032
- Table 81: Global Firefighting Foam Market Revenue Billion Forecast, by Country 2019 & 2032
- Table 82: Global Firefighting Foam Market Volume K Tons Forecast, by Country 2019 & 2032
- Table 83: United States Firefighting Foam Market Revenue (Billion) Forecast, by Application 2019 & 2032
- Table 84: United States Firefighting Foam Market Volume (K Tons) Forecast, by Application 2019 & 2032
- Table 85: Canada Firefighting Foam Market Revenue (Billion) Forecast, by Application 2019 & 2032
- Table 86: Canada Firefighting Foam Market Volume (K Tons) Forecast, by Application 2019 & 2032
- Table 87: Mexico Firefighting Foam Market Revenue (Billion) Forecast, by Application 2019 & 2032
- Table 88: Mexico Firefighting Foam Market Volume (K Tons) Forecast, by Application 2019 & 2032
- Table 89: Global Firefighting Foam Market Revenue Billion Forecast, by Foam Type 2019 & 2032
- Table 90: Global Firefighting Foam Market Volume K Tons Forecast, by Foam Type 2019 & 2032
- Table 91: Global Firefighting Foam Market Revenue Billion Forecast, by End-user Industry 2019 & 2032
- Table 92: Global Firefighting Foam Market Volume K Tons Forecast, by End-user Industry 2019 & 2032
- Table 93: Global Firefighting Foam Market Revenue Billion Forecast, by Country 2019 & 2032
- Table 94: Global Firefighting Foam Market Volume K Tons Forecast, by Country 2019 & 2032
- Table 95: Germany Firefighting Foam Market Revenue (Billion) Forecast, by Application 2019 & 2032
- Table 96: Germany Firefighting Foam Market Volume (K Tons) Forecast, by Application 2019 & 2032
- Table 97: United Kingdom Firefighting Foam Market Revenue (Billion) Forecast, by Application 2019 & 2032
- Table 98: United Kingdom Firefighting Foam Market Volume (K Tons) Forecast, by Application 2019 & 2032
- Table 99: Italy Firefighting Foam Market Revenue (Billion) Forecast, by Application 2019 & 2032
- Table 100: Italy Firefighting Foam Market Volume (K Tons) Forecast, by Application 2019 & 2032
- Table 101: France Firefighting Foam Market Revenue (Billion) Forecast, by Application 2019 & 2032
- Table 102: France Firefighting Foam Market Volume (K Tons) Forecast, by Application 2019 & 2032
- Table 103: Rest of Europe Firefighting Foam Market Revenue (Billion) Forecast, by Application 2019 & 2032
- Table 104: Rest of Europe Firefighting Foam Market Volume (K Tons) Forecast, by Application 2019 & 2032
- Table 105: Global Firefighting Foam Market Revenue Billion Forecast, by Foam Type 2019 & 2032
- Table 106: Global Firefighting Foam Market Volume K Tons Forecast, by Foam Type 2019 & 2032
- Table 107: Global Firefighting Foam Market Revenue Billion Forecast, by End-user Industry 2019 & 2032
- Table 108: Global Firefighting Foam Market Volume K Tons Forecast, by End-user Industry 2019 & 2032
- Table 109: Global Firefighting Foam Market Revenue Billion Forecast, by Country 2019 & 2032
- Table 110: Global Firefighting Foam Market Volume K Tons Forecast, by Country 2019 & 2032
- Table 111: Brazil Firefighting Foam Market Revenue (Billion) Forecast, by Application 2019 & 2032
- Table 112: Brazil Firefighting Foam Market Volume (K Tons) Forecast, by Application 2019 & 2032
- Table 113: Argentina Firefighting Foam Market Revenue (Billion) Forecast, by Application 2019 & 2032
- Table 114: Argentina Firefighting Foam Market Volume (K Tons) Forecast, by Application 2019 & 2032
- Table 115: Rest of South America Firefighting Foam Market Revenue (Billion) Forecast, by Application 2019 & 2032
- Table 116: Rest of South America Firefighting Foam Market Volume (K Tons) Forecast, by Application 2019 & 2032
- Table 117: Global Firefighting Foam Market Revenue Billion Forecast, by Foam Type 2019 & 2032
- Table 118: Global Firefighting Foam Market Volume K Tons Forecast, by Foam Type 2019 & 2032
- Table 119: Global Firefighting Foam Market Revenue Billion Forecast, by End-user Industry 2019 & 2032
- Table 120: Global Firefighting Foam Market Volume K Tons Forecast, by End-user Industry 2019 & 2032
- Table 121: Global Firefighting Foam Market Revenue Billion Forecast, by Country 2019 & 2032
- Table 122: Global Firefighting Foam Market Volume K Tons Forecast, by Country 2019 & 2032
- Table 123: Saudi Arabia Firefighting Foam Market Revenue (Billion) Forecast, by Application 2019 & 2032
- Table 124: Saudi Arabia Firefighting Foam Market Volume (K Tons) Forecast, by Application 2019 & 2032
- Table 125: South Africa Firefighting Foam Market Revenue (Billion) Forecast, by Application 2019 & 2032
- Table 126: South Africa Firefighting Foam Market Volume (K Tons) Forecast, by Application 2019 & 2032
- Table 127: Rest of Middle East and Africa Firefighting Foam Market Revenue (Billion) Forecast, by Application 2019 & 2032
- Table 128: Rest of Middle East and Africa Firefighting Foam Market Volume (K Tons) Forecast, by Application 2019 & 2032
Frequently Asked Questions
1. What is the projected Compound Annual Growth Rate (CAGR) of the Firefighting Foam Market?
The projected CAGR is approximately > 4.00%.
2. Which companies are prominent players in the Firefighting Foam Market?
Key companies in the market include Angus Fire (UK), Loshareh Chemical Industries, Shanghai Waysmos Fire Suppression Co Ltd, Solberg, SFFECO Global, Johnson Controls, Pgisystems, SEPPIC, Kerr Fire (UK), Albilad Fighting Systems Ltd, National Foam.
3. What are the main segments of the Firefighting Foam Market?
The market segments include Foam Type, End-user Industry.
4. Can you provide details about the market size?
The market size is estimated to be USD 7.3 Billion as of 2022.
5. What are some drivers contributing to market growth?
Strict Regulations from Governments to Maintain Industrial Safety; Other Drivers.
6. What are the notable trends driving market growth?
Increasing Demand from the Oil and Gas Industry.
7. Are there any restraints impacting market growth?
Volatility in the Supply Demand Scenario; Environmental Considerations During Mining Activities.
8. Can you provide examples of recent developments in the market?
N/A
9. What pricing options are available for accessing the report?
Pricing options include single-user, multi-user, and enterprise licenses priced at USD 4750, USD 5250, and USD 8750 respectively.
10. Is the market size provided in terms of value or volume?
The market size is provided in terms of value, measured in Billion and volume, measured in K Tons.
11. Are there any specific market keywords associated with the report?
Yes, the market keyword associated with the report is "Firefighting Foam Market," which aids in identifying and referencing the specific market segment covered.
12. How do I determine which pricing option suits my needs best?
The pricing options vary based on user requirements and access needs. Individual users may opt for single-user licenses, while businesses requiring broader access may choose multi-user or enterprise licenses for cost-effective access to the report.
13. Are there any additional resources or data provided in the Firefighting Foam Market report?
While the report offers comprehensive insights, it's advisable to review the specific contents or supplementary materials provided to ascertain if additional resources or data are available.
14. How can I stay updated on further developments or reports in the Firefighting Foam Market?
To stay informed about further developments, trends, and reports in the Firefighting Foam Market, consider subscribing to industry newsletters, following relevant companies and organizations, or regularly checking reputable industry news sources and publications.
Methodology
Step 1 - Identification of Relevant Samples Size from Population Database


Step 2 - Approaches for Defining Global Market Size (Value, Volume* & Price*)

Note*: In applicable scenarios
Step 3 - Data Sources
Primary Research
- Web Analytics
- Survey Reports
- Research Institute
- Latest Research Reports
- Opinion Leaders
Secondary Research
- Annual Reports
- White Paper
- Latest Press Release
- Industry Association
- Paid Database
- Investor Presentations

Step 4 - Data Triangulation
Involves using different sources of information in order to increase the validity of a study
These sources are likely to be stakeholders in a program - participants, other researchers, program staff, other community members, and so on.
Then we put all data in single framework & apply various statistical tools to find out the dynamic on the market.
During the analysis stage, feedback from the stakeholder groups would be compared to determine areas of agreement as well as areas of divergence


