
Key Insights
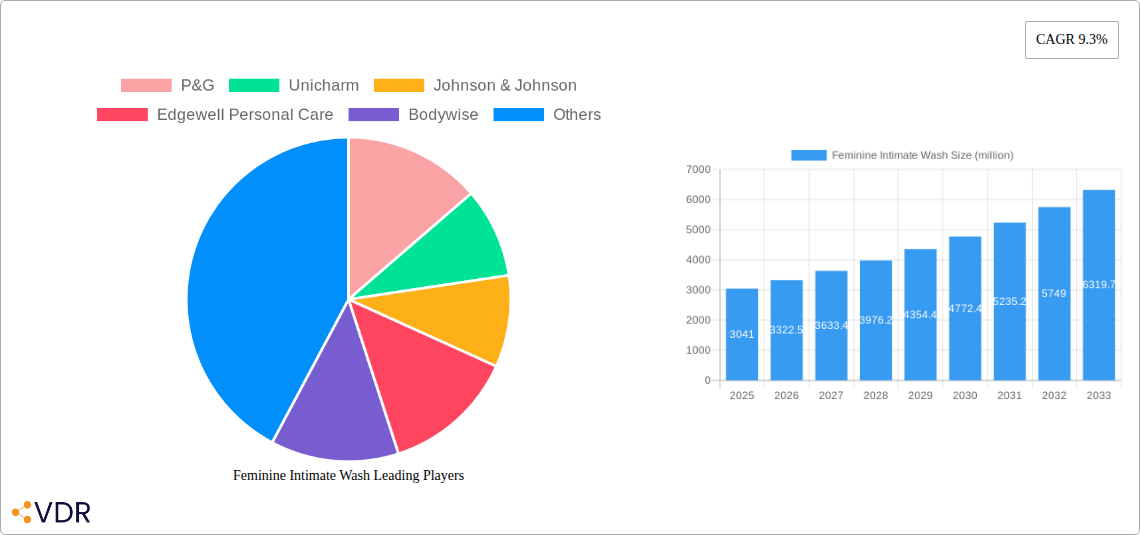
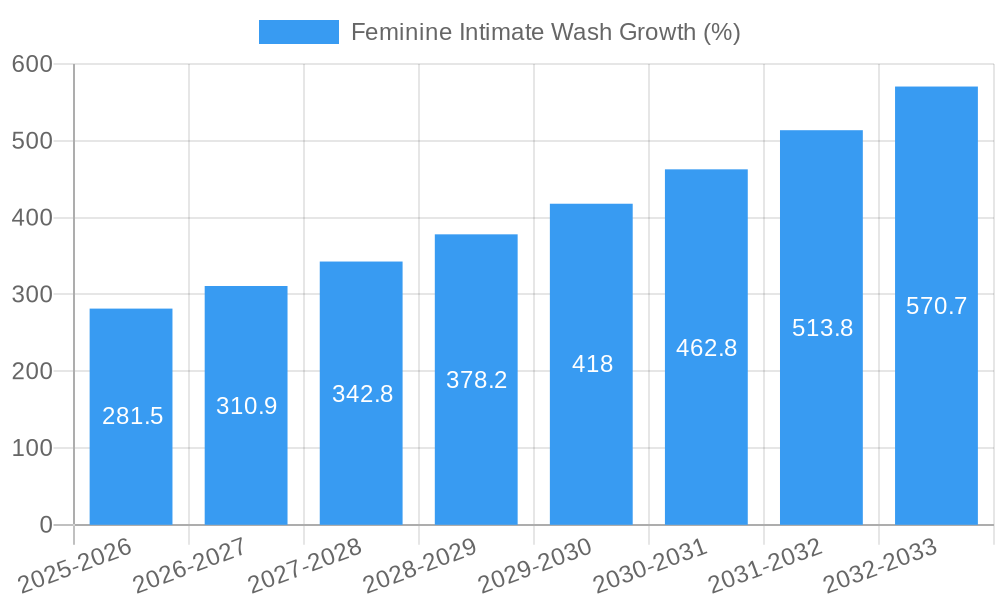
The feminine intimate wash market, valued at approximately $3.041 billion in 2025, is experiencing robust growth, projected to expand at a Compound Annual Growth Rate (CAGR) of 9.3% from 2025 to 2033. This growth is driven by several factors. Increasing awareness of feminine hygiene and its importance for overall health is a key driver. The rising disposable income, especially in emerging economies, is enabling greater access to premium and specialized products within this category. Furthermore, the shift towards natural and organic ingredients, coupled with a growing demand for products addressing specific concerns like dryness, irritation, and odor, is fueling innovation and market expansion. Major players like P&G, Unicharm, and Johnson & Johnson dominate the market, leveraging their established brand recognition and extensive distribution networks. However, the entry of smaller, niche brands focused on specific consumer needs and natural formulations presents a competitive landscape. The market also shows segmentation based on product type (e.g., pH-balanced washes, anti-bacterial washes, organic washes), price points, and distribution channels (online vs. offline).
The market's future trajectory will likely be shaped by several trends. The increasing adoption of e-commerce and online retail channels will continue to influence distribution and accessibility. The burgeoning demand for personalized solutions, along with a strong emphasis on sustainability and environmentally friendly packaging, will drive product development and innovation. While the market faces some restraints such as potential regulatory changes and ingredient sourcing challenges, the overall positive growth outlook is driven by the ever-increasing focus on women's health and well-being globally. The continued expansion into untapped markets and the introduction of innovative formulations will further propel the market's growth in the coming years.
Feminine Intimate Wash Market Report: 2019-2033
This comprehensive report provides a deep dive into the global feminine intimate wash market, offering invaluable insights for industry professionals, investors, and strategic decision-makers. The report analyzes market dynamics, growth trends, regional variations, competitive landscapes, and future opportunities across the parent market of feminine hygiene and the child market of intimate care products. The study period covers 2019-2033, with a base year of 2025 and a forecast period of 2025-2033. Market size is expressed in million units.
Feminine Intimate Wash Market Dynamics & Structure
The feminine intimate wash market is characterized by a moderate level of concentration, with key players like P&G, Unicharm, and Johnson & Johnson holding significant market share (estimated at xx%, xx%, and xx% respectively in 2025). However, the market also features numerous smaller players and niche brands catering to specific consumer needs. Technological innovation, driven by advancements in formulations and packaging, is a key driver. Stringent regulatory frameworks concerning safety and efficacy influence product development and marketing claims. The market faces competition from traditional soap and water, as well as other hygiene products. End-user demographics are shifting towards increased awareness and demand for specialized products, particularly among younger demographics. M&A activity in the sector has been relatively low in recent years (xx deals in 2019-2024), with larger companies focusing more on organic growth and product diversification.
- Market Concentration: Moderately concentrated, with top 3 players holding xx% combined market share in 2025.
- Innovation Drivers: Advancements in natural ingredients, sustainable packaging, and targeted formulations.
- Regulatory Landscape: Stringent regulations regarding ingredients and labeling claims.
- Competitive Substitutes: Traditional soap and water, other hygiene products.
- End-User Demographics: Growing awareness and demand, especially amongst younger generations.
- M&A Activity: Relatively low, with xx deals recorded between 2019 and 2024.
Feminine Intimate Wash Growth Trends & Insights
The feminine intimate wash market experienced robust growth during the historical period (2019-2024), with a CAGR of xx%. This growth is attributed to increased awareness of intimate hygiene, changing consumer preferences towards specialized products, and rising disposable incomes in developing economies. Market penetration is currently estimated at xx% in 2025 and is projected to increase to xx% by 2033. Technological disruptions, such as the introduction of pH-balancing formulations and eco-friendly packaging, are further fueling market expansion. Consumer behavior shifts, including a preference for natural and organic ingredients, are creating new opportunities for specialized brands. The market is expected to maintain a healthy growth trajectory during the forecast period (2025-2033), driven by these factors and expanding product portfolios. The forecasted CAGR is expected to be xx%.
Dominant Regions, Countries, or Segments in Feminine Intimate Wash
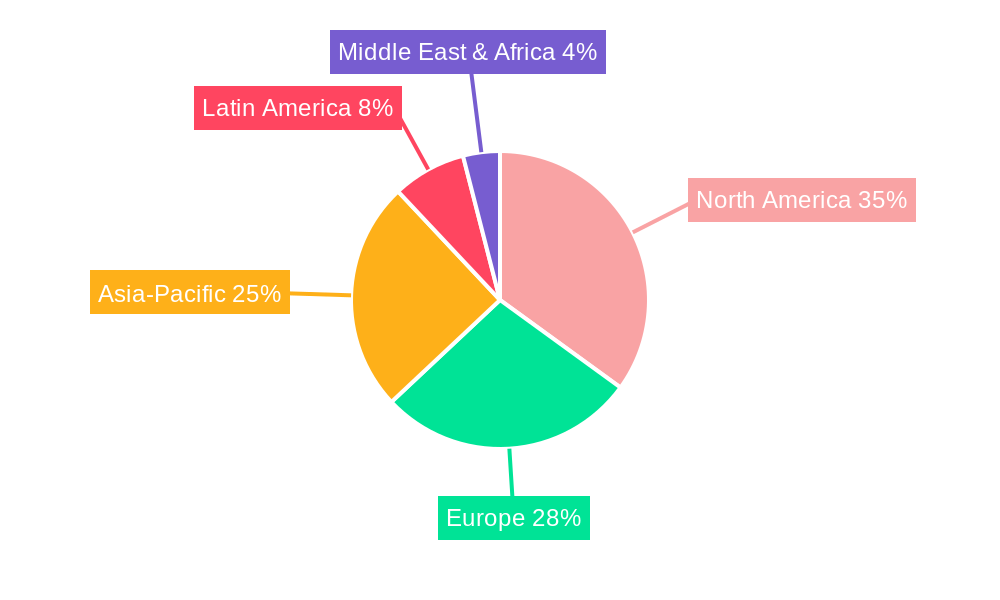
North America currently holds the largest market share in the feminine intimate wash segment (estimated at xx% in 2025), driven by high consumer awareness and the presence of established players. However, Asia-Pacific is projected to witness the fastest growth rate during the forecast period, fueled by rising disposable incomes, increasing urbanization, and growing awareness of feminine hygiene in developing countries like India and China. The organic/natural segment is also experiencing strong growth, driven by increasing consumer preference for natural ingredients.
- North America: High market share due to established players and high consumer awareness.
- Asia-Pacific: Fastest growth rate, driven by rising incomes and growing awareness.
- Organic/Natural Segment: Strong growth due to increasing consumer preference for natural ingredients.
- Key Drivers: Rising disposable incomes, increasing urbanization, and growing awareness of feminine hygiene.
Feminine Intimate Wash Product Landscape
The feminine intimate wash product landscape is diverse, ranging from basic cleansers to specialized formulations targeting specific concerns like dryness, odor, or irritation. Innovations focus on gentle, pH-balanced formulas with natural ingredients, sustainable packaging, and convenient formats. Unique selling propositions often highlight specific benefits, such as soothing properties, odor neutralization, or maintaining vaginal pH balance. Technological advancements include the incorporation of prebiotics and probiotics to support healthy vaginal flora.
Key Drivers, Barriers & Challenges in Feminine Intimate Wash
Key Drivers:
- Rising awareness of intimate hygiene and its importance for overall health.
- Increasing disposable incomes and changing lifestyles in developing economies.
- Growing preference for natural and organic ingredients.
- Technological advancements leading to improved product formulations and packaging.
Challenges & Restraints:
- Stringent regulatory requirements and varying standards across different regions can hinder product launches and market expansion.
- Intense competition from established players and the emergence of new entrants.
- Concerns about the potential impact of certain ingredients on vaginal health can affect consumer trust and brand loyalty.
- Supply chain disruptions caused by global events (e.g. pandemics) can influence production and pricing.
Emerging Opportunities in Feminine Intimate Wash
- Untapped Markets: Expansion into developing countries with growing awareness of feminine hygiene.
- Innovative Applications: Development of products addressing specific health concerns (e.g., post-partum care, menopause).
- Evolving Consumer Preferences: Increased demand for personalized products with natural and sustainable ingredients.
Growth Accelerators in the Feminine Intimate Wash Industry
Technological breakthroughs in formulations (e.g., microbiome-friendly products) and packaging (e.g., sustainable materials) will drive long-term growth. Strategic partnerships and collaborations between manufacturers and healthcare providers can expand market reach and build consumer trust. Furthermore, aggressive market expansion strategies targeting both developed and developing economies will play a crucial role in shaping future growth.
Key Players Shaping the Feminine Intimate Wash Market
- P&G
- Unicharm
- Johnson & Johnson
- Edgewell Personal Care
- Bodywise
- Lemisol
- Healthy Hoohoo
- Sliquid
- Nature Certified
- V Wash Plus
- Inlife
- Organyc
- Summer’s Eve
- Vagisil
- Luvena
- Emerita
- The Honey Pot
- LACTACYD
- SweetSpot
- CORA
- Masmi
- Albaad Deutschland GmbH
- Corman SpA
- COTTON HIGH TECH SL
- Daio Paper Corp.
- Diva International Inc.
- Essity Aktiebolag
- First Quality Enterprises Inc.
- Hengan International Group Co. Ltd.
- Kao Corp.
Notable Milestones in Feminine Intimate Wash Sector
- 2020: Increased focus on sustainable packaging across multiple brands.
- 2021: Launch of several new products with microbiome-friendly formulations.
- 2022: Acquisition of a smaller intimate wash brand by a major player (xx).
- 2023: Increased regulatory scrutiny on ingredient claims.
- 2024: Launch of several new products with targeted benefits for various age groups.
In-Depth Feminine Intimate Wash Market Outlook
The feminine intimate wash market is poised for continued growth, driven by factors such as increasing consumer awareness, product innovation, and expansion into new markets. Strategic opportunities exist in developing innovative formulations addressing unmet needs, adopting sustainable practices, and strengthening brand engagement through targeted marketing. The market is expected to reach xx million units by 2033, presenting significant potential for both established and emerging players.
Feminine Intimate Wash Segmentation
-
1. Application
- 1.1. For Whole Body
- 1.2. For a specific part
-
2. Types
- 2.1. Foam Wash
- 2.2. Liquid Wash
- 2.3. Others
Feminine Intimate Wash Segmentation By Geography
-
1. North America
- 1.1. United States
- 1.2. Canada
- 1.3. Mexico
-
2. South America
- 2.1. Brazil
- 2.2. Argentina
- 2.3. Rest of South America
-
3. Europe
- 3.1. United Kingdom
- 3.2. Germany
- 3.3. France
- 3.4. Italy
- 3.5. Spain
- 3.6. Russia
- 3.7. Benelux
- 3.8. Nordics
- 3.9. Rest of Europe
-
4. Middle East & Africa
- 4.1. Turkey
- 4.2. Israel
- 4.3. GCC
- 4.4. North Africa
- 4.5. South Africa
- 4.6. Rest of Middle East & Africa
-
5. Asia Pacific
- 5.1. China
- 5.2. India
- 5.3. Japan
- 5.4. South Korea
- 5.5. ASEAN
- 5.6. Oceania
- 5.7. Rest of Asia Pacific
Feminine Intimate Wash REPORT HIGHLIGHTS
| Aspects | Details |
|---|---|
| Study Period | 2019-2033 |
| Base Year | 2024 |
| Estimated Year | 2025 |
| Forecast Period | 2025-2033 |
| Historical Period | 2019-2024 |
| Growth Rate | CAGR of 9.3% from 2019-2033 |
| Segmentation |
|
Table of Contents
- 1. Introduction
- 1.1. Research Scope
- 1.2. Market Segmentation
- 1.3. Research Methodology
- 1.4. Definitions and Assumptions
- 2. Executive Summary
- 2.1. Introduction
- 3. Market Dynamics
- 3.1. Introduction
- 3.2. Market Drivers
- 3.3. Market Restrains
- 3.4. Market Trends
- 4. Market Factor Analysis
- 4.1. Porters Five Forces
- 4.2. Supply/Value Chain
- 4.3. PESTEL analysis
- 4.4. Market Entropy
- 4.5. Patent/Trademark Analysis
- 5. Global Feminine Intimate Wash Analysis, Insights and Forecast, 2019-2031
- 5.1. Market Analysis, Insights and Forecast - by Application
- 5.1.1. For Whole Body
- 5.1.2. For a specific part
- 5.2. Market Analysis, Insights and Forecast - by Types
- 5.2.1. Foam Wash
- 5.2.2. Liquid Wash
- 5.2.3. Others
- 5.3. Market Analysis, Insights and Forecast - by Region
- 5.3.1. North America
- 5.3.2. South America
- 5.3.3. Europe
- 5.3.4. Middle East & Africa
- 5.3.5. Asia Pacific
- 5.1. Market Analysis, Insights and Forecast - by Application
- 6. North America Feminine Intimate Wash Analysis, Insights and Forecast, 2019-2031
- 6.1. Market Analysis, Insights and Forecast - by Application
- 6.1.1. For Whole Body
- 6.1.2. For a specific part
- 6.2. Market Analysis, Insights and Forecast - by Types
- 6.2.1. Foam Wash
- 6.2.2. Liquid Wash
- 6.2.3. Others
- 6.1. Market Analysis, Insights and Forecast - by Application
- 7. South America Feminine Intimate Wash Analysis, Insights and Forecast, 2019-2031
- 7.1. Market Analysis, Insights and Forecast - by Application
- 7.1.1. For Whole Body
- 7.1.2. For a specific part
- 7.2. Market Analysis, Insights and Forecast - by Types
- 7.2.1. Foam Wash
- 7.2.2. Liquid Wash
- 7.2.3. Others
- 7.1. Market Analysis, Insights and Forecast - by Application
- 8. Europe Feminine Intimate Wash Analysis, Insights and Forecast, 2019-2031
- 8.1. Market Analysis, Insights and Forecast - by Application
- 8.1.1. For Whole Body
- 8.1.2. For a specific part
- 8.2. Market Analysis, Insights and Forecast - by Types
- 8.2.1. Foam Wash
- 8.2.2. Liquid Wash
- 8.2.3. Others
- 8.1. Market Analysis, Insights and Forecast - by Application
- 9. Middle East & Africa Feminine Intimate Wash Analysis, Insights and Forecast, 2019-2031
- 9.1. Market Analysis, Insights and Forecast - by Application
- 9.1.1. For Whole Body
- 9.1.2. For a specific part
- 9.2. Market Analysis, Insights and Forecast - by Types
- 9.2.1. Foam Wash
- 9.2.2. Liquid Wash
- 9.2.3. Others
- 9.1. Market Analysis, Insights and Forecast - by Application
- 10. Asia Pacific Feminine Intimate Wash Analysis, Insights and Forecast, 2019-2031
- 10.1. Market Analysis, Insights and Forecast - by Application
- 10.1.1. For Whole Body
- 10.1.2. For a specific part
- 10.2. Market Analysis, Insights and Forecast - by Types
- 10.2.1. Foam Wash
- 10.2.2. Liquid Wash
- 10.2.3. Others
- 10.1. Market Analysis, Insights and Forecast - by Application
- 11. Competitive Analysis
- 11.1. Global Market Share Analysis 2024
- 11.2. Company Profiles
- 11.2.1 P&G
- 11.2.1.1. Overview
- 11.2.1.2. Products
- 11.2.1.3. SWOT Analysis
- 11.2.1.4. Recent Developments
- 11.2.1.5. Financials (Based on Availability)
- 11.2.2 Unicharm
- 11.2.2.1. Overview
- 11.2.2.2. Products
- 11.2.2.3. SWOT Analysis
- 11.2.2.4. Recent Developments
- 11.2.2.5. Financials (Based on Availability)
- 11.2.3 Johnson & Johnson
- 11.2.3.1. Overview
- 11.2.3.2. Products
- 11.2.3.3. SWOT Analysis
- 11.2.3.4. Recent Developments
- 11.2.3.5. Financials (Based on Availability)
- 11.2.4 Edgewell Personal Care
- 11.2.4.1. Overview
- 11.2.4.2. Products
- 11.2.4.3. SWOT Analysis
- 11.2.4.4. Recent Developments
- 11.2.4.5. Financials (Based on Availability)
- 11.2.5 Bodywise
- 11.2.5.1. Overview
- 11.2.5.2. Products
- 11.2.5.3. SWOT Analysis
- 11.2.5.4. Recent Developments
- 11.2.5.5. Financials (Based on Availability)
- 11.2.6 Lemisol
- 11.2.6.1. Overview
- 11.2.6.2. Products
- 11.2.6.3. SWOT Analysis
- 11.2.6.4. Recent Developments
- 11.2.6.5. Financials (Based on Availability)
- 11.2.7 Healthy Hoohoo
- 11.2.7.1. Overview
- 11.2.7.2. Products
- 11.2.7.3. SWOT Analysis
- 11.2.7.4. Recent Developments
- 11.2.7.5. Financials (Based on Availability)
- 11.2.8 Sliquid
- 11.2.8.1. Overview
- 11.2.8.2. Products
- 11.2.8.3. SWOT Analysis
- 11.2.8.4. Recent Developments
- 11.2.8.5. Financials (Based on Availability)
- 11.2.9 Nature Certified
- 11.2.9.1. Overview
- 11.2.9.2. Products
- 11.2.9.3. SWOT Analysis
- 11.2.9.4. Recent Developments
- 11.2.9.5. Financials (Based on Availability)
- 11.2.10 V Wash Plus
- 11.2.10.1. Overview
- 11.2.10.2. Products
- 11.2.10.3. SWOT Analysis
- 11.2.10.4. Recent Developments
- 11.2.10.5. Financials (Based on Availability)
- 11.2.11 Inlife
- 11.2.11.1. Overview
- 11.2.11.2. Products
- 11.2.11.3. SWOT Analysis
- 11.2.11.4. Recent Developments
- 11.2.11.5. Financials (Based on Availability)
- 11.2.12 Organyc
- 11.2.12.1. Overview
- 11.2.12.2. Products
- 11.2.12.3. SWOT Analysis
- 11.2.12.4. Recent Developments
- 11.2.12.5. Financials (Based on Availability)
- 11.2.13 Summer’s Eve
- 11.2.13.1. Overview
- 11.2.13.2. Products
- 11.2.13.3. SWOT Analysis
- 11.2.13.4. Recent Developments
- 11.2.13.5. Financials (Based on Availability)
- 11.2.14 Vagisil
- 11.2.14.1. Overview
- 11.2.14.2. Products
- 11.2.14.3. SWOT Analysis
- 11.2.14.4. Recent Developments
- 11.2.14.5. Financials (Based on Availability)
- 11.2.15 Luvena
- 11.2.15.1. Overview
- 11.2.15.2. Products
- 11.2.15.3. SWOT Analysis
- 11.2.15.4. Recent Developments
- 11.2.15.5. Financials (Based on Availability)
- 11.2.16 Emerita
- 11.2.16.1. Overview
- 11.2.16.2. Products
- 11.2.16.3. SWOT Analysis
- 11.2.16.4. Recent Developments
- 11.2.16.5. Financials (Based on Availability)
- 11.2.17 The Honey Pot
- 11.2.17.1. Overview
- 11.2.17.2. Products
- 11.2.17.3. SWOT Analysis
- 11.2.17.4. Recent Developments
- 11.2.17.5. Financials (Based on Availability)
- 11.2.18 LACTACYD
- 11.2.18.1. Overview
- 11.2.18.2. Products
- 11.2.18.3. SWOT Analysis
- 11.2.18.4. Recent Developments
- 11.2.18.5. Financials (Based on Availability)
- 11.2.19 SweetSpot
- 11.2.19.1. Overview
- 11.2.19.2. Products
- 11.2.19.3. SWOT Analysis
- 11.2.19.4. Recent Developments
- 11.2.19.5. Financials (Based on Availability)
- 11.2.20 CORA
- 11.2.20.1. Overview
- 11.2.20.2. Products
- 11.2.20.3. SWOT Analysis
- 11.2.20.4. Recent Developments
- 11.2.20.5. Financials (Based on Availability)
- 11.2.21 Masmi
- 11.2.21.1. Overview
- 11.2.21.2. Products
- 11.2.21.3. SWOT Analysis
- 11.2.21.4. Recent Developments
- 11.2.21.5. Financials (Based on Availability)
- 11.2.22 Albaad Deutschland GmbH
- 11.2.22.1. Overview
- 11.2.22.2. Products
- 11.2.22.3. SWOT Analysis
- 11.2.22.4. Recent Developments
- 11.2.22.5. Financials (Based on Availability)
- 11.2.23 Corman SpA
- 11.2.23.1. Overview
- 11.2.23.2. Products
- 11.2.23.3. SWOT Analysis
- 11.2.23.4. Recent Developments
- 11.2.23.5. Financials (Based on Availability)
- 11.2.24 COTTON HIGH TECH SL
- 11.2.24.1. Overview
- 11.2.24.2. Products
- 11.2.24.3. SWOT Analysis
- 11.2.24.4. Recent Developments
- 11.2.24.5. Financials (Based on Availability)
- 11.2.25 Daio Paper Corp.
- 11.2.25.1. Overview
- 11.2.25.2. Products
- 11.2.25.3. SWOT Analysis
- 11.2.25.4. Recent Developments
- 11.2.25.5. Financials (Based on Availability)
- 11.2.26 Diva International Inc.
- 11.2.26.1. Overview
- 11.2.26.2. Products
- 11.2.26.3. SWOT Analysis
- 11.2.26.4. Recent Developments
- 11.2.26.5. Financials (Based on Availability)
- 11.2.27 Essity Aktiebolag
- 11.2.27.1. Overview
- 11.2.27.2. Products
- 11.2.27.3. SWOT Analysis
- 11.2.27.4. Recent Developments
- 11.2.27.5. Financials (Based on Availability)
- 11.2.28 First Quality Enterprises Inc.
- 11.2.28.1. Overview
- 11.2.28.2. Products
- 11.2.28.3. SWOT Analysis
- 11.2.28.4. Recent Developments
- 11.2.28.5. Financials (Based on Availability)
- 11.2.29 Hengan International Group Co. Ltd.
- 11.2.29.1. Overview
- 11.2.29.2. Products
- 11.2.29.3. SWOT Analysis
- 11.2.29.4. Recent Developments
- 11.2.29.5. Financials (Based on Availability)
- 11.2.30 Kao Corp.
- 11.2.30.1. Overview
- 11.2.30.2. Products
- 11.2.30.3. SWOT Analysis
- 11.2.30.4. Recent Developments
- 11.2.30.5. Financials (Based on Availability)
- 11.2.1 P&G
List of Figures
- Figure 1: Global Feminine Intimate Wash Revenue Breakdown (million, %) by Region 2024 & 2032
- Figure 2: Global Feminine Intimate Wash Volume Breakdown (K, %) by Region 2024 & 2032
- Figure 3: North America Feminine Intimate Wash Revenue (million), by Application 2024 & 2032
- Figure 4: North America Feminine Intimate Wash Volume (K), by Application 2024 & 2032
- Figure 5: North America Feminine Intimate Wash Revenue Share (%), by Application 2024 & 2032
- Figure 6: North America Feminine Intimate Wash Volume Share (%), by Application 2024 & 2032
- Figure 7: North America Feminine Intimate Wash Revenue (million), by Types 2024 & 2032
- Figure 8: North America Feminine Intimate Wash Volume (K), by Types 2024 & 2032
- Figure 9: North America Feminine Intimate Wash Revenue Share (%), by Types 2024 & 2032
- Figure 10: North America Feminine Intimate Wash Volume Share (%), by Types 2024 & 2032
- Figure 11: North America Feminine Intimate Wash Revenue (million), by Country 2024 & 2032
- Figure 12: North America Feminine Intimate Wash Volume (K), by Country 2024 & 2032
- Figure 13: North America Feminine Intimate Wash Revenue Share (%), by Country 2024 & 2032
- Figure 14: North America Feminine Intimate Wash Volume Share (%), by Country 2024 & 2032
- Figure 15: South America Feminine Intimate Wash Revenue (million), by Application 2024 & 2032
- Figure 16: South America Feminine Intimate Wash Volume (K), by Application 2024 & 2032
- Figure 17: South America Feminine Intimate Wash Revenue Share (%), by Application 2024 & 2032
- Figure 18: South America Feminine Intimate Wash Volume Share (%), by Application 2024 & 2032
- Figure 19: South America Feminine Intimate Wash Revenue (million), by Types 2024 & 2032
- Figure 20: South America Feminine Intimate Wash Volume (K), by Types 2024 & 2032
- Figure 21: South America Feminine Intimate Wash Revenue Share (%), by Types 2024 & 2032
- Figure 22: South America Feminine Intimate Wash Volume Share (%), by Types 2024 & 2032
- Figure 23: South America Feminine Intimate Wash Revenue (million), by Country 2024 & 2032
- Figure 24: South America Feminine Intimate Wash Volume (K), by Country 2024 & 2032
- Figure 25: South America Feminine Intimate Wash Revenue Share (%), by Country 2024 & 2032
- Figure 26: South America Feminine Intimate Wash Volume Share (%), by Country 2024 & 2032
- Figure 27: Europe Feminine Intimate Wash Revenue (million), by Application 2024 & 2032
- Figure 28: Europe Feminine Intimate Wash Volume (K), by Application 2024 & 2032
- Figure 29: Europe Feminine Intimate Wash Revenue Share (%), by Application 2024 & 2032
- Figure 30: Europe Feminine Intimate Wash Volume Share (%), by Application 2024 & 2032
- Figure 31: Europe Feminine Intimate Wash Revenue (million), by Types 2024 & 2032
- Figure 32: Europe Feminine Intimate Wash Volume (K), by Types 2024 & 2032
- Figure 33: Europe Feminine Intimate Wash Revenue Share (%), by Types 2024 & 2032
- Figure 34: Europe Feminine Intimate Wash Volume Share (%), by Types 2024 & 2032
- Figure 35: Europe Feminine Intimate Wash Revenue (million), by Country 2024 & 2032
- Figure 36: Europe Feminine Intimate Wash Volume (K), by Country 2024 & 2032
- Figure 37: Europe Feminine Intimate Wash Revenue Share (%), by Country 2024 & 2032
- Figure 38: Europe Feminine Intimate Wash Volume Share (%), by Country 2024 & 2032
- Figure 39: Middle East & Africa Feminine Intimate Wash Revenue (million), by Application 2024 & 2032
- Figure 40: Middle East & Africa Feminine Intimate Wash Volume (K), by Application 2024 & 2032
- Figure 41: Middle East & Africa Feminine Intimate Wash Revenue Share (%), by Application 2024 & 2032
- Figure 42: Middle East & Africa Feminine Intimate Wash Volume Share (%), by Application 2024 & 2032
- Figure 43: Middle East & Africa Feminine Intimate Wash Revenue (million), by Types 2024 & 2032
- Figure 44: Middle East & Africa Feminine Intimate Wash Volume (K), by Types 2024 & 2032
- Figure 45: Middle East & Africa Feminine Intimate Wash Revenue Share (%), by Types 2024 & 2032
- Figure 46: Middle East & Africa Feminine Intimate Wash Volume Share (%), by Types 2024 & 2032
- Figure 47: Middle East & Africa Feminine Intimate Wash Revenue (million), by Country 2024 & 2032
- Figure 48: Middle East & Africa Feminine Intimate Wash Volume (K), by Country 2024 & 2032
- Figure 49: Middle East & Africa Feminine Intimate Wash Revenue Share (%), by Country 2024 & 2032
- Figure 50: Middle East & Africa Feminine Intimate Wash Volume Share (%), by Country 2024 & 2032
- Figure 51: Asia Pacific Feminine Intimate Wash Revenue (million), by Application 2024 & 2032
- Figure 52: Asia Pacific Feminine Intimate Wash Volume (K), by Application 2024 & 2032
- Figure 53: Asia Pacific Feminine Intimate Wash Revenue Share (%), by Application 2024 & 2032
- Figure 54: Asia Pacific Feminine Intimate Wash Volume Share (%), by Application 2024 & 2032
- Figure 55: Asia Pacific Feminine Intimate Wash Revenue (million), by Types 2024 & 2032
- Figure 56: Asia Pacific Feminine Intimate Wash Volume (K), by Types 2024 & 2032
- Figure 57: Asia Pacific Feminine Intimate Wash Revenue Share (%), by Types 2024 & 2032
- Figure 58: Asia Pacific Feminine Intimate Wash Volume Share (%), by Types 2024 & 2032
- Figure 59: Asia Pacific Feminine Intimate Wash Revenue (million), by Country 2024 & 2032
- Figure 60: Asia Pacific Feminine Intimate Wash Volume (K), by Country 2024 & 2032
- Figure 61: Asia Pacific Feminine Intimate Wash Revenue Share (%), by Country 2024 & 2032
- Figure 62: Asia Pacific Feminine Intimate Wash Volume Share (%), by Country 2024 & 2032
List of Tables
- Table 1: Global Feminine Intimate Wash Revenue million Forecast, by Region 2019 & 2032
- Table 2: Global Feminine Intimate Wash Volume K Forecast, by Region 2019 & 2032
- Table 3: Global Feminine Intimate Wash Revenue million Forecast, by Application 2019 & 2032
- Table 4: Global Feminine Intimate Wash Volume K Forecast, by Application 2019 & 2032
- Table 5: Global Feminine Intimate Wash Revenue million Forecast, by Types 2019 & 2032
- Table 6: Global Feminine Intimate Wash Volume K Forecast, by Types 2019 & 2032
- Table 7: Global Feminine Intimate Wash Revenue million Forecast, by Region 2019 & 2032
- Table 8: Global Feminine Intimate Wash Volume K Forecast, by Region 2019 & 2032
- Table 9: Global Feminine Intimate Wash Revenue million Forecast, by Application 2019 & 2032
- Table 10: Global Feminine Intimate Wash Volume K Forecast, by Application 2019 & 2032
- Table 11: Global Feminine Intimate Wash Revenue million Forecast, by Types 2019 & 2032
- Table 12: Global Feminine Intimate Wash Volume K Forecast, by Types 2019 & 2032
- Table 13: Global Feminine Intimate Wash Revenue million Forecast, by Country 2019 & 2032
- Table 14: Global Feminine Intimate Wash Volume K Forecast, by Country 2019 & 2032
- Table 15: United States Feminine Intimate Wash Revenue (million) Forecast, by Application 2019 & 2032
- Table 16: United States Feminine Intimate Wash Volume (K) Forecast, by Application 2019 & 2032
- Table 17: Canada Feminine Intimate Wash Revenue (million) Forecast, by Application 2019 & 2032
- Table 18: Canada Feminine Intimate Wash Volume (K) Forecast, by Application 2019 & 2032
- Table 19: Mexico Feminine Intimate Wash Revenue (million) Forecast, by Application 2019 & 2032
- Table 20: Mexico Feminine Intimate Wash Volume (K) Forecast, by Application 2019 & 2032
- Table 21: Global Feminine Intimate Wash Revenue million Forecast, by Application 2019 & 2032
- Table 22: Global Feminine Intimate Wash Volume K Forecast, by Application 2019 & 2032
- Table 23: Global Feminine Intimate Wash Revenue million Forecast, by Types 2019 & 2032
- Table 24: Global Feminine Intimate Wash Volume K Forecast, by Types 2019 & 2032
- Table 25: Global Feminine Intimate Wash Revenue million Forecast, by Country 2019 & 2032
- Table 26: Global Feminine Intimate Wash Volume K Forecast, by Country 2019 & 2032
- Table 27: Brazil Feminine Intimate Wash Revenue (million) Forecast, by Application 2019 & 2032
- Table 28: Brazil Feminine Intimate Wash Volume (K) Forecast, by Application 2019 & 2032
- Table 29: Argentina Feminine Intimate Wash Revenue (million) Forecast, by Application 2019 & 2032
- Table 30: Argentina Feminine Intimate Wash Volume (K) Forecast, by Application 2019 & 2032
- Table 31: Rest of South America Feminine Intimate Wash Revenue (million) Forecast, by Application 2019 & 2032
- Table 32: Rest of South America Feminine Intimate Wash Volume (K) Forecast, by Application 2019 & 2032
- Table 33: Global Feminine Intimate Wash Revenue million Forecast, by Application 2019 & 2032
- Table 34: Global Feminine Intimate Wash Volume K Forecast, by Application 2019 & 2032
- Table 35: Global Feminine Intimate Wash Revenue million Forecast, by Types 2019 & 2032
- Table 36: Global Feminine Intimate Wash Volume K Forecast, by Types 2019 & 2032
- Table 37: Global Feminine Intimate Wash Revenue million Forecast, by Country 2019 & 2032
- Table 38: Global Feminine Intimate Wash Volume K Forecast, by Country 2019 & 2032
- Table 39: United Kingdom Feminine Intimate Wash Revenue (million) Forecast, by Application 2019 & 2032
- Table 40: United Kingdom Feminine Intimate Wash Volume (K) Forecast, by Application 2019 & 2032
- Table 41: Germany Feminine Intimate Wash Revenue (million) Forecast, by Application 2019 & 2032
- Table 42: Germany Feminine Intimate Wash Volume (K) Forecast, by Application 2019 & 2032
- Table 43: France Feminine Intimate Wash Revenue (million) Forecast, by Application 2019 & 2032
- Table 44: France Feminine Intimate Wash Volume (K) Forecast, by Application 2019 & 2032
- Table 45: Italy Feminine Intimate Wash Revenue (million) Forecast, by Application 2019 & 2032
- Table 46: Italy Feminine Intimate Wash Volume (K) Forecast, by Application 2019 & 2032
- Table 47: Spain Feminine Intimate Wash Revenue (million) Forecast, by Application 2019 & 2032
- Table 48: Spain Feminine Intimate Wash Volume (K) Forecast, by Application 2019 & 2032
- Table 49: Russia Feminine Intimate Wash Revenue (million) Forecast, by Application 2019 & 2032
- Table 50: Russia Feminine Intimate Wash Volume (K) Forecast, by Application 2019 & 2032
- Table 51: Benelux Feminine Intimate Wash Revenue (million) Forecast, by Application 2019 & 2032
- Table 52: Benelux Feminine Intimate Wash Volume (K) Forecast, by Application 2019 & 2032
- Table 53: Nordics Feminine Intimate Wash Revenue (million) Forecast, by Application 2019 & 2032
- Table 54: Nordics Feminine Intimate Wash Volume (K) Forecast, by Application 2019 & 2032
- Table 55: Rest of Europe Feminine Intimate Wash Revenue (million) Forecast, by Application 2019 & 2032
- Table 56: Rest of Europe Feminine Intimate Wash Volume (K) Forecast, by Application 2019 & 2032
- Table 57: Global Feminine Intimate Wash Revenue million Forecast, by Application 2019 & 2032
- Table 58: Global Feminine Intimate Wash Volume K Forecast, by Application 2019 & 2032
- Table 59: Global Feminine Intimate Wash Revenue million Forecast, by Types 2019 & 2032
- Table 60: Global Feminine Intimate Wash Volume K Forecast, by Types 2019 & 2032
- Table 61: Global Feminine Intimate Wash Revenue million Forecast, by Country 2019 & 2032
- Table 62: Global Feminine Intimate Wash Volume K Forecast, by Country 2019 & 2032
- Table 63: Turkey Feminine Intimate Wash Revenue (million) Forecast, by Application 2019 & 2032
- Table 64: Turkey Feminine Intimate Wash Volume (K) Forecast, by Application 2019 & 2032
- Table 65: Israel Feminine Intimate Wash Revenue (million) Forecast, by Application 2019 & 2032
- Table 66: Israel Feminine Intimate Wash Volume (K) Forecast, by Application 2019 & 2032
- Table 67: GCC Feminine Intimate Wash Revenue (million) Forecast, by Application 2019 & 2032
- Table 68: GCC Feminine Intimate Wash Volume (K) Forecast, by Application 2019 & 2032
- Table 69: North Africa Feminine Intimate Wash Revenue (million) Forecast, by Application 2019 & 2032
- Table 70: North Africa Feminine Intimate Wash Volume (K) Forecast, by Application 2019 & 2032
- Table 71: South Africa Feminine Intimate Wash Revenue (million) Forecast, by Application 2019 & 2032
- Table 72: South Africa Feminine Intimate Wash Volume (K) Forecast, by Application 2019 & 2032
- Table 73: Rest of Middle East & Africa Feminine Intimate Wash Revenue (million) Forecast, by Application 2019 & 2032
- Table 74: Rest of Middle East & Africa Feminine Intimate Wash Volume (K) Forecast, by Application 2019 & 2032
- Table 75: Global Feminine Intimate Wash Revenue million Forecast, by Application 2019 & 2032
- Table 76: Global Feminine Intimate Wash Volume K Forecast, by Application 2019 & 2032
- Table 77: Global Feminine Intimate Wash Revenue million Forecast, by Types 2019 & 2032
- Table 78: Global Feminine Intimate Wash Volume K Forecast, by Types 2019 & 2032
- Table 79: Global Feminine Intimate Wash Revenue million Forecast, by Country 2019 & 2032
- Table 80: Global Feminine Intimate Wash Volume K Forecast, by Country 2019 & 2032
- Table 81: China Feminine Intimate Wash Revenue (million) Forecast, by Application 2019 & 2032
- Table 82: China Feminine Intimate Wash Volume (K) Forecast, by Application 2019 & 2032
- Table 83: India Feminine Intimate Wash Revenue (million) Forecast, by Application 2019 & 2032
- Table 84: India Feminine Intimate Wash Volume (K) Forecast, by Application 2019 & 2032
- Table 85: Japan Feminine Intimate Wash Revenue (million) Forecast, by Application 2019 & 2032
- Table 86: Japan Feminine Intimate Wash Volume (K) Forecast, by Application 2019 & 2032
- Table 87: South Korea Feminine Intimate Wash Revenue (million) Forecast, by Application 2019 & 2032
- Table 88: South Korea Feminine Intimate Wash Volume (K) Forecast, by Application 2019 & 2032
- Table 89: ASEAN Feminine Intimate Wash Revenue (million) Forecast, by Application 2019 & 2032
- Table 90: ASEAN Feminine Intimate Wash Volume (K) Forecast, by Application 2019 & 2032
- Table 91: Oceania Feminine Intimate Wash Revenue (million) Forecast, by Application 2019 & 2032
- Table 92: Oceania Feminine Intimate Wash Volume (K) Forecast, by Application 2019 & 2032
- Table 93: Rest of Asia Pacific Feminine Intimate Wash Revenue (million) Forecast, by Application 2019 & 2032
- Table 94: Rest of Asia Pacific Feminine Intimate Wash Volume (K) Forecast, by Application 2019 & 2032
Frequently Asked Questions
1. What is the projected Compound Annual Growth Rate (CAGR) of the Feminine Intimate Wash?
The projected CAGR is approximately 9.3%.
2. Which companies are prominent players in the Feminine Intimate Wash?
Key companies in the market include P&G, Unicharm, Johnson & Johnson, Edgewell Personal Care, Bodywise, Lemisol, Healthy Hoohoo, Sliquid, Nature Certified, V Wash Plus, Inlife, Organyc, Summer’s Eve, Vagisil, Luvena, Emerita, The Honey Pot, LACTACYD, SweetSpot, CORA, Masmi, Albaad Deutschland GmbH, Corman SpA, COTTON HIGH TECH SL, Daio Paper Corp., Diva International Inc., Essity Aktiebolag, First Quality Enterprises Inc., Hengan International Group Co. Ltd., Kao Corp..
3. What are the main segments of the Feminine Intimate Wash?
The market segments include Application, Types.
4. Can you provide details about the market size?
The market size is estimated to be USD 3041 million as of 2022.
5. What are some drivers contributing to market growth?
N/A
6. What are the notable trends driving market growth?
N/A
7. Are there any restraints impacting market growth?
N/A
8. Can you provide examples of recent developments in the market?
N/A
9. What pricing options are available for accessing the report?
Pricing options include single-user, multi-user, and enterprise licenses priced at USD 3350.00, USD 5025.00, and USD 6700.00 respectively.
10. Is the market size provided in terms of value or volume?
The market size is provided in terms of value, measured in million and volume, measured in K.
11. Are there any specific market keywords associated with the report?
Yes, the market keyword associated with the report is "Feminine Intimate Wash," which aids in identifying and referencing the specific market segment covered.
12. How do I determine which pricing option suits my needs best?
The pricing options vary based on user requirements and access needs. Individual users may opt for single-user licenses, while businesses requiring broader access may choose multi-user or enterprise licenses for cost-effective access to the report.
13. Are there any additional resources or data provided in the Feminine Intimate Wash report?
While the report offers comprehensive insights, it's advisable to review the specific contents or supplementary materials provided to ascertain if additional resources or data are available.
14. How can I stay updated on further developments or reports in the Feminine Intimate Wash?
To stay informed about further developments, trends, and reports in the Feminine Intimate Wash, consider subscribing to industry newsletters, following relevant companies and organizations, or regularly checking reputable industry news sources and publications.
Methodology
Step 1 - Identification of Relevant Samples Size from Population Database


Step 2 - Approaches for Defining Global Market Size (Value, Volume* & Price*)

Note*: In applicable scenarios
Step 3 - Data Sources
Primary Research
- Web Analytics
- Survey Reports
- Research Institute
- Latest Research Reports
- Opinion Leaders
Secondary Research
- Annual Reports
- White Paper
- Latest Press Release
- Industry Association
- Paid Database
- Investor Presentations

Step 4 - Data Triangulation
Involves using different sources of information in order to increase the validity of a study
These sources are likely to be stakeholders in a program - participants, other researchers, program staff, other community members, and so on.
Then we put all data in single framework & apply various statistical tools to find out the dynamic on the market.
During the analysis stage, feedback from the stakeholder groups would be compared to determine areas of agreement as well as areas of divergence


