

Key Insights
The European biochar market is experiencing significant expansion, propelled by increasing environmental consciousness and the demand for sustainable soil enhancement solutions. The market's projected Compound Annual Growth Rate (CAGR) of 15% from 2025 to 2033 underscores robust growth, driven by carbon sequestration efforts for climate change mitigation, the adoption of eco-friendly agriculture, and the proven benefits of biochar in improving soil fertility and water retention. Government support for sustainable agriculture and renewable energy further stimulates market development. While production costs and standardization challenges persist, the market outlook remains highly positive. Leading innovators such as Bussme Energy AB, Circular Carbon GmbH, and Carbofex Ltd are actively shaping market dynamics.
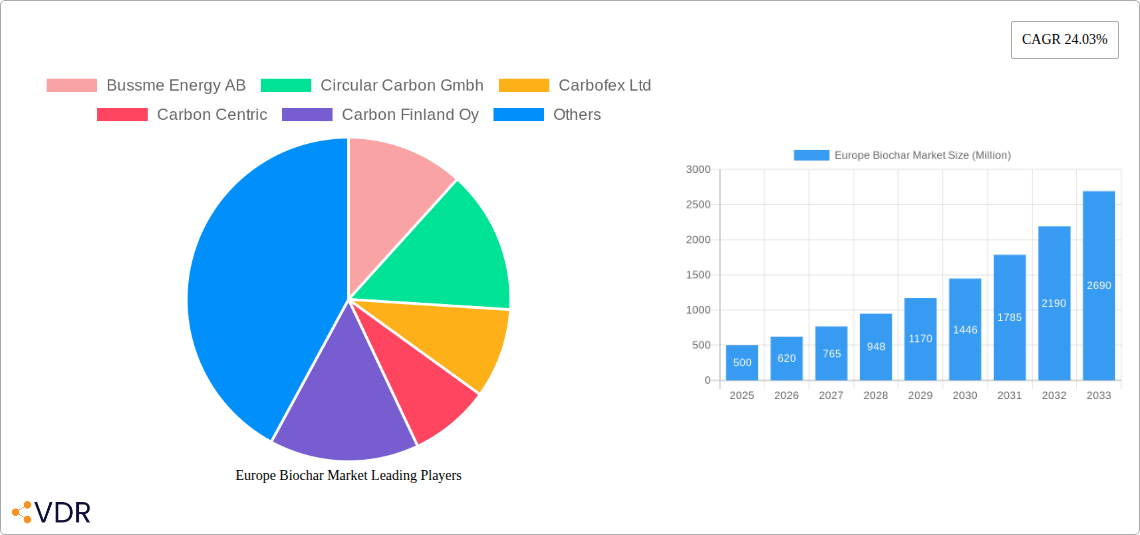
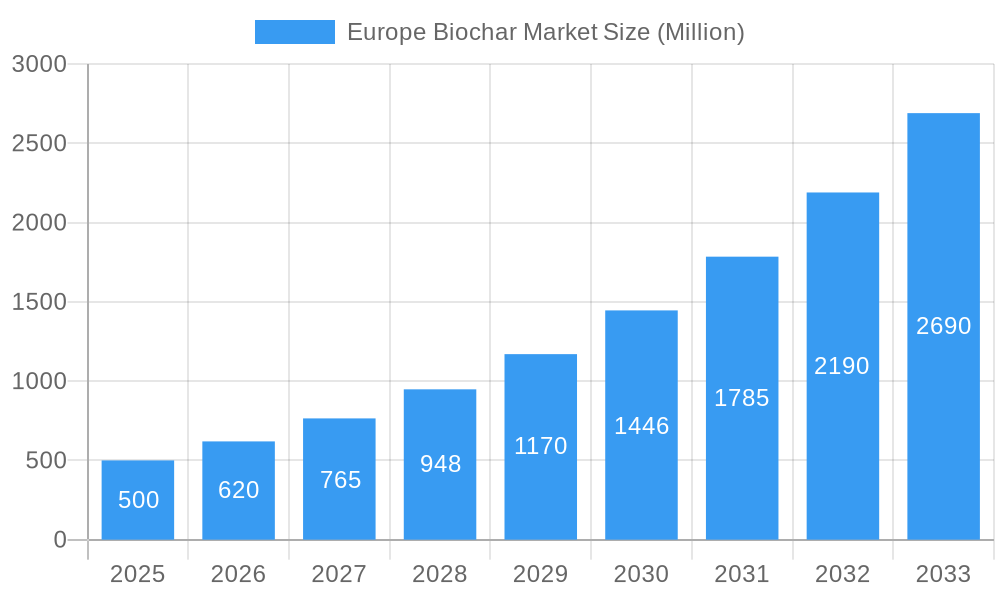
Europe Biochar Market Market Size (In Million)
Market growth is segmented across key applications: agriculture (soil amendment, crop yield enhancement), environmental remediation (contaminant removal, water purification), and energy production (biofuel feedstock). Adoption rates vary regionally, with countries emphasizing agriculture and environmental policies demonstrating higher penetration. The competitive arena is active, featuring established companies and emerging startups. Future expansion will be contingent on technological advancements to reduce biochar production costs and enhance efficiency. Amplified research into biochar applications and increased public awareness will be critical growth catalysts within the European biochar sector.
Europe Biochar Market Company Market Share
This comprehensive report offers an in-depth analysis of the Europe Biochar Market, detailing market dynamics, growth trajectories, key participants, and future projections. The analysis covers the period from 2025 to 2033, with 2025 designated as the base year. The estimated market size for 2025 is 0.62 billion. This study is an indispensable resource for industry professionals, investors, and strategic planners seeking to understand and leverage opportunities in this expanding market. The report examines the broader bioenergy market and specifically focuses on the biochar segment within Europe.
Europe Biochar Market Dynamics & Structure
The Europe biochar market is characterized by a moderately fragmented landscape, with numerous players vying for market share. Market concentration is expected to increase slightly over the forecast period due to consolidation and M&A activity. Technological innovation is a key driver, with companies constantly striving to improve production efficiency, quality, and application-specific properties of biochar. Stringent environmental regulations across Europe are also pushing adoption, alongside growing awareness of climate change. Competitive substitutes include other soil amendments and carbon sequestration methods. End-users are diverse, encompassing agriculture, environmental remediation, and industrial applications.
- Market Concentration: Moderately fragmented (2025 Market Share: Leader - xx%, Top 5 - xx%, others - xx%).
- Technological Innovation: Focus on improving production efficiency, quality, and application versatility (e.g., enhanced adsorption capabilities). Innovation barriers include high capital investment costs for advanced production technologies.
- Regulatory Framework: Stringent environmental regulations across EU member states drive demand for sustainable soil amendments and carbon-negative solutions.
- Competitive Substitutes: Other soil amendments (e.g., compost, peat) and carbon sequestration technologies (e.g., carbon capture and storage).
- End-User Demographics: Diverse, including agriculture (largest segment - xx%), environmental remediation (xx%), and industrial applications (xx%).
- M&A Trends: Moderate activity observed in recent years, with several smaller acquisitions aiming to expand production capacity and market reach (estimated xx M&A deals between 2019-2024).
Europe Biochar Market Growth Trends & Insights
The European biochar market has experienced robust growth in recent years (Historical CAGR xx% from 2019-2024), driven by increasing awareness of the environmental benefits and expanding applications across various sectors. The market size is estimated at €xx million in 2025 and is projected to reach €xx million by 2033, exhibiting a projected CAGR of xx% during the forecast period (2025-2033). This growth is fueled by rising demand for sustainable agriculture practices, government incentives for carbon sequestration, and technological advancements in biochar production. The adoption rate is increasing steadily, primarily in agriculture and environmental remediation sectors. Technological disruptions, such as advanced pyrolysis techniques and customized biochar formulations, are expected to further accelerate market expansion. Consumer behavior is shifting towards eco-friendly solutions, particularly among environmentally conscious farmers and businesses. Market penetration varies significantly across different segments and regions, with agriculture exhibiting highest penetration.
Dominant Regions, Countries, or Segments in Europe Biochar Market
Germany currently holds the largest market share in the Europe biochar market (xx% in 2025), followed by France (xx%) and the UK (xx%). This dominance stems from a combination of factors, including strong government support for renewable energy and sustainable agriculture, a well-established agricultural sector, and the presence of several key industry players.
- Germany: Strong government support for renewable energy and sustainable agriculture. High concentration of biochar producers and advanced production facilities. Significant investments in research and development.
- France: Large agricultural sector with high demand for soil amendments. Growing awareness of climate change and environmental sustainability.
- UK: Increasing adoption of sustainable agricultural practices. Government initiatives promoting carbon sequestration and renewable energy.
- Other Key Countries: Growing adoption in other regions like Scandinavia, driven by increased focus on sustainable forestry and environmental protection.
Europe Biochar Market Product Landscape
Biochar products are increasingly differentiated based on their feedstock (wood, agricultural residues), production method (slow pyrolysis, fast pyrolysis), and intended application (soil amendment, water filtration). Recent innovations focus on enhancing biochar properties for specific applications such as improved nutrient retention, water holding capacity, and pollutant adsorption. Unique selling propositions include tailored biochar formulations for different soil types and improved cost-effectiveness through optimized production processes.
Key Drivers, Barriers & Challenges in Europe Biochar Market
Key Drivers:
- Growing demand for sustainable agriculture and soil health improvement.
- Increasing concerns about climate change and the need for carbon sequestration solutions.
- Government incentives and supportive policies for renewable energy and sustainable development.
- Technological advancements improving biochar production efficiency and quality.
Key Challenges & Restraints:
- High initial investment costs for biochar production plants, especially for advanced pyrolysis technologies.
- Variability in biochar quality depending on feedstock and production methods.
- Potential supply chain constraints related to feedstock availability and logistics.
- Lack of standardized quality control measures and certification schemes. This results in uncertain pricing for the product. (Estimated impact: xx% reduction in market growth).
Emerging Opportunities in Europe Biochar Market
- Expansion into untapped markets such as environmental remediation and industrial applications.
- Development of innovative biochar applications (e.g., construction materials, water purification).
- Increasing consumer demand for sustainable and environmentally friendly products.
- Collaboration between research institutions, industry players, and policymakers to promote biochar adoption.
Growth Accelerators in the Europe Biochar Market Industry
Technological breakthroughs in pyrolysis techniques are set to significantly enhance production efficiency and reduce costs, thereby boosting market growth. Strategic partnerships between biochar producers, agricultural companies, and environmental agencies will accelerate market expansion and widespread adoption of biochar solutions. Targeted marketing and awareness campaigns will educate consumers and businesses about the benefits of biochar. Expanding into new geographical markets with a high potential for biochar adoption will further fuel market growth.
Key Players Shaping the Europe Biochar Market Market
- Bussme Energy AB
- Circular Carbon GmbH
- Carbofex Ltd
- Carbon Centric
- Carbon Finland Oy
- Carbon Gold Ltd
- Carbuna
- Charline GmbH
- Egos GmbH
- Eoc Energy Ocean
- Lucrat GmbH
- Nettenergy BV
- Novocarbo GmbH
- Sonnenerde GmbH
- Verora AG
- List Not Exhaustive
Notable Milestones in Europe Biochar Market Sector
- October 2022: Sonnenerde announced the construction of its first industrial biochar production plant in Europe, strengthening its product portfolio.
- November 2022: Novocarbo GmbH and ThyssenKrupp launched a new decarbonization plant producing regenerative heat and biochar, expanding market presence.
- November 2023: Novocarbo opened Germany's largest carbon removal park, showcasing innovative collaboration and climate-friendly goals.
- March 2024: Novocarbo raised EUR 25 million (USD 27 million) to construct 200 carbon removal parks across Europe by 2033, expanding CCS and green heat networks.
In-Depth Europe Biochar Market Market Outlook
The Europe biochar market is poised for significant growth over the next decade. Continued technological advancements, supportive government policies, and increasing environmental awareness will drive demand. Strategic partnerships, market expansion into new applications, and improved supply chain efficiency will be crucial factors in shaping the market's future trajectory. The market presents attractive opportunities for investors and businesses seeking to capitalize on the growing demand for sustainable and environmentally friendly solutions.
Europe Biochar Market Segmentation
-
1. Technology
- 1.1. Pyrolysis
- 1.2. Gasification Systems
- 1.3. Other Technologies
-
2. Application
- 2.1. Agriculture
- 2.2. Animal Farming
- 2.3. Industrial Uses
- 2.4. Other Applications
Europe Biochar Market Segmentation By Geography
- 1. Germany
- 2. United Kingdom
- 3. France
- 4. Italy
- 5. Spain
- 6. Nordic
- 7. Turkey
- 8. Russia
- 9. Rest of Europe
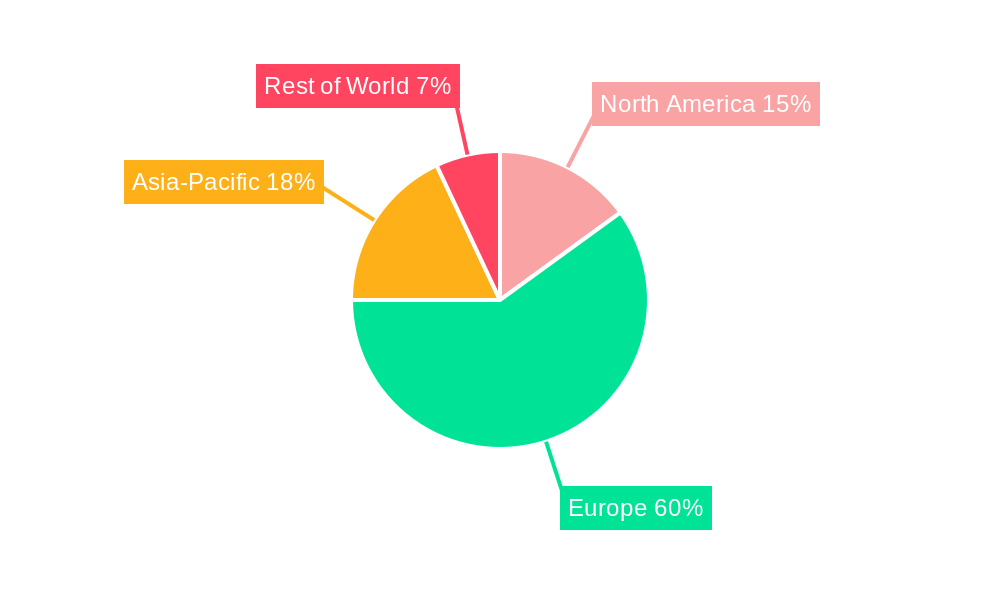
Europe Biochar Market Regional Market Share
Geographic Coverage of Europe Biochar Market
Europe Biochar Market REPORT HIGHLIGHTS
| Aspects | Details |
|---|---|
| Study Period | 2020-2034 |
| Base Year | 2025 |
| Estimated Year | 2026 |
| Forecast Period | 2026-2034 |
| Historical Period | 2020-2025 |
| Growth Rate | CAGR of 15% from 2020-2034 |
| Segmentation |
|
Table of Contents
- 1. Introduction
- 1.1. Research Scope
- 1.2. Market Segmentation
- 1.3. Research Objective
- 1.4. Definitions and Assumptions
- 2. Executive Summary
- 2.1. Market Snapshot
- 3. Market Dynamics
- 3.1. Market Drivers
- 3.2. Market Restrains
- 3.3. Market Trends
- 3.4. Market Opportunities
- 4. Market Factor Analysis
- 4.1. Porters Five Forces
- 4.1.1. Bargaining Power of Suppliers
- 4.1.2. Bargaining Power of Buyers
- 4.1.3. Threat of New Entrants
- 4.1.4. Threat of Substitutes
- 4.1.5. Competitive Rivalry
- 4.2. PESTEL analysis
- 4.3. BCG Analysis
- 4.3.1. Stars (High Growth, High Market Share)
- 4.3.2. Cash Cows (Low Growth, High Market Share)
- 4.3.3. Question Mark (High Growth, Low Market Share)
- 4.3.4. Dogs (Low Growth, Low Market Share)
- 4.4. Ansoff Matrix Analysis
- 4.5. Supply Chain Analysis
- 4.6. Regulatory Landscape
- 4.7. Current Market Potential and Opportunity Assessment (TAM–SAM–SOM Framework)
- 4.8. VDR Analyst Note
- 4.1. Porters Five Forces
- 5. Market Analysis, Insights and Forecast 2021-2033
- 5.1. Market Analysis, Insights and Forecast - by Technology
- 5.1.1. Pyrolysis
- 5.1.2. Gasification Systems
- 5.1.3. Other Technologies
- 5.2. Market Analysis, Insights and Forecast - by Application
- 5.2.1. Agriculture
- 5.2.2. Animal Farming
- 5.2.3. Industrial Uses
- 5.2.4. Other Applications
- 5.3. Market Analysis, Insights and Forecast - by Region
- 5.3.1. Germany
- 5.3.2. United Kingdom
- 5.3.3. France
- 5.3.4. Italy
- 5.3.5. Spain
- 5.3.6. Nordic
- 5.3.7. Turkey
- 5.3.8. Russia
- 5.3.9. Rest of Europe
- 5.1. Market Analysis, Insights and Forecast - by Technology
- 6. Global Europe Biochar Market Analysis, Insights and Forecast, 2021-2033
- 6.1. Market Analysis, Insights and Forecast - by Technology
- 6.1.1. Pyrolysis
- 6.1.2. Gasification Systems
- 6.1.3. Other Technologies
- 6.2. Market Analysis, Insights and Forecast - by Application
- 6.2.1. Agriculture
- 6.2.2. Animal Farming
- 6.2.3. Industrial Uses
- 6.2.4. Other Applications
- 6.1. Market Analysis, Insights and Forecast - by Technology
- 7. Germany Europe Biochar Market Analysis, Insights and Forecast, 2021-2033
- 7.1. Market Analysis, Insights and Forecast - by Technology
- 7.1.1. Pyrolysis
- 7.1.2. Gasification Systems
- 7.1.3. Other Technologies
- 7.2. Market Analysis, Insights and Forecast - by Application
- 7.2.1. Agriculture
- 7.2.2. Animal Farming
- 7.2.3. Industrial Uses
- 7.2.4. Other Applications
- 7.1. Market Analysis, Insights and Forecast - by Technology
- 8. United Kingdom Europe Biochar Market Analysis, Insights and Forecast, 2021-2033
- 8.1. Market Analysis, Insights and Forecast - by Technology
- 8.1.1. Pyrolysis
- 8.1.2. Gasification Systems
- 8.1.3. Other Technologies
- 8.2. Market Analysis, Insights and Forecast - by Application
- 8.2.1. Agriculture
- 8.2.2. Animal Farming
- 8.2.3. Industrial Uses
- 8.2.4. Other Applications
- 8.1. Market Analysis, Insights and Forecast - by Technology
- 9. France Europe Biochar Market Analysis, Insights and Forecast, 2021-2033
- 9.1. Market Analysis, Insights and Forecast - by Technology
- 9.1.1. Pyrolysis
- 9.1.2. Gasification Systems
- 9.1.3. Other Technologies
- 9.2. Market Analysis, Insights and Forecast - by Application
- 9.2.1. Agriculture
- 9.2.2. Animal Farming
- 9.2.3. Industrial Uses
- 9.2.4. Other Applications
- 9.1. Market Analysis, Insights and Forecast - by Technology
- 10. Italy Europe Biochar Market Analysis, Insights and Forecast, 2021-2033
- 10.1. Market Analysis, Insights and Forecast - by Technology
- 10.1.1. Pyrolysis
- 10.1.2. Gasification Systems
- 10.1.3. Other Technologies
- 10.2. Market Analysis, Insights and Forecast - by Application
- 10.2.1. Agriculture
- 10.2.2. Animal Farming
- 10.2.3. Industrial Uses
- 10.2.4. Other Applications
- 10.1. Market Analysis, Insights and Forecast - by Technology
- 11. Spain Europe Biochar Market Analysis, Insights and Forecast, 2021-2033
- 11.1. Market Analysis, Insights and Forecast - by Technology
- 11.1.1. Pyrolysis
- 11.1.2. Gasification Systems
- 11.1.3. Other Technologies
- 11.2. Market Analysis, Insights and Forecast - by Application
- 11.2.1. Agriculture
- 11.2.2. Animal Farming
- 11.2.3. Industrial Uses
- 11.2.4. Other Applications
- 11.1. Market Analysis, Insights and Forecast - by Technology
- 12. Nordic Europe Biochar Market Analysis, Insights and Forecast, 2021-2033
- 12.1. Market Analysis, Insights and Forecast - by Technology
- 12.1.1. Pyrolysis
- 12.1.2. Gasification Systems
- 12.1.3. Other Technologies
- 12.2. Market Analysis, Insights and Forecast - by Application
- 12.2.1. Agriculture
- 12.2.2. Animal Farming
- 12.2.3. Industrial Uses
- 12.2.4. Other Applications
- 12.1. Market Analysis, Insights and Forecast - by Technology
- 13. Turkey Europe Biochar Market Analysis, Insights and Forecast, 2021-2033
- 13.1. Market Analysis, Insights and Forecast - by Technology
- 13.1.1. Pyrolysis
- 13.1.2. Gasification Systems
- 13.1.3. Other Technologies
- 13.2. Market Analysis, Insights and Forecast - by Application
- 13.2.1. Agriculture
- 13.2.2. Animal Farming
- 13.2.3. Industrial Uses
- 13.2.4. Other Applications
- 13.1. Market Analysis, Insights and Forecast - by Technology
- 14. Russia Europe Biochar Market Analysis, Insights and Forecast, 2021-2033
- 14.1. Market Analysis, Insights and Forecast - by Technology
- 14.1.1. Pyrolysis
- 14.1.2. Gasification Systems
- 14.1.3. Other Technologies
- 14.2. Market Analysis, Insights and Forecast - by Application
- 14.2.1. Agriculture
- 14.2.2. Animal Farming
- 14.2.3. Industrial Uses
- 14.2.4. Other Applications
- 14.1. Market Analysis, Insights and Forecast - by Technology
- 15. Rest of Europe Europe Biochar Market Analysis, Insights and Forecast, 2021-2033
- 15.1. Market Analysis, Insights and Forecast - by Technology
- 15.1.1. Pyrolysis
- 15.1.2. Gasification Systems
- 15.1.3. Other Technologies
- 15.2. Market Analysis, Insights and Forecast - by Application
- 15.2.1. Agriculture
- 15.2.2. Animal Farming
- 15.2.3. Industrial Uses
- 15.2.4. Other Applications
- 15.1. Market Analysis, Insights and Forecast - by Technology
- 16. Competitive Analysis
- 16.1. Company Profiles
- 16.1.1 Bussme Energy AB
- 16.1.1.1. Company Overview
- 16.1.1.2. Products
- 16.1.1.3. Company Financials
- 16.1.1.4. SWOT Analysis
- 16.1.2 Circular Carbon Gmbh
- 16.1.2.1. Company Overview
- 16.1.2.2. Products
- 16.1.2.3. Company Financials
- 16.1.2.4. SWOT Analysis
- 16.1.3 Carbofex Ltd
- 16.1.3.1. Company Overview
- 16.1.3.2. Products
- 16.1.3.3. Company Financials
- 16.1.3.4. SWOT Analysis
- 16.1.4 Carbon Centric
- 16.1.4.1. Company Overview
- 16.1.4.2. Products
- 16.1.4.3. Company Financials
- 16.1.4.4. SWOT Analysis
- 16.1.5 Carbon Finland Oy
- 16.1.5.1. Company Overview
- 16.1.5.2. Products
- 16.1.5.3. Company Financials
- 16.1.5.4. SWOT Analysis
- 16.1.6 Carbon Gold Ltd
- 16.1.6.1. Company Overview
- 16.1.6.2. Products
- 16.1.6.3. Company Financials
- 16.1.6.4. SWOT Analysis
- 16.1.7 Carbuna
- 16.1.7.1. Company Overview
- 16.1.7.2. Products
- 16.1.7.3. Company Financials
- 16.1.7.4. SWOT Analysis
- 16.1.8 Charline Gmbh
- 16.1.8.1. Company Overview
- 16.1.8.2. Products
- 16.1.8.3. Company Financials
- 16.1.8.4. SWOT Analysis
- 16.1.9 Egos Gmbh
- 16.1.9.1. Company Overview
- 16.1.9.2. Products
- 16.1.9.3. Company Financials
- 16.1.9.4. SWOT Analysis
- 16.1.10 Eoc Energy Ocean
- 16.1.10.1. Company Overview
- 16.1.10.2. Products
- 16.1.10.3. Company Financials
- 16.1.10.4. SWOT Analysis
- 16.1.11 Lucrat Gmbh
- 16.1.11.1. Company Overview
- 16.1.11.2. Products
- 16.1.11.3. Company Financials
- 16.1.11.4. SWOT Analysis
- 16.1.12 Nettenergy BV
- 16.1.12.1. Company Overview
- 16.1.12.2. Products
- 16.1.12.3. Company Financials
- 16.1.12.4. SWOT Analysis
- 16.1.13 Novocarbo Gmbh
- 16.1.13.1. Company Overview
- 16.1.13.2. Products
- 16.1.13.3. Company Financials
- 16.1.13.4. SWOT Analysis
- 16.1.14 Sonnenerde Gmbh
- 16.1.14.1. Company Overview
- 16.1.14.2. Products
- 16.1.14.3. Company Financials
- 16.1.14.4. SWOT Analysis
- 16.1.15 Verora AG*List Not Exhaustive
- 16.1.15.1. Company Overview
- 16.1.15.2. Products
- 16.1.15.3. Company Financials
- 16.1.15.4. SWOT Analysis
- 16.1.1 Bussme Energy AB
- 16.2. Market Entropy
- 16.2.1 Company's Key Areas Served
- 16.2.2 Recent Developments
- 16.3. Company Market Share Analysis 2025
- 16.3.1 Top 5 Companies Market Share Analysis
- 16.3.2 Top 3 Companies Market Share Analysis
- 16.4. List of Potential Customers
- 17. Research Methodology
List of Figures
- Figure 1: Global Europe Biochar Market Revenue Breakdown (billion, %) by Region 2025 & 2033
- Figure 2: Germany Europe Biochar Market Revenue (billion), by Technology 2025 & 2033
- Figure 3: Germany Europe Biochar Market Revenue Share (%), by Technology 2025 & 2033
- Figure 4: Germany Europe Biochar Market Revenue (billion), by Application 2025 & 2033
- Figure 5: Germany Europe Biochar Market Revenue Share (%), by Application 2025 & 2033
- Figure 6: Germany Europe Biochar Market Revenue (billion), by Country 2025 & 2033
- Figure 7: Germany Europe Biochar Market Revenue Share (%), by Country 2025 & 2033
- Figure 8: United Kingdom Europe Biochar Market Revenue (billion), by Technology 2025 & 2033
- Figure 9: United Kingdom Europe Biochar Market Revenue Share (%), by Technology 2025 & 2033
- Figure 10: United Kingdom Europe Biochar Market Revenue (billion), by Application 2025 & 2033
- Figure 11: United Kingdom Europe Biochar Market Revenue Share (%), by Application 2025 & 2033
- Figure 12: United Kingdom Europe Biochar Market Revenue (billion), by Country 2025 & 2033
- Figure 13: United Kingdom Europe Biochar Market Revenue Share (%), by Country 2025 & 2033
- Figure 14: France Europe Biochar Market Revenue (billion), by Technology 2025 & 2033
- Figure 15: France Europe Biochar Market Revenue Share (%), by Technology 2025 & 2033
- Figure 16: France Europe Biochar Market Revenue (billion), by Application 2025 & 2033
- Figure 17: France Europe Biochar Market Revenue Share (%), by Application 2025 & 2033
- Figure 18: France Europe Biochar Market Revenue (billion), by Country 2025 & 2033
- Figure 19: France Europe Biochar Market Revenue Share (%), by Country 2025 & 2033
- Figure 20: Italy Europe Biochar Market Revenue (billion), by Technology 2025 & 2033
- Figure 21: Italy Europe Biochar Market Revenue Share (%), by Technology 2025 & 2033
- Figure 22: Italy Europe Biochar Market Revenue (billion), by Application 2025 & 2033
- Figure 23: Italy Europe Biochar Market Revenue Share (%), by Application 2025 & 2033
- Figure 24: Italy Europe Biochar Market Revenue (billion), by Country 2025 & 2033
- Figure 25: Italy Europe Biochar Market Revenue Share (%), by Country 2025 & 2033
- Figure 26: Spain Europe Biochar Market Revenue (billion), by Technology 2025 & 2033
- Figure 27: Spain Europe Biochar Market Revenue Share (%), by Technology 2025 & 2033
- Figure 28: Spain Europe Biochar Market Revenue (billion), by Application 2025 & 2033
- Figure 29: Spain Europe Biochar Market Revenue Share (%), by Application 2025 & 2033
- Figure 30: Spain Europe Biochar Market Revenue (billion), by Country 2025 & 2033
- Figure 31: Spain Europe Biochar Market Revenue Share (%), by Country 2025 & 2033
- Figure 32: Nordic Europe Biochar Market Revenue (billion), by Technology 2025 & 2033
- Figure 33: Nordic Europe Biochar Market Revenue Share (%), by Technology 2025 & 2033
- Figure 34: Nordic Europe Biochar Market Revenue (billion), by Application 2025 & 2033
- Figure 35: Nordic Europe Biochar Market Revenue Share (%), by Application 2025 & 2033
- Figure 36: Nordic Europe Biochar Market Revenue (billion), by Country 2025 & 2033
- Figure 37: Nordic Europe Biochar Market Revenue Share (%), by Country 2025 & 2033
- Figure 38: Turkey Europe Biochar Market Revenue (billion), by Technology 2025 & 2033
- Figure 39: Turkey Europe Biochar Market Revenue Share (%), by Technology 2025 & 2033
- Figure 40: Turkey Europe Biochar Market Revenue (billion), by Application 2025 & 2033
- Figure 41: Turkey Europe Biochar Market Revenue Share (%), by Application 2025 & 2033
- Figure 42: Turkey Europe Biochar Market Revenue (billion), by Country 2025 & 2033
- Figure 43: Turkey Europe Biochar Market Revenue Share (%), by Country 2025 & 2033
- Figure 44: Russia Europe Biochar Market Revenue (billion), by Technology 2025 & 2033
- Figure 45: Russia Europe Biochar Market Revenue Share (%), by Technology 2025 & 2033
- Figure 46: Russia Europe Biochar Market Revenue (billion), by Application 2025 & 2033
- Figure 47: Russia Europe Biochar Market Revenue Share (%), by Application 2025 & 2033
- Figure 48: Russia Europe Biochar Market Revenue (billion), by Country 2025 & 2033
- Figure 49: Russia Europe Biochar Market Revenue Share (%), by Country 2025 & 2033
- Figure 50: Rest of Europe Europe Biochar Market Revenue (billion), by Technology 2025 & 2033
- Figure 51: Rest of Europe Europe Biochar Market Revenue Share (%), by Technology 2025 & 2033
- Figure 52: Rest of Europe Europe Biochar Market Revenue (billion), by Application 2025 & 2033
- Figure 53: Rest of Europe Europe Biochar Market Revenue Share (%), by Application 2025 & 2033
- Figure 54: Rest of Europe Europe Biochar Market Revenue (billion), by Country 2025 & 2033
- Figure 55: Rest of Europe Europe Biochar Market Revenue Share (%), by Country 2025 & 2033
List of Tables
- Table 1: Global Europe Biochar Market Revenue billion Forecast, by Technology 2020 & 2033
- Table 2: Global Europe Biochar Market Revenue billion Forecast, by Application 2020 & 2033
- Table 3: Global Europe Biochar Market Revenue billion Forecast, by Region 2020 & 2033
- Table 4: Global Europe Biochar Market Revenue billion Forecast, by Technology 2020 & 2033
- Table 5: Global Europe Biochar Market Revenue billion Forecast, by Application 2020 & 2033
- Table 6: Global Europe Biochar Market Revenue billion Forecast, by Country 2020 & 2033
- Table 7: Global Europe Biochar Market Revenue billion Forecast, by Technology 2020 & 2033
- Table 8: Global Europe Biochar Market Revenue billion Forecast, by Application 2020 & 2033
- Table 9: Global Europe Biochar Market Revenue billion Forecast, by Country 2020 & 2033
- Table 10: Global Europe Biochar Market Revenue billion Forecast, by Technology 2020 & 2033
- Table 11: Global Europe Biochar Market Revenue billion Forecast, by Application 2020 & 2033
- Table 12: Global Europe Biochar Market Revenue billion Forecast, by Country 2020 & 2033
- Table 13: Global Europe Biochar Market Revenue billion Forecast, by Technology 2020 & 2033
- Table 14: Global Europe Biochar Market Revenue billion Forecast, by Application 2020 & 2033
- Table 15: Global Europe Biochar Market Revenue billion Forecast, by Country 2020 & 2033
- Table 16: Global Europe Biochar Market Revenue billion Forecast, by Technology 2020 & 2033
- Table 17: Global Europe Biochar Market Revenue billion Forecast, by Application 2020 & 2033
- Table 18: Global Europe Biochar Market Revenue billion Forecast, by Country 2020 & 2033
- Table 19: Global Europe Biochar Market Revenue billion Forecast, by Technology 2020 & 2033
- Table 20: Global Europe Biochar Market Revenue billion Forecast, by Application 2020 & 2033
- Table 21: Global Europe Biochar Market Revenue billion Forecast, by Country 2020 & 2033
- Table 22: Global Europe Biochar Market Revenue billion Forecast, by Technology 2020 & 2033
- Table 23: Global Europe Biochar Market Revenue billion Forecast, by Application 2020 & 2033
- Table 24: Global Europe Biochar Market Revenue billion Forecast, by Country 2020 & 2033
- Table 25: Global Europe Biochar Market Revenue billion Forecast, by Technology 2020 & 2033
- Table 26: Global Europe Biochar Market Revenue billion Forecast, by Application 2020 & 2033
- Table 27: Global Europe Biochar Market Revenue billion Forecast, by Country 2020 & 2033
- Table 28: Global Europe Biochar Market Revenue billion Forecast, by Technology 2020 & 2033
- Table 29: Global Europe Biochar Market Revenue billion Forecast, by Application 2020 & 2033
- Table 30: Global Europe Biochar Market Revenue billion Forecast, by Country 2020 & 2033
Frequently Asked Questions
1. What is the projected Compound Annual Growth Rate (CAGR) of the Europe Biochar Market?
The projected CAGR is approximately 15%.
2. Which companies are prominent players in the Europe Biochar Market?
Key companies in the market include Bussme Energy AB, Circular Carbon Gmbh, Carbofex Ltd, Carbon Centric, Carbon Finland Oy, Carbon Gold Ltd, Carbuna, Charline Gmbh, Egos Gmbh, Eoc Energy Ocean, Lucrat Gmbh, Nettenergy BV, Novocarbo Gmbh, Sonnenerde Gmbh, Verora AG*List Not Exhaustive.
3. What are the main segments of the Europe Biochar Market?
The market segments include Technology, Application.
4. Can you provide details about the market size?
The market size is estimated to be USD 0.62 billion as of 2022.
5. What are some drivers contributing to market growth?
Increasing Demand for Organic Farming in the Agricultural Industry; Increasing Focus on the Waste Management Sector; Others.
6. What are the notable trends driving market growth?
Increasing Demand from the Agricultural Industry.
7. Are there any restraints impacting market growth?
Increasing Demand for Organic Farming in the Agricultural Industry; Increasing Focus on the Waste Management Sector; Others.
8. Can you provide examples of recent developments in the market?
March 2024: Novocarbo raised EUR 25 million (USD 27 million) to construct 200 carbon removal parks in Europe by 2033. The company aims to expand the network for carbon capture and sequestration (CCS) and green heat across Europe.
9. What pricing options are available for accessing the report?
Pricing options include single-user, multi-user, and enterprise licenses priced at USD 4750, USD 5250, and USD 8750 respectively.
10. Is the market size provided in terms of value or volume?
The market size is provided in terms of value, measured in billion.
11. Are there any specific market keywords associated with the report?
Yes, the market keyword associated with the report is "Europe Biochar Market," which aids in identifying and referencing the specific market segment covered.
12. How do I determine which pricing option suits my needs best?
The pricing options vary based on user requirements and access needs. Individual users may opt for single-user licenses, while businesses requiring broader access may choose multi-user or enterprise licenses for cost-effective access to the report.
13. Are there any additional resources or data provided in the Europe Biochar Market report?
While the report offers comprehensive insights, it's advisable to review the specific contents or supplementary materials provided to ascertain if additional resources or data are available.
14. How can I stay updated on further developments or reports in the Europe Biochar Market?
To stay informed about further developments, trends, and reports in the Europe Biochar Market, consider subscribing to industry newsletters, following relevant companies and organizations, or regularly checking reputable industry news sources and publications.
Methodology
Step 1 - Identification of Relevant Samples Size from Population Database


Step 2 - Approaches for Defining Global Market Size (Value, Volume* & Price*)

Note*: In applicable scenarios
Step 3 - Data Sources
Primary Research
- Web Analytics
- Survey Reports
- Research Institute
- Latest Research Reports
- Opinion Leaders
Secondary Research
- Annual Reports
- White Paper
- Latest Press Release
- Industry Association
- Paid Database
- Investor Presentations

Step 4 - Data Triangulation
Involves using different sources of information in order to increase the validity of a study
These sources are likely to be stakeholders in a program - participants, other researchers, program staff, other community members, and so on.
Then we put all data in single framework & apply various statistical tools to find out the dynamic on the market.
During the analysis stage, feedback from the stakeholder groups would be compared to determine areas of agreement as well as areas of divergence