

Key Insights
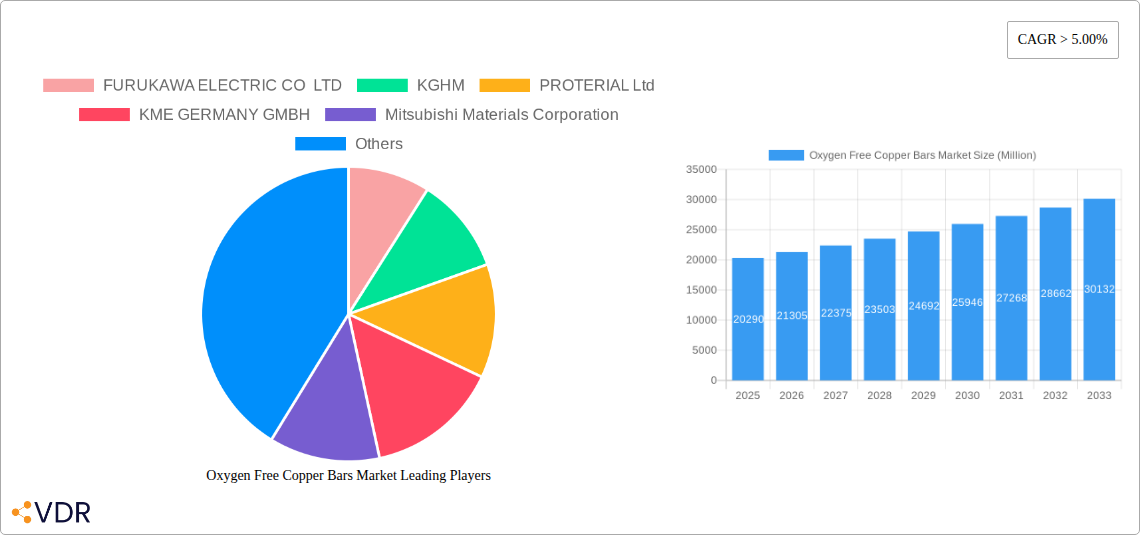
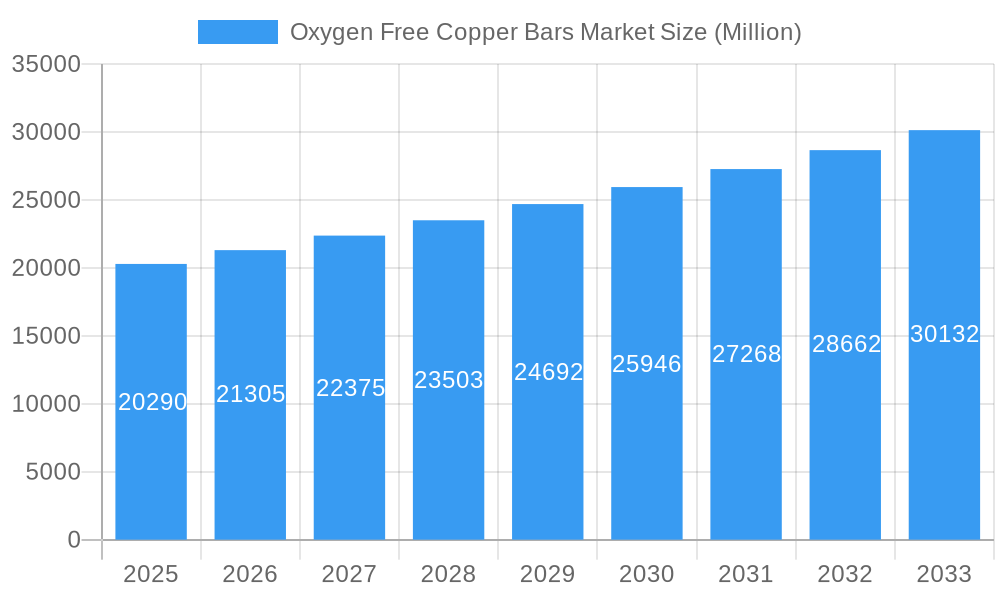
The Oxygen-Free Copper (OFC) bars market, valued at $20.29 billion in 2025, is projected to experience robust growth with a Compound Annual Growth Rate (CAGR) exceeding 5% from 2025 to 2033. This expansion is driven by the increasing demand for high-purity copper in various applications, particularly within the burgeoning electrical and electronics sectors. The rising adoption of electric vehicles (EVs) and renewable energy technologies, such as solar panels and wind turbines, significantly fuels this demand. Furthermore, the growth of data centers and the expansion of 5G networks are creating substantial opportunities for OFC bars due to their superior electrical conductivity and low resistance. Stringent quality requirements in these applications drive the preference for OFC bars over other copper alternatives. While potential supply chain disruptions and fluctuating copper prices could act as restraints, the overall market outlook remains positive, fueled by technological advancements and sustained growth in key end-user industries.
Oxygen Free Copper Bars Market Market Size (In Billion)
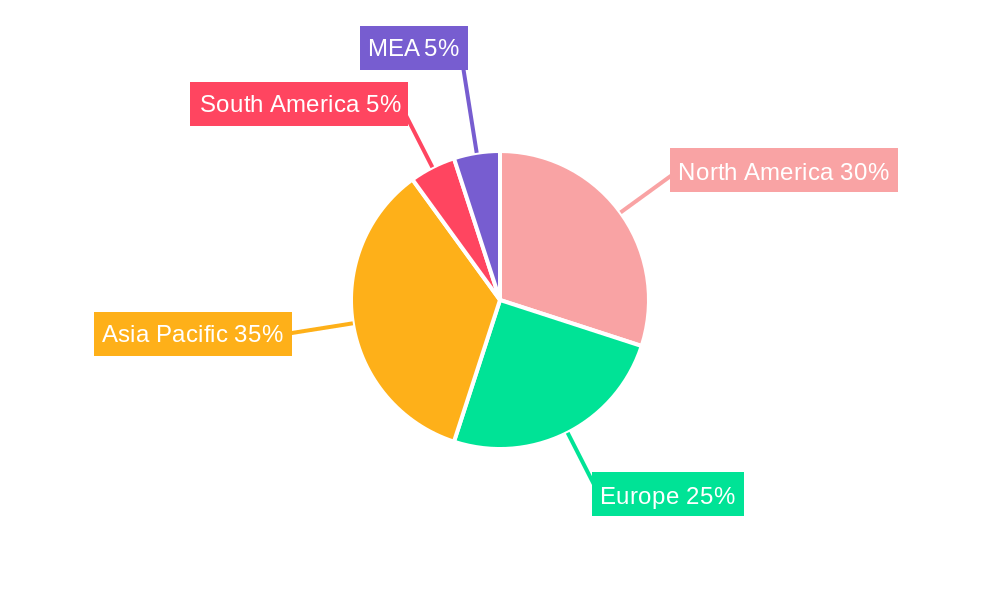
The market segmentation reveals a diverse landscape. Grades like CU-OF and CU-OFE cater to specific application needs, with wires and strips dominating the product segment. Electrical and electronics remain the largest end-user industry, but the automotive sector is expected to show significant growth, driven by the aforementioned EV revolution. Geographically, North America and Asia-Pacific are anticipated to be key market drivers, with China and the United States representing significant consumption hubs. Competitive dynamics are shaped by a mix of established players like Furukawa Electric, KGHM, and Mitsubishi Materials, as well as regional players catering to specific market segments. Ongoing research and development focused on enhancing the properties of OFC bars, such as improving thermal conductivity and corrosion resistance, further contribute to the market's optimistic trajectory. The forecast period (2025-2033) presents compelling investment opportunities for businesses involved in the production, processing, and distribution of oxygen-free copper bars.
Oxygen Free Copper Bars Market Company Market Share
Oxygen-Free Copper Bars Market Report: 2019-2033
This comprehensive report provides a detailed analysis of the Oxygen-Free Copper Bars market, encompassing market dynamics, growth trends, regional insights, product landscape, and key player analysis. The report covers the period 2019-2033, with a focus on the forecast period 2025-2033 and base year 2025. The study delves into the parent market of Copper Products and the child market of Oxygen-Free Copper Bars, offering a granular understanding of this vital sector. The market is segmented by Grade (CU-OF, CU-OFE), Product (Wires, Strips, Busbars and Rods, Other Products), and End-user Industry (Electrical & Electronics, Automotive, Industrial, Other). The report's quantitative and qualitative insights provide invaluable intelligence for industry professionals, investors, and strategic decision-makers. The total market size is projected to reach xx Million units by 2033.
Oxygen Free Copper Bars Market Market Dynamics & Structure
The Oxygen-Free Copper Bars market is characterized by moderate concentration, with key players holding significant market share. Technological innovation, driven by the rising demand for higher conductivity materials in electric vehicles and renewable energy applications, is a major driver. Stringent regulatory frameworks regarding material purity and environmental standards influence market operations. Competitive product substitutes, such as aluminum and other conductive materials, pose a challenge, though OFC's superior conductivity often outweighs cost differences. The end-user demographics are diverse, spanning the electrical & electronics, automotive, and industrial sectors, with evolving demand patterns influencing market growth. Recent M&A activity, including the January 2023 acquisition of Lacroix + Kress GmbH by Superior Essex Inc., reflects the strategic importance of OFC in growing markets.
- Market Concentration: Moderately concentrated, with the top 5 players holding approximately xx% of market share in 2024.
- Technological Innovation: Focus on improving purity, enhancing conductivity, and developing specialized alloys for specific applications.
- Regulatory Framework: Compliance with environmental regulations and standards for material purity is crucial.
- Competitive Substitutes: Aluminum and other conductive materials compete based on cost and specific application requirements.
- End-User Demographics: Significant demand from the electrical and electronics, automotive, and industrial sectors.
- M&A Trends: A notable increase in M&A activity in recent years, driven by consolidation and expansion strategies (xx deals in the last 5 years).
Oxygen Free Copper Bars Market Growth Trends & Insights
The Oxygen-Free Copper Bars market exhibited a CAGR of xx% during the historical period (2019-2024). This growth is largely attributed to the increasing adoption of OFC in high-growth sectors such as electric vehicles, renewable energy infrastructure, and advanced electronics. Technological disruptions, including the development of more efficient manufacturing processes and improved material properties, have also contributed to market expansion. Consumer behavior shifts, particularly toward environmentally sustainable materials and energy-efficient technologies, are driving demand. The market is expected to maintain a steady growth trajectory, with a projected CAGR of xx% during the forecast period (2025-2033), reaching xx Million units by 2033. Market penetration is expected to increase significantly in developing economies.
Dominant Regions, Countries, or Segments in Oxygen Free Copper Bars Market
The market is geographically diverse, with significant contributions from various regions. However, [mention specific region, e.g., North America] currently holds the largest market share due to robust demand from the automotive and electronics industries, coupled with well-established infrastructure and technological advancements. [Mention specific country, e.g., China] is a rapidly growing market, driven by the expansion of its manufacturing sector and the government's focus on renewable energy.
- Key Drivers:
- Strong economic growth in key regions
- Government policies supporting the adoption of sustainable technologies
- Increasing demand from the automotive and electronics industries
- Growing investment in renewable energy infrastructure
The CU-OF grade currently holds a larger market share compared to CU-OFE due to its wider applicability and cost-effectiveness. Within product segments, wires and strips dominate, driven by their widespread use in various applications. The electrical and electronics industry remains the largest end-user segment, consuming a significant portion of OFC bars.
Oxygen Free Copper Bars Market Product Landscape
Oxygen-free copper bars are offered in various grades (CU-OF, CU-OFE) and forms (wires, strips, busbars, rods, tubes, and pipes). Product innovation centers around enhancing conductivity, improving material strength, and developing specialized alloys for niche applications. Unique selling propositions include superior electrical conductivity, high thermal conductivity, and excellent corrosion resistance. Technological advancements are focused on improving manufacturing processes, leading to higher purity levels and increased efficiency.
Key Drivers, Barriers & Challenges in Oxygen Free Copper Bars Market
Key Drivers: The rising demand for high-performance electrical conductors in the automotive (EVs), renewable energy (solar, wind), and electronics industries fuels market growth. Government incentives for green technologies and infrastructure development also contribute significantly.
Challenges: Fluctuations in copper prices, supply chain disruptions, and intense competition from substitute materials pose challenges. Stringent environmental regulations and the need for sustainable manufacturing practices add complexity. The market faces constraints from the price volatility of raw materials and geopolitical factors affecting supply.
Emerging Opportunities in Oxygen Free Copper Bars Market
Untapped markets in developing economies, coupled with the growing demand for high-purity copper in specialized applications (e.g., aerospace and medical), presents significant growth opportunities. The development of innovative applications in next-generation electronics and electric vehicle components further expands the market potential. Sustainable manufacturing practices and circular economy initiatives offer opportunities to cater to environmentally conscious consumers and regulations.
Growth Accelerators in the Oxygen Free Copper Bars Market Industry
Technological advancements in manufacturing processes, leading to higher purity and improved efficiency, are crucial growth accelerators. Strategic partnerships between manufacturers and end-users facilitate innovation and market expansion. Government initiatives promoting green technologies and sustainable infrastructure development further accelerate market growth. Focus on emerging applications in electric vehicles and renewable energy is a powerful driver.
Key Players Shaping the Oxygen Free Copper Bars Market Market
- FURUKAWA ELECTRIC CO LTD
- KGHM
- PROTERIAL Ltd
- KME GERMANY GMBH
- Mitsubishi Materials Corporation
- Metrod Holdings Berhad
- Sam Dong
- Farmers Copper LTD
- Lacroix + Kress GmbH
- Aviva Metals
- Cupori
- Citizen Metalloys Ltd
- Copper Braid Products
Notable Milestones in Oxygen Free Copper Bars Market Sector
- January 2023: Hitachi Metals Ltd. changed its name to Proterial Ltd. This rebranding reflects the company's strategic focus on advanced materials.
- January 2023: Superior Essex Inc.'s acquisition of Lacroix + Kress GmbH strengthens its position in the oxygen-free copper market, particularly within the growing electric vehicle sector.
In-Depth Oxygen Free Copper Bars Market Market Outlook
The Oxygen-Free Copper Bars market is poised for continued growth, driven by the ongoing expansion of the electric vehicle and renewable energy sectors. Strategic partnerships and investments in research and development will further enhance product innovation and market penetration. The focus on sustainable manufacturing practices and circular economy initiatives will shape future market dynamics, presenting both opportunities and challenges for key players. The market holds strong potential for expansion into emerging markets and specialized applications.
Oxygen Free Copper Bars Market Segmentation
-
1. Grade
- 1.1. CU-OF
- 1.2. CU-OFE
-
2. Product
- 2.1. Wires
- 2.2. Strips
- 2.3. Busbars and Rods
- 2.4. Other Products (Tubes and Pipes, Etc.)
-
3. End-user Industry
- 3.1. Electrical and Electronics
- 3.2. Automotive
- 3.3. Industrial
- 3.4. Other End-user Industry
Oxygen Free Copper Bars Market Segmentation By Geography
-
1. Asia Pacific
- 1.1. China
- 1.2. India
- 1.3. Japan
- 1.4. South Korea
- 1.5. Rest of Asia Pacific
-
2. North America
- 2.1. United States
- 2.2. Canada
- 2.3. Mexico
-
3. Europe
- 3.1. Germany
- 3.2. United Kingdom
- 3.3. France
- 3.4. Italy
- 3.5. Spain
- 3.6. Rest of Europe
-
4. South America
- 4.1. Brazil
- 4.2. Argentina
- 4.3. Rest of South America
-
5. Middle East and Africa
- 5.1. Saudi Arabia
- 5.2. South Africa
- 5.3. UAE
- 5.4. Rest of Middle East and Africa
Oxygen Free Copper Bars Market Regional Market Share
Geographic Coverage of Oxygen Free Copper Bars Market
Oxygen Free Copper Bars Market REPORT HIGHLIGHTS
| Aspects | Details |
|---|---|
| Study Period | 2020-2034 |
| Base Year | 2025 |
| Estimated Year | 2026 |
| Forecast Period | 2026-2034 |
| Historical Period | 2020-2025 |
| Growth Rate | CAGR of > 5.00% from 2020-2034 |
| Segmentation |
|
Table of Contents
- 1. Introduction
- 1.1. Research Scope
- 1.2. Market Segmentation
- 1.3. Research Objective
- 1.4. Definitions and Assumptions
- 2. Executive Summary
- 2.1. Market Snapshot
- 3. Market Dynamics
- 3.1. Market Drivers
- 3.2. Market Restrains
- 3.3. Market Trends
- 3.4. Market Opportunities
- 4. Market Factor Analysis
- 4.1. Porters Five Forces
- 4.1.1. Bargaining Power of Suppliers
- 4.1.2. Bargaining Power of Buyers
- 4.1.3. Threat of New Entrants
- 4.1.4. Threat of Substitutes
- 4.1.5. Competitive Rivalry
- 4.2. PESTEL analysis
- 4.3. BCG Analysis
- 4.3.1. Stars (High Growth, High Market Share)
- 4.3.2. Cash Cows (Low Growth, High Market Share)
- 4.3.3. Question Mark (High Growth, Low Market Share)
- 4.3.4. Dogs (Low Growth, Low Market Share)
- 4.4. Ansoff Matrix Analysis
- 4.5. Supply Chain Analysis
- 4.6. Regulatory Landscape
- 4.7. Current Market Potential and Opportunity Assessment (TAM–SAM–SOM Framework)
- 4.8. VDR Analyst Note
- 4.1. Porters Five Forces
- 5. Market Analysis, Insights and Forecast 2021-2033
- 5.1. Market Analysis, Insights and Forecast - by Grade
- 5.1.1. CU-OF
- 5.1.2. CU-OFE
- 5.2. Market Analysis, Insights and Forecast - by Product
- 5.2.1. Wires
- 5.2.2. Strips
- 5.2.3. Busbars and Rods
- 5.2.4. Other Products (Tubes and Pipes, Etc.)
- 5.3. Market Analysis, Insights and Forecast - by End-user Industry
- 5.3.1. Electrical and Electronics
- 5.3.2. Automotive
- 5.3.3. Industrial
- 5.3.4. Other End-user Industry
- 5.4. Market Analysis, Insights and Forecast - by Region
- 5.4.1. Asia Pacific
- 5.4.2. North America
- 5.4.3. Europe
- 5.4.4. South America
- 5.4.5. Middle East and Africa
- 5.1. Market Analysis, Insights and Forecast - by Grade
- 6. Global Oxygen Free Copper Bars Market Analysis, Insights and Forecast, 2021-2033
- 6.1. Market Analysis, Insights and Forecast - by Grade
- 6.1.1. CU-OF
- 6.1.2. CU-OFE
- 6.2. Market Analysis, Insights and Forecast - by Product
- 6.2.1. Wires
- 6.2.2. Strips
- 6.2.3. Busbars and Rods
- 6.2.4. Other Products (Tubes and Pipes, Etc.)
- 6.3. Market Analysis, Insights and Forecast - by End-user Industry
- 6.3.1. Electrical and Electronics
- 6.3.2. Automotive
- 6.3.3. Industrial
- 6.3.4. Other End-user Industry
- 6.1. Market Analysis, Insights and Forecast - by Grade
- 7. Asia Pacific Oxygen Free Copper Bars Market Analysis, Insights and Forecast, 2021-2033
- 7.1. Market Analysis, Insights and Forecast - by Grade
- 7.1.1. CU-OF
- 7.1.2. CU-OFE
- 7.2. Market Analysis, Insights and Forecast - by Product
- 7.2.1. Wires
- 7.2.2. Strips
- 7.2.3. Busbars and Rods
- 7.2.4. Other Products (Tubes and Pipes, Etc.)
- 7.3. Market Analysis, Insights and Forecast - by End-user Industry
- 7.3.1. Electrical and Electronics
- 7.3.2. Automotive
- 7.3.3. Industrial
- 7.3.4. Other End-user Industry
- 7.1. Market Analysis, Insights and Forecast - by Grade
- 8. North America Oxygen Free Copper Bars Market Analysis, Insights and Forecast, 2021-2033
- 8.1. Market Analysis, Insights and Forecast - by Grade
- 8.1.1. CU-OF
- 8.1.2. CU-OFE
- 8.2. Market Analysis, Insights and Forecast - by Product
- 8.2.1. Wires
- 8.2.2. Strips
- 8.2.3. Busbars and Rods
- 8.2.4. Other Products (Tubes and Pipes, Etc.)
- 8.3. Market Analysis, Insights and Forecast - by End-user Industry
- 8.3.1. Electrical and Electronics
- 8.3.2. Automotive
- 8.3.3. Industrial
- 8.3.4. Other End-user Industry
- 8.1. Market Analysis, Insights and Forecast - by Grade
- 9. Europe Oxygen Free Copper Bars Market Analysis, Insights and Forecast, 2021-2033
- 9.1. Market Analysis, Insights and Forecast - by Grade
- 9.1.1. CU-OF
- 9.1.2. CU-OFE
- 9.2. Market Analysis, Insights and Forecast - by Product
- 9.2.1. Wires
- 9.2.2. Strips
- 9.2.3. Busbars and Rods
- 9.2.4. Other Products (Tubes and Pipes, Etc.)
- 9.3. Market Analysis, Insights and Forecast - by End-user Industry
- 9.3.1. Electrical and Electronics
- 9.3.2. Automotive
- 9.3.3. Industrial
- 9.3.4. Other End-user Industry
- 9.1. Market Analysis, Insights and Forecast - by Grade
- 10. South America Oxygen Free Copper Bars Market Analysis, Insights and Forecast, 2021-2033
- 10.1. Market Analysis, Insights and Forecast - by Grade
- 10.1.1. CU-OF
- 10.1.2. CU-OFE
- 10.2. Market Analysis, Insights and Forecast - by Product
- 10.2.1. Wires
- 10.2.2. Strips
- 10.2.3. Busbars and Rods
- 10.2.4. Other Products (Tubes and Pipes, Etc.)
- 10.3. Market Analysis, Insights and Forecast - by End-user Industry
- 10.3.1. Electrical and Electronics
- 10.3.2. Automotive
- 10.3.3. Industrial
- 10.3.4. Other End-user Industry
- 10.1. Market Analysis, Insights and Forecast - by Grade
- 11. Middle East and Africa Oxygen Free Copper Bars Market Analysis, Insights and Forecast, 2021-2033
- 11.1. Market Analysis, Insights and Forecast - by Grade
- 11.1.1. CU-OF
- 11.1.2. CU-OFE
- 11.2. Market Analysis, Insights and Forecast - by Product
- 11.2.1. Wires
- 11.2.2. Strips
- 11.2.3. Busbars and Rods
- 11.2.4. Other Products (Tubes and Pipes, Etc.)
- 11.3. Market Analysis, Insights and Forecast - by End-user Industry
- 11.3.1. Electrical and Electronics
- 11.3.2. Automotive
- 11.3.3. Industrial
- 11.3.4. Other End-user Industry
- 11.1. Market Analysis, Insights and Forecast - by Grade
- 12. Competitive Analysis
- 12.1. Company Profiles
- 12.1.1 FURUKAWA ELECTRIC CO LTD
- 12.1.1.1. Company Overview
- 12.1.1.2. Products
- 12.1.1.3. Company Financials
- 12.1.1.4. SWOT Analysis
- 12.1.2 KGHM
- 12.1.2.1. Company Overview
- 12.1.2.2. Products
- 12.1.2.3. Company Financials
- 12.1.2.4. SWOT Analysis
- 12.1.3 PROTERIAL Ltd
- 12.1.3.1. Company Overview
- 12.1.3.2. Products
- 12.1.3.3. Company Financials
- 12.1.3.4. SWOT Analysis
- 12.1.4 KME GERMANY GMBH
- 12.1.4.1. Company Overview
- 12.1.4.2. Products
- 12.1.4.3. Company Financials
- 12.1.4.4. SWOT Analysis
- 12.1.5 Mitsubishi Materials Corporation
- 12.1.5.1. Company Overview
- 12.1.5.2. Products
- 12.1.5.3. Company Financials
- 12.1.5.4. SWOT Analysis
- 12.1.6 Metrod Holdings Berhad
- 12.1.6.1. Company Overview
- 12.1.6.2. Products
- 12.1.6.3. Company Financials
- 12.1.6.4. SWOT Analysis
- 12.1.7 Sam Dong
- 12.1.7.1. Company Overview
- 12.1.7.2. Products
- 12.1.7.3. Company Financials
- 12.1.7.4. SWOT Analysis
- 12.1.8 Farmers Copper LTD
- 12.1.8.1. Company Overview
- 12.1.8.2. Products
- 12.1.8.3. Company Financials
- 12.1.8.4. SWOT Analysis
- 12.1.9 Lacroix + Kress GmbH
- 12.1.9.1. Company Overview
- 12.1.9.2. Products
- 12.1.9.3. Company Financials
- 12.1.9.4. SWOT Analysis
- 12.1.10 Aviva Metals
- 12.1.10.1. Company Overview
- 12.1.10.2. Products
- 12.1.10.3. Company Financials
- 12.1.10.4. SWOT Analysis
- 12.1.11 Cupori
- 12.1.11.1. Company Overview
- 12.1.11.2. Products
- 12.1.11.3. Company Financials
- 12.1.11.4. SWOT Analysis
- 12.1.12 Citizen Metalloys Ltd
- 12.1.12.1. Company Overview
- 12.1.12.2. Products
- 12.1.12.3. Company Financials
- 12.1.12.4. SWOT Analysis
- 12.1.13 Copper Braid Products
- 12.1.13.1. Company Overview
- 12.1.13.2. Products
- 12.1.13.3. Company Financials
- 12.1.13.4. SWOT Analysis
- 12.1.1 FURUKAWA ELECTRIC CO LTD
- 12.2. Market Entropy
- 12.2.1 Company's Key Areas Served
- 12.2.2 Recent Developments
- 12.3. Company Market Share Analysis 2025
- 12.3.1 Top 5 Companies Market Share Analysis
- 12.3.2 Top 3 Companies Market Share Analysis
- 12.4. List of Potential Customers
- 13. Research Methodology
List of Figures
- Figure 1: Global Oxygen Free Copper Bars Market Revenue Breakdown (Million, %) by Region 2025 & 2033
- Figure 2: Global Oxygen Free Copper Bars Market Volume Breakdown (K Tons, %) by Region 2025 & 2033
- Figure 3: Asia Pacific Oxygen Free Copper Bars Market Revenue (Million), by Grade 2025 & 2033
- Figure 4: Asia Pacific Oxygen Free Copper Bars Market Volume (K Tons), by Grade 2025 & 2033
- Figure 5: Asia Pacific Oxygen Free Copper Bars Market Revenue Share (%), by Grade 2025 & 2033
- Figure 6: Asia Pacific Oxygen Free Copper Bars Market Volume Share (%), by Grade 2025 & 2033
- Figure 7: Asia Pacific Oxygen Free Copper Bars Market Revenue (Million), by Product 2025 & 2033
- Figure 8: Asia Pacific Oxygen Free Copper Bars Market Volume (K Tons), by Product 2025 & 2033
- Figure 9: Asia Pacific Oxygen Free Copper Bars Market Revenue Share (%), by Product 2025 & 2033
- Figure 10: Asia Pacific Oxygen Free Copper Bars Market Volume Share (%), by Product 2025 & 2033
- Figure 11: Asia Pacific Oxygen Free Copper Bars Market Revenue (Million), by End-user Industry 2025 & 2033
- Figure 12: Asia Pacific Oxygen Free Copper Bars Market Volume (K Tons), by End-user Industry 2025 & 2033
- Figure 13: Asia Pacific Oxygen Free Copper Bars Market Revenue Share (%), by End-user Industry 2025 & 2033
- Figure 14: Asia Pacific Oxygen Free Copper Bars Market Volume Share (%), by End-user Industry 2025 & 2033
- Figure 15: Asia Pacific Oxygen Free Copper Bars Market Revenue (Million), by Country 2025 & 2033
- Figure 16: Asia Pacific Oxygen Free Copper Bars Market Volume (K Tons), by Country 2025 & 2033
- Figure 17: Asia Pacific Oxygen Free Copper Bars Market Revenue Share (%), by Country 2025 & 2033
- Figure 18: Asia Pacific Oxygen Free Copper Bars Market Volume Share (%), by Country 2025 & 2033
- Figure 19: North America Oxygen Free Copper Bars Market Revenue (Million), by Grade 2025 & 2033
- Figure 20: North America Oxygen Free Copper Bars Market Volume (K Tons), by Grade 2025 & 2033
- Figure 21: North America Oxygen Free Copper Bars Market Revenue Share (%), by Grade 2025 & 2033
- Figure 22: North America Oxygen Free Copper Bars Market Volume Share (%), by Grade 2025 & 2033
- Figure 23: North America Oxygen Free Copper Bars Market Revenue (Million), by Product 2025 & 2033
- Figure 24: North America Oxygen Free Copper Bars Market Volume (K Tons), by Product 2025 & 2033
- Figure 25: North America Oxygen Free Copper Bars Market Revenue Share (%), by Product 2025 & 2033
- Figure 26: North America Oxygen Free Copper Bars Market Volume Share (%), by Product 2025 & 2033
- Figure 27: North America Oxygen Free Copper Bars Market Revenue (Million), by End-user Industry 2025 & 2033
- Figure 28: North America Oxygen Free Copper Bars Market Volume (K Tons), by End-user Industry 2025 & 2033
- Figure 29: North America Oxygen Free Copper Bars Market Revenue Share (%), by End-user Industry 2025 & 2033
- Figure 30: North America Oxygen Free Copper Bars Market Volume Share (%), by End-user Industry 2025 & 2033
- Figure 31: North America Oxygen Free Copper Bars Market Revenue (Million), by Country 2025 & 2033
- Figure 32: North America Oxygen Free Copper Bars Market Volume (K Tons), by Country 2025 & 2033
- Figure 33: North America Oxygen Free Copper Bars Market Revenue Share (%), by Country 2025 & 2033
- Figure 34: North America Oxygen Free Copper Bars Market Volume Share (%), by Country 2025 & 2033
- Figure 35: Europe Oxygen Free Copper Bars Market Revenue (Million), by Grade 2025 & 2033
- Figure 36: Europe Oxygen Free Copper Bars Market Volume (K Tons), by Grade 2025 & 2033
- Figure 37: Europe Oxygen Free Copper Bars Market Revenue Share (%), by Grade 2025 & 2033
- Figure 38: Europe Oxygen Free Copper Bars Market Volume Share (%), by Grade 2025 & 2033
- Figure 39: Europe Oxygen Free Copper Bars Market Revenue (Million), by Product 2025 & 2033
- Figure 40: Europe Oxygen Free Copper Bars Market Volume (K Tons), by Product 2025 & 2033
- Figure 41: Europe Oxygen Free Copper Bars Market Revenue Share (%), by Product 2025 & 2033
- Figure 42: Europe Oxygen Free Copper Bars Market Volume Share (%), by Product 2025 & 2033
- Figure 43: Europe Oxygen Free Copper Bars Market Revenue (Million), by End-user Industry 2025 & 2033
- Figure 44: Europe Oxygen Free Copper Bars Market Volume (K Tons), by End-user Industry 2025 & 2033
- Figure 45: Europe Oxygen Free Copper Bars Market Revenue Share (%), by End-user Industry 2025 & 2033
- Figure 46: Europe Oxygen Free Copper Bars Market Volume Share (%), by End-user Industry 2025 & 2033
- Figure 47: Europe Oxygen Free Copper Bars Market Revenue (Million), by Country 2025 & 2033
- Figure 48: Europe Oxygen Free Copper Bars Market Volume (K Tons), by Country 2025 & 2033
- Figure 49: Europe Oxygen Free Copper Bars Market Revenue Share (%), by Country 2025 & 2033
- Figure 50: Europe Oxygen Free Copper Bars Market Volume Share (%), by Country 2025 & 2033
- Figure 51: South America Oxygen Free Copper Bars Market Revenue (Million), by Grade 2025 & 2033
- Figure 52: South America Oxygen Free Copper Bars Market Volume (K Tons), by Grade 2025 & 2033
- Figure 53: South America Oxygen Free Copper Bars Market Revenue Share (%), by Grade 2025 & 2033
- Figure 54: South America Oxygen Free Copper Bars Market Volume Share (%), by Grade 2025 & 2033
- Figure 55: South America Oxygen Free Copper Bars Market Revenue (Million), by Product 2025 & 2033
- Figure 56: South America Oxygen Free Copper Bars Market Volume (K Tons), by Product 2025 & 2033
- Figure 57: South America Oxygen Free Copper Bars Market Revenue Share (%), by Product 2025 & 2033
- Figure 58: South America Oxygen Free Copper Bars Market Volume Share (%), by Product 2025 & 2033
- Figure 59: South America Oxygen Free Copper Bars Market Revenue (Million), by End-user Industry 2025 & 2033
- Figure 60: South America Oxygen Free Copper Bars Market Volume (K Tons), by End-user Industry 2025 & 2033
- Figure 61: South America Oxygen Free Copper Bars Market Revenue Share (%), by End-user Industry 2025 & 2033
- Figure 62: South America Oxygen Free Copper Bars Market Volume Share (%), by End-user Industry 2025 & 2033
- Figure 63: South America Oxygen Free Copper Bars Market Revenue (Million), by Country 2025 & 2033
- Figure 64: South America Oxygen Free Copper Bars Market Volume (K Tons), by Country 2025 & 2033
- Figure 65: South America Oxygen Free Copper Bars Market Revenue Share (%), by Country 2025 & 2033
- Figure 66: South America Oxygen Free Copper Bars Market Volume Share (%), by Country 2025 & 2033
- Figure 67: Middle East and Africa Oxygen Free Copper Bars Market Revenue (Million), by Grade 2025 & 2033
- Figure 68: Middle East and Africa Oxygen Free Copper Bars Market Volume (K Tons), by Grade 2025 & 2033
- Figure 69: Middle East and Africa Oxygen Free Copper Bars Market Revenue Share (%), by Grade 2025 & 2033
- Figure 70: Middle East and Africa Oxygen Free Copper Bars Market Volume Share (%), by Grade 2025 & 2033
- Figure 71: Middle East and Africa Oxygen Free Copper Bars Market Revenue (Million), by Product 2025 & 2033
- Figure 72: Middle East and Africa Oxygen Free Copper Bars Market Volume (K Tons), by Product 2025 & 2033
- Figure 73: Middle East and Africa Oxygen Free Copper Bars Market Revenue Share (%), by Product 2025 & 2033
- Figure 74: Middle East and Africa Oxygen Free Copper Bars Market Volume Share (%), by Product 2025 & 2033
- Figure 75: Middle East and Africa Oxygen Free Copper Bars Market Revenue (Million), by End-user Industry 2025 & 2033
- Figure 76: Middle East and Africa Oxygen Free Copper Bars Market Volume (K Tons), by End-user Industry 2025 & 2033
- Figure 77: Middle East and Africa Oxygen Free Copper Bars Market Revenue Share (%), by End-user Industry 2025 & 2033
- Figure 78: Middle East and Africa Oxygen Free Copper Bars Market Volume Share (%), by End-user Industry 2025 & 2033
- Figure 79: Middle East and Africa Oxygen Free Copper Bars Market Revenue (Million), by Country 2025 & 2033
- Figure 80: Middle East and Africa Oxygen Free Copper Bars Market Volume (K Tons), by Country 2025 & 2033
- Figure 81: Middle East and Africa Oxygen Free Copper Bars Market Revenue Share (%), by Country 2025 & 2033
- Figure 82: Middle East and Africa Oxygen Free Copper Bars Market Volume Share (%), by Country 2025 & 2033
List of Tables
- Table 1: Global Oxygen Free Copper Bars Market Revenue Million Forecast, by Grade 2020 & 2033
- Table 2: Global Oxygen Free Copper Bars Market Volume K Tons Forecast, by Grade 2020 & 2033
- Table 3: Global Oxygen Free Copper Bars Market Revenue Million Forecast, by Product 2020 & 2033
- Table 4: Global Oxygen Free Copper Bars Market Volume K Tons Forecast, by Product 2020 & 2033
- Table 5: Global Oxygen Free Copper Bars Market Revenue Million Forecast, by End-user Industry 2020 & 2033
- Table 6: Global Oxygen Free Copper Bars Market Volume K Tons Forecast, by End-user Industry 2020 & 2033
- Table 7: Global Oxygen Free Copper Bars Market Revenue Million Forecast, by Region 2020 & 2033
- Table 8: Global Oxygen Free Copper Bars Market Volume K Tons Forecast, by Region 2020 & 2033
- Table 9: Global Oxygen Free Copper Bars Market Revenue Million Forecast, by Grade 2020 & 2033
- Table 10: Global Oxygen Free Copper Bars Market Volume K Tons Forecast, by Grade 2020 & 2033
- Table 11: Global Oxygen Free Copper Bars Market Revenue Million Forecast, by Product 2020 & 2033
- Table 12: Global Oxygen Free Copper Bars Market Volume K Tons Forecast, by Product 2020 & 2033
- Table 13: Global Oxygen Free Copper Bars Market Revenue Million Forecast, by End-user Industry 2020 & 2033
- Table 14: Global Oxygen Free Copper Bars Market Volume K Tons Forecast, by End-user Industry 2020 & 2033
- Table 15: Global Oxygen Free Copper Bars Market Revenue Million Forecast, by Country 2020 & 2033
- Table 16: Global Oxygen Free Copper Bars Market Volume K Tons Forecast, by Country 2020 & 2033
- Table 17: China Oxygen Free Copper Bars Market Revenue (Million) Forecast, by Application 2020 & 2033
- Table 18: China Oxygen Free Copper Bars Market Volume (K Tons) Forecast, by Application 2020 & 2033
- Table 19: India Oxygen Free Copper Bars Market Revenue (Million) Forecast, by Application 2020 & 2033
- Table 20: India Oxygen Free Copper Bars Market Volume (K Tons) Forecast, by Application 2020 & 2033
- Table 21: Japan Oxygen Free Copper Bars Market Revenue (Million) Forecast, by Application 2020 & 2033
- Table 22: Japan Oxygen Free Copper Bars Market Volume (K Tons) Forecast, by Application 2020 & 2033
- Table 23: South Korea Oxygen Free Copper Bars Market Revenue (Million) Forecast, by Application 2020 & 2033
- Table 24: South Korea Oxygen Free Copper Bars Market Volume (K Tons) Forecast, by Application 2020 & 2033
- Table 25: Rest of Asia Pacific Oxygen Free Copper Bars Market Revenue (Million) Forecast, by Application 2020 & 2033
- Table 26: Rest of Asia Pacific Oxygen Free Copper Bars Market Volume (K Tons) Forecast, by Application 2020 & 2033
- Table 27: Global Oxygen Free Copper Bars Market Revenue Million Forecast, by Grade 2020 & 2033
- Table 28: Global Oxygen Free Copper Bars Market Volume K Tons Forecast, by Grade 2020 & 2033
- Table 29: Global Oxygen Free Copper Bars Market Revenue Million Forecast, by Product 2020 & 2033
- Table 30: Global Oxygen Free Copper Bars Market Volume K Tons Forecast, by Product 2020 & 2033
- Table 31: Global Oxygen Free Copper Bars Market Revenue Million Forecast, by End-user Industry 2020 & 2033
- Table 32: Global Oxygen Free Copper Bars Market Volume K Tons Forecast, by End-user Industry 2020 & 2033
- Table 33: Global Oxygen Free Copper Bars Market Revenue Million Forecast, by Country 2020 & 2033
- Table 34: Global Oxygen Free Copper Bars Market Volume K Tons Forecast, by Country 2020 & 2033
- Table 35: United States Oxygen Free Copper Bars Market Revenue (Million) Forecast, by Application 2020 & 2033
- Table 36: United States Oxygen Free Copper Bars Market Volume (K Tons) Forecast, by Application 2020 & 2033
- Table 37: Canada Oxygen Free Copper Bars Market Revenue (Million) Forecast, by Application 2020 & 2033
- Table 38: Canada Oxygen Free Copper Bars Market Volume (K Tons) Forecast, by Application 2020 & 2033
- Table 39: Mexico Oxygen Free Copper Bars Market Revenue (Million) Forecast, by Application 2020 & 2033
- Table 40: Mexico Oxygen Free Copper Bars Market Volume (K Tons) Forecast, by Application 2020 & 2033
- Table 41: Global Oxygen Free Copper Bars Market Revenue Million Forecast, by Grade 2020 & 2033
- Table 42: Global Oxygen Free Copper Bars Market Volume K Tons Forecast, by Grade 2020 & 2033
- Table 43: Global Oxygen Free Copper Bars Market Revenue Million Forecast, by Product 2020 & 2033
- Table 44: Global Oxygen Free Copper Bars Market Volume K Tons Forecast, by Product 2020 & 2033
- Table 45: Global Oxygen Free Copper Bars Market Revenue Million Forecast, by End-user Industry 2020 & 2033
- Table 46: Global Oxygen Free Copper Bars Market Volume K Tons Forecast, by End-user Industry 2020 & 2033
- Table 47: Global Oxygen Free Copper Bars Market Revenue Million Forecast, by Country 2020 & 2033
- Table 48: Global Oxygen Free Copper Bars Market Volume K Tons Forecast, by Country 2020 & 2033
- Table 49: Germany Oxygen Free Copper Bars Market Revenue (Million) Forecast, by Application 2020 & 2033
- Table 50: Germany Oxygen Free Copper Bars Market Volume (K Tons) Forecast, by Application 2020 & 2033
- Table 51: United Kingdom Oxygen Free Copper Bars Market Revenue (Million) Forecast, by Application 2020 & 2033
- Table 52: United Kingdom Oxygen Free Copper Bars Market Volume (K Tons) Forecast, by Application 2020 & 2033
- Table 53: France Oxygen Free Copper Bars Market Revenue (Million) Forecast, by Application 2020 & 2033
- Table 54: France Oxygen Free Copper Bars Market Volume (K Tons) Forecast, by Application 2020 & 2033
- Table 55: Italy Oxygen Free Copper Bars Market Revenue (Million) Forecast, by Application 2020 & 2033
- Table 56: Italy Oxygen Free Copper Bars Market Volume (K Tons) Forecast, by Application 2020 & 2033
- Table 57: Spain Oxygen Free Copper Bars Market Revenue (Million) Forecast, by Application 2020 & 2033
- Table 58: Spain Oxygen Free Copper Bars Market Volume (K Tons) Forecast, by Application 2020 & 2033
- Table 59: Rest of Europe Oxygen Free Copper Bars Market Revenue (Million) Forecast, by Application 2020 & 2033
- Table 60: Rest of Europe Oxygen Free Copper Bars Market Volume (K Tons) Forecast, by Application 2020 & 2033
- Table 61: Global Oxygen Free Copper Bars Market Revenue Million Forecast, by Grade 2020 & 2033
- Table 62: Global Oxygen Free Copper Bars Market Volume K Tons Forecast, by Grade 2020 & 2033
- Table 63: Global Oxygen Free Copper Bars Market Revenue Million Forecast, by Product 2020 & 2033
- Table 64: Global Oxygen Free Copper Bars Market Volume K Tons Forecast, by Product 2020 & 2033
- Table 65: Global Oxygen Free Copper Bars Market Revenue Million Forecast, by End-user Industry 2020 & 2033
- Table 66: Global Oxygen Free Copper Bars Market Volume K Tons Forecast, by End-user Industry 2020 & 2033
- Table 67: Global Oxygen Free Copper Bars Market Revenue Million Forecast, by Country 2020 & 2033
- Table 68: Global Oxygen Free Copper Bars Market Volume K Tons Forecast, by Country 2020 & 2033
- Table 69: Brazil Oxygen Free Copper Bars Market Revenue (Million) Forecast, by Application 2020 & 2033
- Table 70: Brazil Oxygen Free Copper Bars Market Volume (K Tons) Forecast, by Application 2020 & 2033
- Table 71: Argentina Oxygen Free Copper Bars Market Revenue (Million) Forecast, by Application 2020 & 2033
- Table 72: Argentina Oxygen Free Copper Bars Market Volume (K Tons) Forecast, by Application 2020 & 2033
- Table 73: Rest of South America Oxygen Free Copper Bars Market Revenue (Million) Forecast, by Application 2020 & 2033
- Table 74: Rest of South America Oxygen Free Copper Bars Market Volume (K Tons) Forecast, by Application 2020 & 2033
- Table 75: Global Oxygen Free Copper Bars Market Revenue Million Forecast, by Grade 2020 & 2033
- Table 76: Global Oxygen Free Copper Bars Market Volume K Tons Forecast, by Grade 2020 & 2033
- Table 77: Global Oxygen Free Copper Bars Market Revenue Million Forecast, by Product 2020 & 2033
- Table 78: Global Oxygen Free Copper Bars Market Volume K Tons Forecast, by Product 2020 & 2033
- Table 79: Global Oxygen Free Copper Bars Market Revenue Million Forecast, by End-user Industry 2020 & 2033
- Table 80: Global Oxygen Free Copper Bars Market Volume K Tons Forecast, by End-user Industry 2020 & 2033
- Table 81: Global Oxygen Free Copper Bars Market Revenue Million Forecast, by Country 2020 & 2033
- Table 82: Global Oxygen Free Copper Bars Market Volume K Tons Forecast, by Country 2020 & 2033
- Table 83: Saudi Arabia Oxygen Free Copper Bars Market Revenue (Million) Forecast, by Application 2020 & 2033
- Table 84: Saudi Arabia Oxygen Free Copper Bars Market Volume (K Tons) Forecast, by Application 2020 & 2033
- Table 85: South Africa Oxygen Free Copper Bars Market Revenue (Million) Forecast, by Application 2020 & 2033
- Table 86: South Africa Oxygen Free Copper Bars Market Volume (K Tons) Forecast, by Application 2020 & 2033
- Table 87: UAE Oxygen Free Copper Bars Market Revenue (Million) Forecast, by Application 2020 & 2033
- Table 88: UAE Oxygen Free Copper Bars Market Volume (K Tons) Forecast, by Application 2020 & 2033
- Table 89: Rest of Middle East and Africa Oxygen Free Copper Bars Market Revenue (Million) Forecast, by Application 2020 & 2033
- Table 90: Rest of Middle East and Africa Oxygen Free Copper Bars Market Volume (K Tons) Forecast, by Application 2020 & 2033
Frequently Asked Questions
1. What is the projected Compound Annual Growth Rate (CAGR) of the Oxygen Free Copper Bars Market?
The projected CAGR is approximately > 5.00%.
2. Which companies are prominent players in the Oxygen Free Copper Bars Market?
Key companies in the market include FURUKAWA ELECTRIC CO LTD, KGHM, PROTERIAL Ltd, KME GERMANY GMBH, Mitsubishi Materials Corporation, Metrod Holdings Berhad, Sam Dong, Farmers Copper LTD, Lacroix + Kress GmbH, Aviva Metals, Cupori, Citizen Metalloys Ltd, Copper Braid Products.
3. What are the main segments of the Oxygen Free Copper Bars Market?
The market segments include Grade, Product, End-user Industry.
4. Can you provide details about the market size?
The market size is estimated to be USD 20.29 Million as of 2022.
5. What are some drivers contributing to market growth?
Increasing Demand from Semiconductor; Increasing Demand from Automotive Sector; Other Drivers.
6. What are the notable trends driving market growth?
Electrical and Electronics Industry to Dominate the Market.
7. Are there any restraints impacting market growth?
High Cost of Copper; Other Restraints.
8. Can you provide examples of recent developments in the market?
Jan 2023: Effective January 04, 2023, Hitachi Metals Ltd changed its name to Proterial Ltd.
9. What pricing options are available for accessing the report?
Pricing options include single-user, multi-user, and enterprise licenses priced at USD 4750, USD 5250, and USD 8750 respectively.
10. Is the market size provided in terms of value or volume?
The market size is provided in terms of value, measured in Million and volume, measured in K Tons.
11. Are there any specific market keywords associated with the report?
Yes, the market keyword associated with the report is "Oxygen Free Copper Bars Market," which aids in identifying and referencing the specific market segment covered.
12. How do I determine which pricing option suits my needs best?
The pricing options vary based on user requirements and access needs. Individual users may opt for single-user licenses, while businesses requiring broader access may choose multi-user or enterprise licenses for cost-effective access to the report.
13. Are there any additional resources or data provided in the Oxygen Free Copper Bars Market report?
While the report offers comprehensive insights, it's advisable to review the specific contents or supplementary materials provided to ascertain if additional resources or data are available.
14. How can I stay updated on further developments or reports in the Oxygen Free Copper Bars Market?
To stay informed about further developments, trends, and reports in the Oxygen Free Copper Bars Market, consider subscribing to industry newsletters, following relevant companies and organizations, or regularly checking reputable industry news sources and publications.
Methodology
Step 1 - Identification of Relevant Samples Size from Population Database


Step 2 - Approaches for Defining Global Market Size (Value, Volume* & Price*)

Note*: In applicable scenarios
Step 3 - Data Sources
Primary Research
- Web Analytics
- Survey Reports
- Research Institute
- Latest Research Reports
- Opinion Leaders
Secondary Research
- Annual Reports
- White Paper
- Latest Press Release
- Industry Association
- Paid Database
- Investor Presentations

Step 4 - Data Triangulation
Involves using different sources of information in order to increase the validity of a study
These sources are likely to be stakeholders in a program - participants, other researchers, program staff, other community members, and so on.
Then we put all data in single framework & apply various statistical tools to find out the dynamic on the market.
During the analysis stage, feedback from the stakeholder groups would be compared to determine areas of agreement as well as areas of divergence