

Key Insights
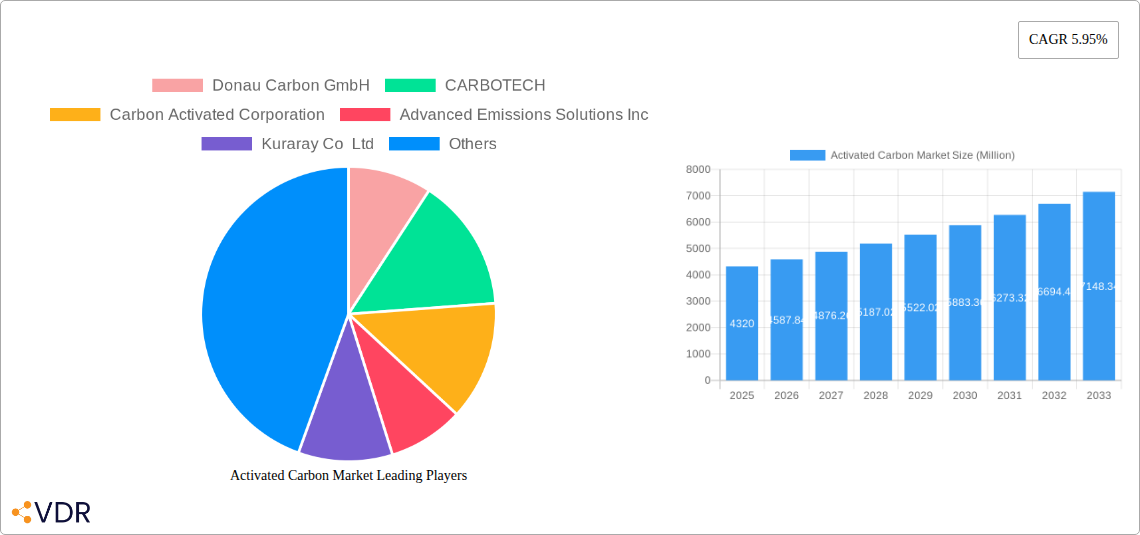
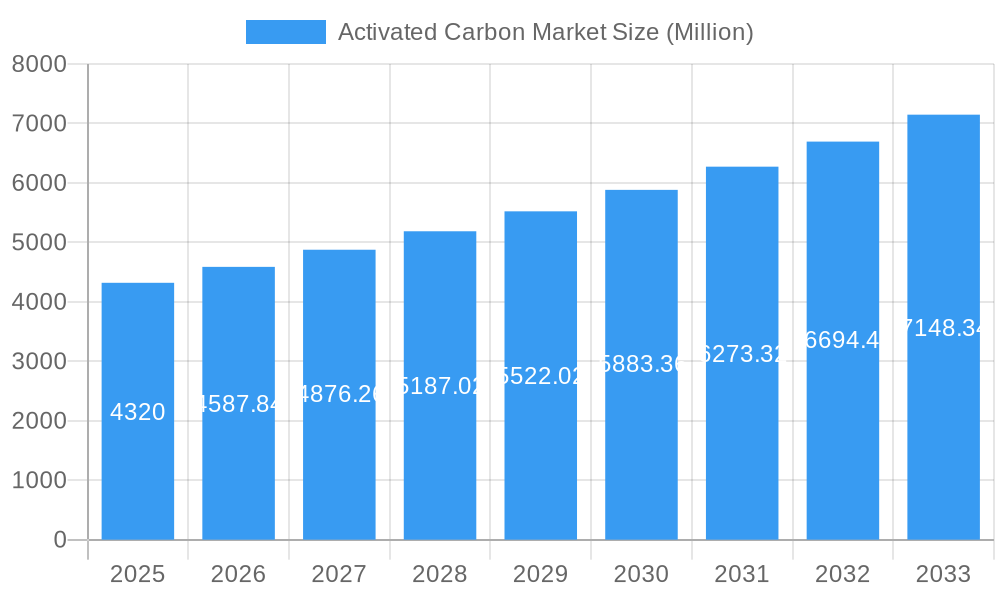
The global activated carbon market, valued at $4.32 billion in 2025, is projected to experience robust growth, driven by increasing demand across diverse sectors. A compound annual growth rate (CAGR) of 5.95% from 2025 to 2033 indicates a significant expansion, primarily fueled by the escalating need for water and air purification solutions in developing economies and the stringent environmental regulations globally. The rise of industrial processes, particularly in manufacturing and energy production, further contributes to market expansion, as activated carbon plays a crucial role in emission control and waste treatment. Powdered activated carbons (PAC) and granular activated carbons (GAC) currently dominate the product type segment, however, extruded or pelletized activated carbons are gaining traction due to their superior performance in specific applications. The water purification segment holds a significant market share, followed by gas purification and applications in the food and beverage, healthcare, and automotive industries. While regional distribution varies, the Asia-Pacific region, particularly China and India, are expected to show significant growth, driven by rapid industrialization and urbanization. Competitive dynamics are characterized by a mix of large multinational corporations and specialized regional players.
Activated Carbon Market Market Size (In Billion)
Continued growth in the activated carbon market hinges on several factors. Technological advancements leading to more efficient and cost-effective activated carbon production methods will likely accelerate market penetration. Furthermore, increasing awareness of environmental issues and the adoption of sustainable practices are pushing demand for advanced filtration and purification technologies. However, fluctuations in raw material prices, stringent regulatory compliance requirements, and the potential for the development of alternative purification technologies present challenges. The market is poised for considerable expansion, with significant opportunities for players who can innovate, adapt to evolving regulations, and cater to the diverse needs of various end-user industries. Strategic collaborations, mergers and acquisitions, and expansion into emerging markets will be crucial for maintaining a competitive edge.
Activated Carbon Market Company Market Share
Activated Carbon Market: A Comprehensive Market Report (2019-2033)
This in-depth report provides a comprehensive analysis of the global Activated Carbon Market, encompassing market dynamics, growth trends, regional dominance, product landscape, key players, and future outlook. The study period covers 2019-2033, with 2025 as the base and estimated year. The report meticulously examines the parent market (water treatment, industrial processing, etc.) and child markets (powdered activated carbon, granular activated carbon, specific applications). Projected market values are presented in million units.
Activated Carbon Market Market Dynamics & Structure
This section analyzes the competitive landscape, technological advancements, regulatory influences, and market consolidation within the activated carbon industry. We examine market concentration through market share analysis, identifying leading players and their strategic moves. The report delves into the impact of technological innovations, such as improved adsorption capabilities and novel production methods, on market growth. Regulatory frameworks influencing production, distribution, and application are also thoroughly evaluated. Furthermore, the report investigates the presence and impact of competitive product substitutes and their market penetration. Finally, end-user demographics and their evolving needs are analyzed, along with a detailed examination of M&A activities and their implications for market structure.
- Market Concentration: The global activated carbon market exhibits a moderately concentrated structure, with the top 10 players accounting for approximately xx% of the total market share in 2025.
- Technological Innovation: Ongoing research focuses on enhancing adsorption capacity, creating sustainable production processes, and expanding applications into emerging sectors. Significant innovation barriers include high R&D costs and stringent regulatory approvals.
- Regulatory Landscape: Stringent environmental regulations drive demand for activated carbon in various applications, but also influence production methods and costs.
- Competitive Substitutes: Alternative technologies like membrane filtration and other adsorbents pose moderate competitive pressure, particularly in specific applications.
- M&A Activity: The market has witnessed xx M&A deals between 2019 and 2024, primarily driven by expansion into new geographical markets and technological diversification. For example, Cabot Corporation's divestiture of Norit Activated Carbon to One Equity Partners in March 2022 reshaped the competitive landscape.
Activated Carbon Market Growth Trends & Insights
This section offers a detailed analysis of the Activated Carbon Market's evolution, focusing on market size, adoption rates, technological disruptions, and shifts in consumer behavior. Leveraging comprehensive data analysis, we project a Compound Annual Growth Rate (CAGR) of xx% from 2025 to 2033, driven by factors such as increasing environmental concerns, stringent regulations, and growth in key end-use sectors. Market penetration analysis provides insights into the adoption rate across various applications and geographical regions. Technological advancements leading to improved efficiency and cost-effectiveness are discussed, along with their impact on market growth. We also analyze evolving consumer preferences for sustainable and eco-friendly products.
Dominant Regions, Countries, or Segments in Activated Carbon Market
This section identifies the leading regions, countries, and segments within the activated carbon market driving growth. Analysis focuses on market share, growth potential, and key drivers across different segments (By Product Type: Powdered Activated Carbons (PAC), Granular Activated Carbons (GAC), Extruded or Pelletized Activated Carbon; By Application: Gas Purification, Water Purification, Metal Extraction, Medicine, Other Applications; By End-user Industry: Water Treatment, Food and Beverage, Healthcare, Automotive, Industrial Processing, Other End-user Industries). We explore the influence of economic policies, infrastructure development, and government regulations on market dominance in key regions.
- Leading Region: Asia-Pacific is projected to maintain its dominance, driven by robust economic growth and increasing demand from water treatment and industrial processing sectors.
- Key Country: China is expected to be the largest national market, followed by the United States and India.
- Dominant Segment (Product Type): Granular Activated Carbons (GAC) holds the largest market share due to its wide application in water treatment.
- Dominant Segment (Application): Water purification remains the dominant application, driven by growing concerns about water scarcity and quality.
- Dominant Segment (End-user Industry): The water treatment industry is the major consumer, followed by the food and beverage and industrial processing sectors.
Activated Carbon Market Product Landscape
The activated carbon market offers a range of products with varying characteristics and applications. Innovations focus on enhanced adsorption capacity, improved mechanical strength, and tailored pore size distributions to meet specific application needs. These advancements enable optimized performance in diverse applications, ranging from water purification to gas separation and environmental remediation. Unique selling propositions include high surface area, customizable pore structures, and environmentally friendly production processes. Technological advancements such as plasma-assisted activation and steam activation are improving product properties and reducing production costs.
Key Drivers, Barriers & Challenges in Activated Carbon Market
Key Drivers: Increasing environmental regulations, growing demand for clean water and air, and expansion of industrial applications are primary drivers. Government initiatives promoting sustainable technologies and the increasing adoption of activated carbon in emerging applications further fuel market growth.
Key Challenges: Fluctuations in raw material prices, stringent regulatory compliance requirements, and competition from substitute technologies pose significant challenges. Supply chain disruptions and the availability of high-quality raw materials can also impact production costs and market stability. The intensifying competition and the entry of new players add to the complexities of the market.
Emerging Opportunities in Activated Carbon Market
Emerging opportunities lie in expanding applications in emerging markets, particularly in developing economies experiencing rapid industrialization. Innovations in material science and manufacturing processes offer scope for developing high-performance activated carbons with enhanced properties. The growing demand for sustainable solutions opens avenues for exploring eco-friendly production methods and applications in renewable energy technologies. Further, niche applications in advanced filtration systems and emerging industries are creating new market prospects.
Growth Accelerators in the Activated Carbon Market Industry
Technological breakthroughs, strategic collaborations between manufacturers and end-users, and targeted market expansion strategies are key growth accelerators. Investment in R&D for advanced materials and sustainable production processes fuels market expansion. The strategic partnerships facilitate the development of customized solutions for specific applications, expanding market reach and penetration. Efforts to penetrate untapped markets in developing economies further stimulate long-term growth.
Key Players Shaping the Activated Carbon Market Market
- Donau Carbon GmbH
- CARBOTECH
- Carbon Activated Corporation
- Advanced Emissions Solutions Inc
- Kuraray Co Ltd
- CPL Activated Carbons
- Evoqua Water Technologies LLC
- Cabot Corporation
- Kureha Corporation
- Ingevity
- Silcarbon Aktivkohle GmbH
- Haycarb (Pvt ) Ltd
- Puragen Activated Carbons
- Jacobi Carbons Group
- Albemarle Corporation
- Veolia (Veolia Water Technologies)
- List Not Exhaustive
Notable Milestones in Activated Carbon Market Sector
- March 2022: Cabot Corporation sold its activated carbon unit, Norit Activated Carbon, to One Equity Partners, creating a new independent player in the market.
In-Depth Activated Carbon Market Market Outlook
The Activated Carbon Market is poised for sustained growth, driven by ongoing technological advancements, increasing environmental awareness, and expanding applications across diverse industries. Strategic investments in R&D, coupled with strategic partnerships and market expansion strategies, will continue to shape the market landscape. Opportunities exist in developing innovative products, tailored solutions for niche applications, and exploring untapped markets globally. The market's future growth trajectory will be influenced by factors such as government regulations, technological disruptions, and the evolving needs of end-user industries.
Activated Carbon Market Segmentation
-
1. Product Type
- 1.1. Powdered Activated Carbons (PAC)
- 1.2. Granular Activated Carbons (GAC)
- 1.3. Extruded or Pelletized Activated Carbon
-
2. Application
- 2.1. Gas Purification
- 2.2. Water Purification
- 2.3. Metal Extraction
- 2.4. Medicine
- 2.5. Other Applications
-
3. End-user Industry
- 3.1. Water Treatment
- 3.2. Food and Beverage
- 3.3. Healthcare
- 3.4. Automotive
- 3.5. Industrial Processing
- 3.6. Other End-user Industries
Activated Carbon Market Segmentation By Geography
-
1. Asia Pacific
- 1.1. China
- 1.2. India
- 1.3. Japan
- 1.4. South Korea
- 1.5. Rest of Asia Pacific
-
2. North America
- 2.1. United States
- 2.2. Canada
- 2.3. Mexico
-
3. Europe
- 3.1. Germany
- 3.2. United Kingdom
- 3.3. France
- 3.4. Italy
- 3.5. Spain
- 3.6. Rest of Europe
-
4. South America
- 4.1. Brazil
- 4.2. Argentina
- 4.3. Rest of South America
-
5. Middle East and Africa
- 5.1. Saudi Arabia
- 5.2. South Africa
- 5.3. Rest of Middle East and Africa
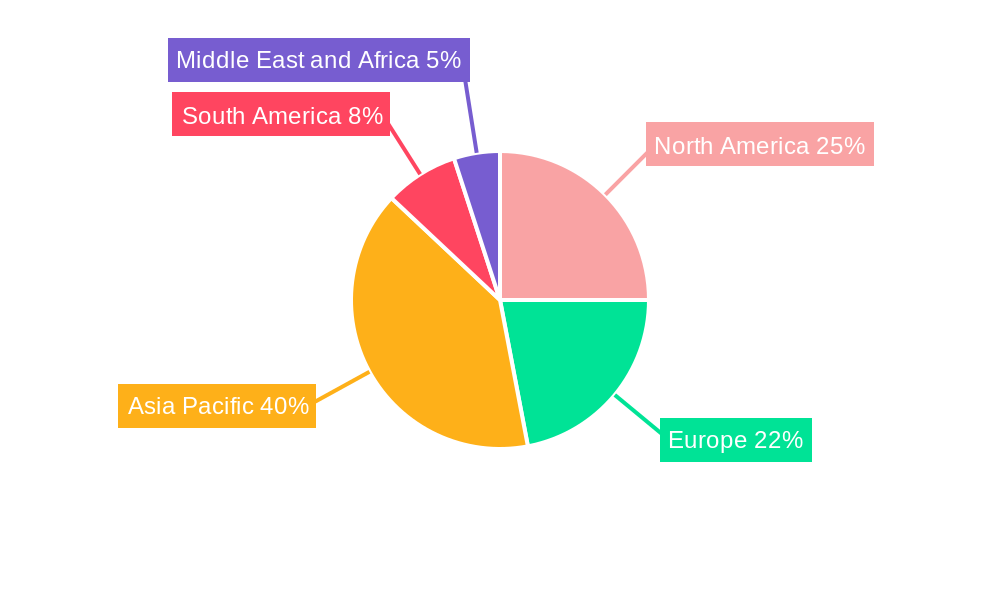
Activated Carbon Market Regional Market Share
Geographic Coverage of Activated Carbon Market
Activated Carbon Market REPORT HIGHLIGHTS
| Aspects | Details |
|---|---|
| Study Period | 2020-2034 |
| Base Year | 2025 |
| Estimated Year | 2026 |
| Forecast Period | 2026-2034 |
| Historical Period | 2020-2025 |
| Growth Rate | CAGR of 5.95% from 2020-2034 |
| Segmentation |
|
Table of Contents
- 1. Introduction
- 1.1. Research Scope
- 1.2. Market Segmentation
- 1.3. Research Objective
- 1.4. Definitions and Assumptions
- 2. Executive Summary
- 2.1. Market Snapshot
- 3. Market Dynamics
- 3.1. Market Drivers
- 3.2. Market Restrains
- 3.3. Market Trends
- 3.4. Market Opportunities
- 4. Market Factor Analysis
- 4.1. Porters Five Forces
- 4.1.1. Bargaining Power of Suppliers
- 4.1.2. Bargaining Power of Buyers
- 4.1.3. Threat of New Entrants
- 4.1.4. Threat of Substitutes
- 4.1.5. Competitive Rivalry
- 4.2. PESTEL analysis
- 4.3. BCG Analysis
- 4.3.1. Stars (High Growth, High Market Share)
- 4.3.2. Cash Cows (Low Growth, High Market Share)
- 4.3.3. Question Mark (High Growth, Low Market Share)
- 4.3.4. Dogs (Low Growth, Low Market Share)
- 4.4. Ansoff Matrix Analysis
- 4.5. Supply Chain Analysis
- 4.6. Regulatory Landscape
- 4.7. Current Market Potential and Opportunity Assessment (TAM–SAM–SOM Framework)
- 4.8. VDR Analyst Note
- 4.1. Porters Five Forces
- 5. Market Analysis, Insights and Forecast 2021-2033
- 5.1. Market Analysis, Insights and Forecast - by Product Type
- 5.1.1. Powdered Activated Carbons (PAC)
- 5.1.2. Granular Activated Carbons (GAC)
- 5.1.3. Extruded or Pelletized Activated Carbon
- 5.2. Market Analysis, Insights and Forecast - by Application
- 5.2.1. Gas Purification
- 5.2.2. Water Purification
- 5.2.3. Metal Extraction
- 5.2.4. Medicine
- 5.2.5. Other Applications
- 5.3. Market Analysis, Insights and Forecast - by End-user Industry
- 5.3.1. Water Treatment
- 5.3.2. Food and Beverage
- 5.3.3. Healthcare
- 5.3.4. Automotive
- 5.3.5. Industrial Processing
- 5.3.6. Other End-user Industries
- 5.4. Market Analysis, Insights and Forecast - by Region
- 5.4.1. Asia Pacific
- 5.4.2. North America
- 5.4.3. Europe
- 5.4.4. South America
- 5.4.5. Middle East and Africa
- 5.1. Market Analysis, Insights and Forecast - by Product Type
- 6. Global Activated Carbon Market Analysis, Insights and Forecast, 2021-2033
- 6.1. Market Analysis, Insights and Forecast - by Product Type
- 6.1.1. Powdered Activated Carbons (PAC)
- 6.1.2. Granular Activated Carbons (GAC)
- 6.1.3. Extruded or Pelletized Activated Carbon
- 6.2. Market Analysis, Insights and Forecast - by Application
- 6.2.1. Gas Purification
- 6.2.2. Water Purification
- 6.2.3. Metal Extraction
- 6.2.4. Medicine
- 6.2.5. Other Applications
- 6.3. Market Analysis, Insights and Forecast - by End-user Industry
- 6.3.1. Water Treatment
- 6.3.2. Food and Beverage
- 6.3.3. Healthcare
- 6.3.4. Automotive
- 6.3.5. Industrial Processing
- 6.3.6. Other End-user Industries
- 6.1. Market Analysis, Insights and Forecast - by Product Type
- 7. Asia Pacific Activated Carbon Market Analysis, Insights and Forecast, 2021-2033
- 7.1. Market Analysis, Insights and Forecast - by Product Type
- 7.1.1. Powdered Activated Carbons (PAC)
- 7.1.2. Granular Activated Carbons (GAC)
- 7.1.3. Extruded or Pelletized Activated Carbon
- 7.2. Market Analysis, Insights and Forecast - by Application
- 7.2.1. Gas Purification
- 7.2.2. Water Purification
- 7.2.3. Metal Extraction
- 7.2.4. Medicine
- 7.2.5. Other Applications
- 7.3. Market Analysis, Insights and Forecast - by End-user Industry
- 7.3.1. Water Treatment
- 7.3.2. Food and Beverage
- 7.3.3. Healthcare
- 7.3.4. Automotive
- 7.3.5. Industrial Processing
- 7.3.6. Other End-user Industries
- 7.1. Market Analysis, Insights and Forecast - by Product Type
- 8. North America Activated Carbon Market Analysis, Insights and Forecast, 2021-2033
- 8.1. Market Analysis, Insights and Forecast - by Product Type
- 8.1.1. Powdered Activated Carbons (PAC)
- 8.1.2. Granular Activated Carbons (GAC)
- 8.1.3. Extruded or Pelletized Activated Carbon
- 8.2. Market Analysis, Insights and Forecast - by Application
- 8.2.1. Gas Purification
- 8.2.2. Water Purification
- 8.2.3. Metal Extraction
- 8.2.4. Medicine
- 8.2.5. Other Applications
- 8.3. Market Analysis, Insights and Forecast - by End-user Industry
- 8.3.1. Water Treatment
- 8.3.2. Food and Beverage
- 8.3.3. Healthcare
- 8.3.4. Automotive
- 8.3.5. Industrial Processing
- 8.3.6. Other End-user Industries
- 8.1. Market Analysis, Insights and Forecast - by Product Type
- 9. Europe Activated Carbon Market Analysis, Insights and Forecast, 2021-2033
- 9.1. Market Analysis, Insights and Forecast - by Product Type
- 9.1.1. Powdered Activated Carbons (PAC)
- 9.1.2. Granular Activated Carbons (GAC)
- 9.1.3. Extruded or Pelletized Activated Carbon
- 9.2. Market Analysis, Insights and Forecast - by Application
- 9.2.1. Gas Purification
- 9.2.2. Water Purification
- 9.2.3. Metal Extraction
- 9.2.4. Medicine
- 9.2.5. Other Applications
- 9.3. Market Analysis, Insights and Forecast - by End-user Industry
- 9.3.1. Water Treatment
- 9.3.2. Food and Beverage
- 9.3.3. Healthcare
- 9.3.4. Automotive
- 9.3.5. Industrial Processing
- 9.3.6. Other End-user Industries
- 9.1. Market Analysis, Insights and Forecast - by Product Type
- 10. South America Activated Carbon Market Analysis, Insights and Forecast, 2021-2033
- 10.1. Market Analysis, Insights and Forecast - by Product Type
- 10.1.1. Powdered Activated Carbons (PAC)
- 10.1.2. Granular Activated Carbons (GAC)
- 10.1.3. Extruded or Pelletized Activated Carbon
- 10.2. Market Analysis, Insights and Forecast - by Application
- 10.2.1. Gas Purification
- 10.2.2. Water Purification
- 10.2.3. Metal Extraction
- 10.2.4. Medicine
- 10.2.5. Other Applications
- 10.3. Market Analysis, Insights and Forecast - by End-user Industry
- 10.3.1. Water Treatment
- 10.3.2. Food and Beverage
- 10.3.3. Healthcare
- 10.3.4. Automotive
- 10.3.5. Industrial Processing
- 10.3.6. Other End-user Industries
- 10.1. Market Analysis, Insights and Forecast - by Product Type
- 11. Middle East and Africa Activated Carbon Market Analysis, Insights and Forecast, 2021-2033
- 11.1. Market Analysis, Insights and Forecast - by Product Type
- 11.1.1. Powdered Activated Carbons (PAC)
- 11.1.2. Granular Activated Carbons (GAC)
- 11.1.3. Extruded or Pelletized Activated Carbon
- 11.2. Market Analysis, Insights and Forecast - by Application
- 11.2.1. Gas Purification
- 11.2.2. Water Purification
- 11.2.3. Metal Extraction
- 11.2.4. Medicine
- 11.2.5. Other Applications
- 11.3. Market Analysis, Insights and Forecast - by End-user Industry
- 11.3.1. Water Treatment
- 11.3.2. Food and Beverage
- 11.3.3. Healthcare
- 11.3.4. Automotive
- 11.3.5. Industrial Processing
- 11.3.6. Other End-user Industries
- 11.1. Market Analysis, Insights and Forecast - by Product Type
- 12. Competitive Analysis
- 12.1. Company Profiles
- 12.1.1 Donau Carbon GmbH
- 12.1.1.1. Company Overview
- 12.1.1.2. Products
- 12.1.1.3. Company Financials
- 12.1.1.4. SWOT Analysis
- 12.1.2 CARBOTECH
- 12.1.2.1. Company Overview
- 12.1.2.2. Products
- 12.1.2.3. Company Financials
- 12.1.2.4. SWOT Analysis
- 12.1.3 Carbon Activated Corporation
- 12.1.3.1. Company Overview
- 12.1.3.2. Products
- 12.1.3.3. Company Financials
- 12.1.3.4. SWOT Analysis
- 12.1.4 Advanced Emissions Solutions Inc
- 12.1.4.1. Company Overview
- 12.1.4.2. Products
- 12.1.4.3. Company Financials
- 12.1.4.4. SWOT Analysis
- 12.1.5 Kuraray Co Ltd
- 12.1.5.1. Company Overview
- 12.1.5.2. Products
- 12.1.5.3. Company Financials
- 12.1.5.4. SWOT Analysis
- 12.1.6 CPL Activated Carbons
- 12.1.6.1. Company Overview
- 12.1.6.2. Products
- 12.1.6.3. Company Financials
- 12.1.6.4. SWOT Analysis
- 12.1.7 Evoqua Water Technologies LLC
- 12.1.7.1. Company Overview
- 12.1.7.2. Products
- 12.1.7.3. Company Financials
- 12.1.7.4. SWOT Analysis
- 12.1.8 Cabot Corporation
- 12.1.8.1. Company Overview
- 12.1.8.2. Products
- 12.1.8.3. Company Financials
- 12.1.8.4. SWOT Analysis
- 12.1.9 Kureha Corporation
- 12.1.9.1. Company Overview
- 12.1.9.2. Products
- 12.1.9.3. Company Financials
- 12.1.9.4. SWOT Analysis
- 12.1.10 Ingevity
- 12.1.10.1. Company Overview
- 12.1.10.2. Products
- 12.1.10.3. Company Financials
- 12.1.10.4. SWOT Analysis
- 12.1.11 Silcarbon Aktivkohle GmbH
- 12.1.11.1. Company Overview
- 12.1.11.2. Products
- 12.1.11.3. Company Financials
- 12.1.11.4. SWOT Analysis
- 12.1.12 Haycarb (Pvt ) Ltd
- 12.1.12.1. Company Overview
- 12.1.12.2. Products
- 12.1.12.3. Company Financials
- 12.1.12.4. SWOT Analysis
- 12.1.13 Puragen Activated Carbons
- 12.1.13.1. Company Overview
- 12.1.13.2. Products
- 12.1.13.3. Company Financials
- 12.1.13.4. SWOT Analysis
- 12.1.14 Jacobi Carbons Group
- 12.1.14.1. Company Overview
- 12.1.14.2. Products
- 12.1.14.3. Company Financials
- 12.1.14.4. SWOT Analysis
- 12.1.15 Albemarle Corporation
- 12.1.15.1. Company Overview
- 12.1.15.2. Products
- 12.1.15.3. Company Financials
- 12.1.15.4. SWOT Analysis
- 12.1.16 Veolia (Veolia Water Technologies)*List Not Exhaustive
- 12.1.16.1. Company Overview
- 12.1.16.2. Products
- 12.1.16.3. Company Financials
- 12.1.16.4. SWOT Analysis
- 12.1.1 Donau Carbon GmbH
- 12.2. Market Entropy
- 12.2.1 Company's Key Areas Served
- 12.2.2 Recent Developments
- 12.3. Company Market Share Analysis 2025
- 12.3.1 Top 5 Companies Market Share Analysis
- 12.3.2 Top 3 Companies Market Share Analysis
- 12.4. List of Potential Customers
- 13. Research Methodology
List of Figures
- Figure 1: Global Activated Carbon Market Revenue Breakdown (Million, %) by Region 2025 & 2033
- Figure 2: Asia Pacific Activated Carbon Market Revenue (Million), by Product Type 2025 & 2033
- Figure 3: Asia Pacific Activated Carbon Market Revenue Share (%), by Product Type 2025 & 2033
- Figure 4: Asia Pacific Activated Carbon Market Revenue (Million), by Application 2025 & 2033
- Figure 5: Asia Pacific Activated Carbon Market Revenue Share (%), by Application 2025 & 2033
- Figure 6: Asia Pacific Activated Carbon Market Revenue (Million), by End-user Industry 2025 & 2033
- Figure 7: Asia Pacific Activated Carbon Market Revenue Share (%), by End-user Industry 2025 & 2033
- Figure 8: Asia Pacific Activated Carbon Market Revenue (Million), by Country 2025 & 2033
- Figure 9: Asia Pacific Activated Carbon Market Revenue Share (%), by Country 2025 & 2033
- Figure 10: North America Activated Carbon Market Revenue (Million), by Product Type 2025 & 2033
- Figure 11: North America Activated Carbon Market Revenue Share (%), by Product Type 2025 & 2033
- Figure 12: North America Activated Carbon Market Revenue (Million), by Application 2025 & 2033
- Figure 13: North America Activated Carbon Market Revenue Share (%), by Application 2025 & 2033
- Figure 14: North America Activated Carbon Market Revenue (Million), by End-user Industry 2025 & 2033
- Figure 15: North America Activated Carbon Market Revenue Share (%), by End-user Industry 2025 & 2033
- Figure 16: North America Activated Carbon Market Revenue (Million), by Country 2025 & 2033
- Figure 17: North America Activated Carbon Market Revenue Share (%), by Country 2025 & 2033
- Figure 18: Europe Activated Carbon Market Revenue (Million), by Product Type 2025 & 2033
- Figure 19: Europe Activated Carbon Market Revenue Share (%), by Product Type 2025 & 2033
- Figure 20: Europe Activated Carbon Market Revenue (Million), by Application 2025 & 2033
- Figure 21: Europe Activated Carbon Market Revenue Share (%), by Application 2025 & 2033
- Figure 22: Europe Activated Carbon Market Revenue (Million), by End-user Industry 2025 & 2033
- Figure 23: Europe Activated Carbon Market Revenue Share (%), by End-user Industry 2025 & 2033
- Figure 24: Europe Activated Carbon Market Revenue (Million), by Country 2025 & 2033
- Figure 25: Europe Activated Carbon Market Revenue Share (%), by Country 2025 & 2033
- Figure 26: South America Activated Carbon Market Revenue (Million), by Product Type 2025 & 2033
- Figure 27: South America Activated Carbon Market Revenue Share (%), by Product Type 2025 & 2033
- Figure 28: South America Activated Carbon Market Revenue (Million), by Application 2025 & 2033
- Figure 29: South America Activated Carbon Market Revenue Share (%), by Application 2025 & 2033
- Figure 30: South America Activated Carbon Market Revenue (Million), by End-user Industry 2025 & 2033
- Figure 31: South America Activated Carbon Market Revenue Share (%), by End-user Industry 2025 & 2033
- Figure 32: South America Activated Carbon Market Revenue (Million), by Country 2025 & 2033
- Figure 33: South America Activated Carbon Market Revenue Share (%), by Country 2025 & 2033
- Figure 34: Middle East and Africa Activated Carbon Market Revenue (Million), by Product Type 2025 & 2033
- Figure 35: Middle East and Africa Activated Carbon Market Revenue Share (%), by Product Type 2025 & 2033
- Figure 36: Middle East and Africa Activated Carbon Market Revenue (Million), by Application 2025 & 2033
- Figure 37: Middle East and Africa Activated Carbon Market Revenue Share (%), by Application 2025 & 2033
- Figure 38: Middle East and Africa Activated Carbon Market Revenue (Million), by End-user Industry 2025 & 2033
- Figure 39: Middle East and Africa Activated Carbon Market Revenue Share (%), by End-user Industry 2025 & 2033
- Figure 40: Middle East and Africa Activated Carbon Market Revenue (Million), by Country 2025 & 2033
- Figure 41: Middle East and Africa Activated Carbon Market Revenue Share (%), by Country 2025 & 2033
List of Tables
- Table 1: Global Activated Carbon Market Revenue Million Forecast, by Product Type 2020 & 2033
- Table 2: Global Activated Carbon Market Revenue Million Forecast, by Application 2020 & 2033
- Table 3: Global Activated Carbon Market Revenue Million Forecast, by End-user Industry 2020 & 2033
- Table 4: Global Activated Carbon Market Revenue Million Forecast, by Region 2020 & 2033
- Table 5: Global Activated Carbon Market Revenue Million Forecast, by Product Type 2020 & 2033
- Table 6: Global Activated Carbon Market Revenue Million Forecast, by Application 2020 & 2033
- Table 7: Global Activated Carbon Market Revenue Million Forecast, by End-user Industry 2020 & 2033
- Table 8: Global Activated Carbon Market Revenue Million Forecast, by Country 2020 & 2033
- Table 9: China Activated Carbon Market Revenue (Million) Forecast, by Application 2020 & 2033
- Table 10: India Activated Carbon Market Revenue (Million) Forecast, by Application 2020 & 2033
- Table 11: Japan Activated Carbon Market Revenue (Million) Forecast, by Application 2020 & 2033
- Table 12: South Korea Activated Carbon Market Revenue (Million) Forecast, by Application 2020 & 2033
- Table 13: Rest of Asia Pacific Activated Carbon Market Revenue (Million) Forecast, by Application 2020 & 2033
- Table 14: Global Activated Carbon Market Revenue Million Forecast, by Product Type 2020 & 2033
- Table 15: Global Activated Carbon Market Revenue Million Forecast, by Application 2020 & 2033
- Table 16: Global Activated Carbon Market Revenue Million Forecast, by End-user Industry 2020 & 2033
- Table 17: Global Activated Carbon Market Revenue Million Forecast, by Country 2020 & 2033
- Table 18: United States Activated Carbon Market Revenue (Million) Forecast, by Application 2020 & 2033
- Table 19: Canada Activated Carbon Market Revenue (Million) Forecast, by Application 2020 & 2033
- Table 20: Mexico Activated Carbon Market Revenue (Million) Forecast, by Application 2020 & 2033
- Table 21: Global Activated Carbon Market Revenue Million Forecast, by Product Type 2020 & 2033
- Table 22: Global Activated Carbon Market Revenue Million Forecast, by Application 2020 & 2033
- Table 23: Global Activated Carbon Market Revenue Million Forecast, by End-user Industry 2020 & 2033
- Table 24: Global Activated Carbon Market Revenue Million Forecast, by Country 2020 & 2033
- Table 25: Germany Activated Carbon Market Revenue (Million) Forecast, by Application 2020 & 2033
- Table 26: United Kingdom Activated Carbon Market Revenue (Million) Forecast, by Application 2020 & 2033
- Table 27: France Activated Carbon Market Revenue (Million) Forecast, by Application 2020 & 2033
- Table 28: Italy Activated Carbon Market Revenue (Million) Forecast, by Application 2020 & 2033
- Table 29: Spain Activated Carbon Market Revenue (Million) Forecast, by Application 2020 & 2033
- Table 30: Rest of Europe Activated Carbon Market Revenue (Million) Forecast, by Application 2020 & 2033
- Table 31: Global Activated Carbon Market Revenue Million Forecast, by Product Type 2020 & 2033
- Table 32: Global Activated Carbon Market Revenue Million Forecast, by Application 2020 & 2033
- Table 33: Global Activated Carbon Market Revenue Million Forecast, by End-user Industry 2020 & 2033
- Table 34: Global Activated Carbon Market Revenue Million Forecast, by Country 2020 & 2033
- Table 35: Brazil Activated Carbon Market Revenue (Million) Forecast, by Application 2020 & 2033
- Table 36: Argentina Activated Carbon Market Revenue (Million) Forecast, by Application 2020 & 2033
- Table 37: Rest of South America Activated Carbon Market Revenue (Million) Forecast, by Application 2020 & 2033
- Table 38: Global Activated Carbon Market Revenue Million Forecast, by Product Type 2020 & 2033
- Table 39: Global Activated Carbon Market Revenue Million Forecast, by Application 2020 & 2033
- Table 40: Global Activated Carbon Market Revenue Million Forecast, by End-user Industry 2020 & 2033
- Table 41: Global Activated Carbon Market Revenue Million Forecast, by Country 2020 & 2033
- Table 42: Saudi Arabia Activated Carbon Market Revenue (Million) Forecast, by Application 2020 & 2033
- Table 43: South Africa Activated Carbon Market Revenue (Million) Forecast, by Application 2020 & 2033
- Table 44: Rest of Middle East and Africa Activated Carbon Market Revenue (Million) Forecast, by Application 2020 & 2033
Frequently Asked Questions
1. What is the projected Compound Annual Growth Rate (CAGR) of the Activated Carbon Market?
The projected CAGR is approximately 5.95%.
2. Which companies are prominent players in the Activated Carbon Market?
Key companies in the market include Donau Carbon GmbH, CARBOTECH, Carbon Activated Corporation, Advanced Emissions Solutions Inc, Kuraray Co Ltd, CPL Activated Carbons, Evoqua Water Technologies LLC, Cabot Corporation, Kureha Corporation, Ingevity, Silcarbon Aktivkohle GmbH, Haycarb (Pvt ) Ltd, Puragen Activated Carbons, Jacobi Carbons Group, Albemarle Corporation, Veolia (Veolia Water Technologies)*List Not Exhaustive.
3. What are the main segments of the Activated Carbon Market?
The market segments include Product Type, Application, End-user Industry.
4. Can you provide details about the market size?
The market size is estimated to be USD 4.32 Million as of 2022.
5. What are some drivers contributing to market growth?
Conformance to Stringent Environmental Regulations in Water Treatment Applications in the United States; Augmenting Prominence for Air Pollution Control (Especially Mercury Removal).
6. What are the notable trends driving market growth?
Water Treatment Industry to Dominate the Market.
7. Are there any restraints impacting market growth?
Narrower Markets Due to Increased Costs of Some Grades of Activated Carbon; Threat of Substitutes Like Silica Gel and Development of Better Alternatives.
8. Can you provide examples of recent developments in the market?
March 2022: Cabot Corporation sold off its activated carbon unit, Norit Activated Carbon, to One Equity Partners. Following the divestiture, Norit Activated Carbon became an independent company serving its customers with a broad portfolio of activated carbon solutions through its ten production facilities in seven countries.
9. What pricing options are available for accessing the report?
Pricing options include single-user, multi-user, and enterprise licenses priced at USD 4750, USD 5250, and USD 8750 respectively.
10. Is the market size provided in terms of value or volume?
The market size is provided in terms of value, measured in Million.
11. Are there any specific market keywords associated with the report?
Yes, the market keyword associated with the report is "Activated Carbon Market," which aids in identifying and referencing the specific market segment covered.
12. How do I determine which pricing option suits my needs best?
The pricing options vary based on user requirements and access needs. Individual users may opt for single-user licenses, while businesses requiring broader access may choose multi-user or enterprise licenses for cost-effective access to the report.
13. Are there any additional resources or data provided in the Activated Carbon Market report?
While the report offers comprehensive insights, it's advisable to review the specific contents or supplementary materials provided to ascertain if additional resources or data are available.
14. How can I stay updated on further developments or reports in the Activated Carbon Market?
To stay informed about further developments, trends, and reports in the Activated Carbon Market, consider subscribing to industry newsletters, following relevant companies and organizations, or regularly checking reputable industry news sources and publications.
Methodology
Step 1 - Identification of Relevant Samples Size from Population Database


Step 2 - Approaches for Defining Global Market Size (Value, Volume* & Price*)

Note*: In applicable scenarios
Step 3 - Data Sources
Primary Research
- Web Analytics
- Survey Reports
- Research Institute
- Latest Research Reports
- Opinion Leaders
Secondary Research
- Annual Reports
- White Paper
- Latest Press Release
- Industry Association
- Paid Database
- Investor Presentations

Step 4 - Data Triangulation
Involves using different sources of information in order to increase the validity of a study
These sources are likely to be stakeholders in a program - participants, other researchers, program staff, other community members, and so on.
Then we put all data in single framework & apply various statistical tools to find out the dynamic on the market.
During the analysis stage, feedback from the stakeholder groups would be compared to determine areas of agreement as well as areas of divergence