

Key Insights
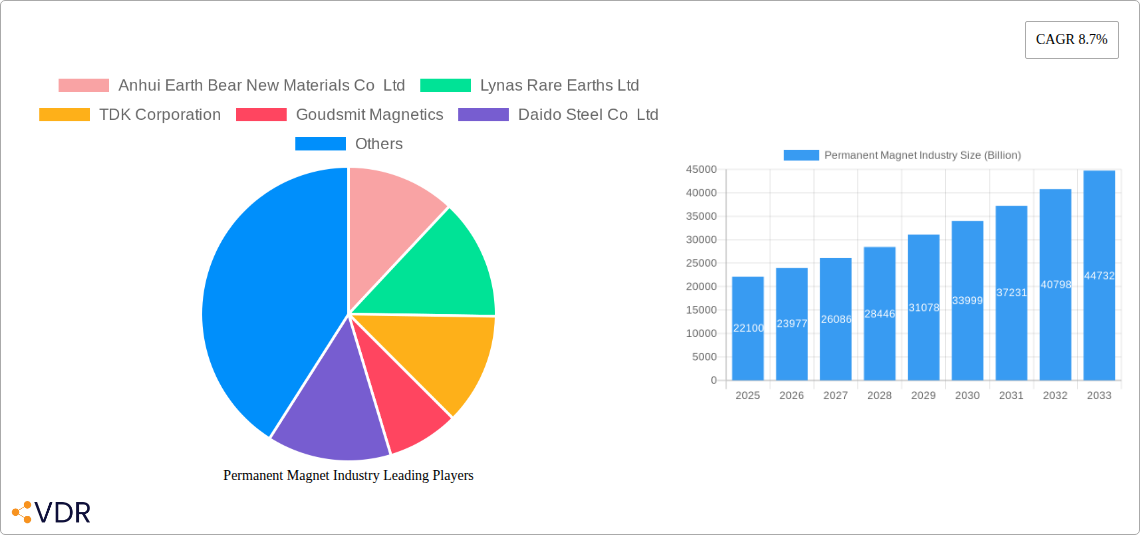
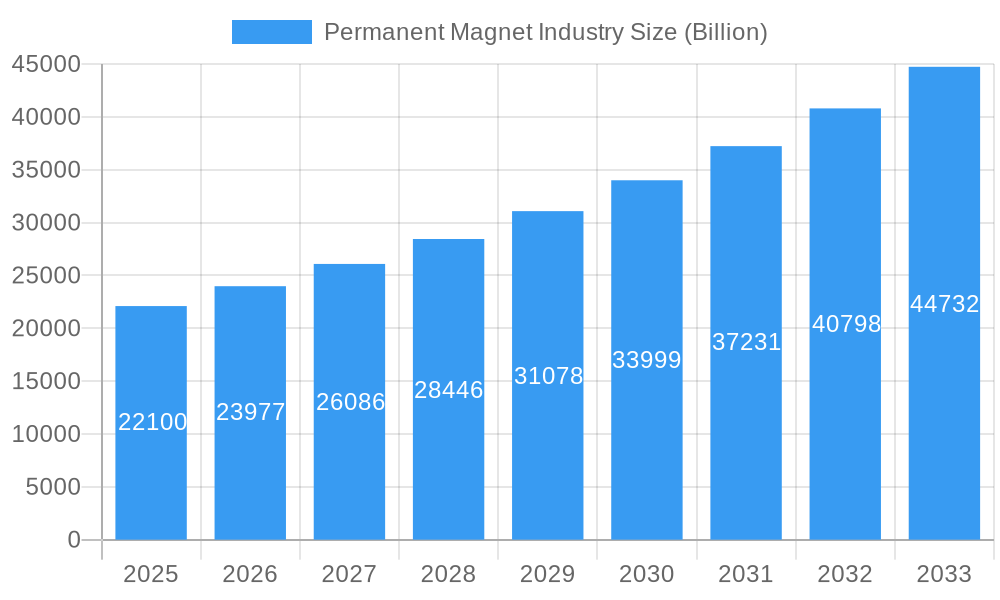
The permanent magnet industry, valued at $22.1 billion in 2025, is experiencing robust growth, projected to expand at a compound annual growth rate (CAGR) of 8.7% from 2025 to 2033. This growth is fueled by several key drivers. The burgeoning electric vehicle (EV) sector significantly boosts demand for high-performance neodymium-iron-boron magnets in electric motors, creating a substantial market opportunity. Furthermore, advancements in renewable energy technologies, particularly wind turbines and solar power systems, necessitate the use of powerful and durable permanent magnets for optimal energy conversion. Increasing automation in industrial applications and the growth of electronics, particularly in consumer electronics and data centers, further contribute to the expanding market. While material cost fluctuations and supply chain complexities pose challenges, the overall market outlook remains positive due to continuous technological innovation and the ongoing adoption of magnet-based technologies across various sectors. The market is segmented by end-user industry (automotive, electronics, industrial, power generation, and others) and material type (neodymium-iron-boron, ferrite, samarium cobalt, alnico, and others), with neodymium-iron-boron magnets currently dominating due to their superior magnetic properties. Geographical analysis reveals a strong presence across North America, Europe, and particularly Asia-Pacific, driven by significant manufacturing hubs and a high concentration of end-users in these regions. Competition is fierce, with key players including Anhui Earth Bear, Lynas Rare Earths, TDK Corporation, and others constantly striving for innovation and market share expansion.
Permanent Magnet Industry Market Size (In Billion)
The forecast period (2025-2033) anticipates sustained growth, primarily driven by the continued expansion of the EV market and the global push towards renewable energy solutions. Strategic partnerships, mergers, and acquisitions are likely to shape the competitive landscape, as companies seek to secure supply chains and expand their product portfolios. Technological advancements focusing on developing more efficient and cost-effective magnet materials, as well as improved manufacturing processes, will continue to influence the market. The industry's focus on sustainability and the responsible sourcing of rare earth materials will also play a critical role in shaping future market trends. Government regulations promoting the adoption of green technologies and incentives for electric vehicles will positively influence market growth in the coming years. Despite potential challenges, such as fluctuating raw material prices and geopolitical factors, the long-term prospects for the permanent magnet industry remain exceptionally strong.
Permanent Magnet Industry Company Market Share
Permanent Magnet Industry Market Report: 2019-2033
This comprehensive report provides an in-depth analysis of the permanent magnet industry, encompassing market dynamics, growth trends, regional analysis, product landscape, key players, and future outlook. With a study period spanning 2019-2033, a base year of 2025, and a forecast period of 2025-2033, this report is an invaluable resource for industry professionals, investors, and strategic decision-makers. The market is segmented by end-user industry (Automotive, Electronics, Industrial, Power Generation, Other End-user Industries) and material type (Neodymium-Iron-Boron, Ferrite, Samarium Cobalt, Alnico, Others). The total market size is predicted to reach xx Billion by 2033.
Permanent Magnet Industry Market Dynamics & Structure
The permanent magnet industry is characterized by a moderately concentrated market structure, with key players like TDK Corporation, Hitachi Metals Ltd, and GKN Powder Metallurgy holding significant market share. However, the emergence of new players and technological advancements are fostering increased competition. Technological innovation, particularly in materials science and manufacturing processes, is a key driver, enabling the development of higher-performance magnets with improved efficiency and reduced costs. Stringent environmental regulations related to rare earth element sourcing are reshaping the industry landscape, encouraging sustainable practices and responsible sourcing. The industry also faces competition from alternative technologies, such as electromagnets, in specific applications. Mergers and acquisitions (M&A) activity has been moderate, with strategic partnerships and investments primarily focused on expanding production capacity and securing access to critical raw materials. The automotive and electronics sectors are the primary end-users, driving market growth significantly.
- Market Concentration: Moderately concentrated, with top 5 players holding approximately xx% market share in 2024.
- Technological Innovation: Focus on improved energy efficiency, miniaturization, and cost reduction.
- Regulatory Framework: Increasing emphasis on sustainable sourcing of rare earth elements.
- Competitive Substitutes: Electromagnets, superconducting magnets.
- M&A Activity: Moderate activity, focused on capacity expansion and raw material sourcing. xx billion in deal value from 2019-2024.
- End-User Demographics: Strong growth driven by automotive (EVs) and electronics sectors.
Permanent Magnet Industry Growth Trends & Insights
The permanent magnet market experienced substantial growth during the historical period (2019-2024), driven primarily by increasing demand from the automotive and electronics sectors. The automotive industry’s transition towards electric vehicles (EVs) significantly boosted demand for high-performance Neodymium-Iron-Boron magnets. The electronics industry's continued miniaturization and performance enhancements also contributed to market expansion. Technological disruptions, such as the development of new materials with superior magnetic properties, have accelerated adoption rates. Consumer behavior shifts towards sustainable and energy-efficient products have further fueled market growth. The Compound Annual Growth Rate (CAGR) from 2019 to 2024 was approximately xx%, and the market penetration in key end-user segments has witnessed substantial growth. The forecast period (2025-2033) anticipates continued growth, albeit at a slightly moderated pace, driven by factors like increasing renewable energy adoption and the ongoing expansion of the EV market. The predicted CAGR for 2025-2033 is xx%. Challenges such as supply chain constraints and geopolitical factors will influence the market's trajectory.
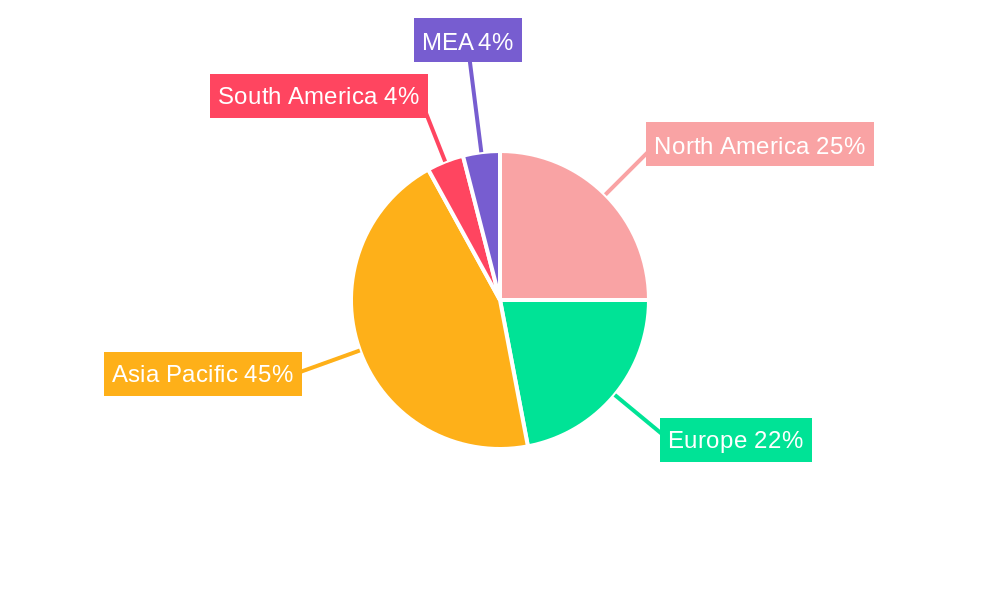
Dominant Regions, Countries, or Segments in Permanent Magnet Industry
The Asia-Pacific region dominates the permanent magnet market, owing to its large manufacturing base, substantial presence of key players, and robust growth in the electronics and automotive sectors. Within this region, China and Japan are particularly influential due to their significant rare earth element reserves and established manufacturing capabilities. The automotive segment exhibits the highest growth rate within the end-user industries, driven by the rapid adoption of EVs globally. Among material types, Neodymium-Iron-Boron magnets account for the largest market share due to their high performance characteristics.
- Key Drivers in Asia-Pacific: Strong manufacturing base, large consumer markets, abundant rare earth reserves.
- Automotive Segment Dominance: Driven by the high demand for permanent magnets in EVs and hybrid vehicles.
- Neodymium-Iron-Boron Market Leadership: Superior magnetic properties and widespread adoption in high-performance applications.
- Market Share: Asia-Pacific holds approximately xx% of the global market share in 2024, with China and Japan as major contributors.
Permanent Magnet Industry Product Landscape
The permanent magnet industry offers a wide range of products tailored to specific applications, encompassing various material types, shapes, and sizes. Recent innovations have focused on enhancing magnetic strength, improving temperature stability, and reducing manufacturing costs. Manufacturers are increasingly incorporating advanced materials and manufacturing techniques to meet the stringent performance requirements of emerging applications such as wind turbines and high-speed motors. Unique selling propositions often revolve around superior magnetic performance, customized designs, and reliable supply chains.
Key Drivers, Barriers & Challenges in Permanent Magnet Industry
Key Drivers:
- The increasing demand from the EV sector is a primary driver, pushing market expansion.
- The growth of renewable energy sources like wind power and solar power is another key growth catalyst.
- Technological advancements leading to higher-performance magnets are fueling market growth.
Challenges & Restraints:
- The dependence on rare earth elements presents supply chain vulnerabilities and price volatility.
- Geopolitical risks and trade restrictions impact sourcing and availability.
- Stringent environmental regulations require sustainable practices and increased compliance costs, potentially affecting profitability.
Emerging Opportunities in Permanent Magnet Industry
The industry witnesses emerging opportunities in several areas:
- Expansion into niche markets such as medical devices and aerospace.
- Development of high-temperature and corrosion-resistant magnets.
- Research into alternative materials to reduce reliance on rare earth elements.
- Growing demand for smaller, lighter, and more energy-efficient magnets in various applications.
Growth Accelerators in the Permanent Magnet Industry Industry
Long-term growth will be fueled by ongoing technological advancements, strategic partnerships to secure raw materials, and expansion into new geographical markets. The integration of AI and machine learning in design and manufacturing processes will enhance efficiency and create opportunities for innovation. Sustainable sourcing practices and responsible supply chain management will become increasingly crucial for long-term success.
Key Players Shaping the Permanent Magnet Industry Market
- Anhui Earth Bear New Materials Co Ltd
- Lynas Rare Earths Ltd
- TDK Corporation
- Goudsmit Magnetics
- Daido Steel Co Ltd
- Galaxymagnets
- Hitachi Metals Ltd
- Arnold Magnetic Technologies
- Shin-Etsu Chemical Co Ltd
- GKN Powder Metallurgy
Notable Milestones in Permanent Magnet Industry Sector
- September 2022: Solvay's announcement to expand rare earth operations in France signifies a strategic move to bolster the European permanent magnet value chain, impacting the wind power, electric vehicle, and electronics sectors.
- July 2022: GKN Powder Metallurgy's entry into the EV permanent magnet market with plans for significant production capacity expansion indicates a major shift in industry dynamics and anticipates strong future demand.
In-Depth Permanent Magnet Industry Market Outlook
The permanent magnet industry is poised for continued growth, driven by the sustained expansion of the electric vehicle market, the increasing adoption of renewable energy technologies, and ongoing technological advancements. Strategic partnerships, investments in research and development, and a focus on sustainable practices will be critical for capturing future market opportunities. The market is expected to show strong and stable growth over the forecast period.
Permanent Magnet Industry Segmentation
-
1. Material Type
- 1.1. Neodymium-Iron-Boron
- 1.2. Ferrite
- 1.3. Samarium Cobalt
- 1.4. Alnico
-
2. End-user Industry
- 2.1. Automotive
- 2.2. Electronics
- 2.3. Industrial
- 2.4. Power Generation
- 2.5. Other End-user Industries
Permanent Magnet Industry Segmentation By Geography
-
1. Asia Pacific
- 1.1. China
- 1.2. India
- 1.3. Japan
- 1.4. South Korea
- 1.5. Rest of Asia Pacific
-
2. North America
- 2.1. United States
- 2.2. Canada
- 2.3. Mexico
-
3. Europe
- 3.1. Germany
- 3.2. United Kingdom
- 3.3. France
- 3.4. Italy
- 3.5. Rest of Europe
-
4. South America
- 4.1. Brazil
- 4.2. Argentina
- 4.3. Rest of South America
-
5. Middle East and Africa
- 5.1. Saudi Arabia
- 5.2. South Africa
- 5.3. Rest of Middle East and Africa
Permanent Magnet Industry Regional Market Share
Geographic Coverage of Permanent Magnet Industry
Permanent Magnet Industry REPORT HIGHLIGHTS
| Aspects | Details |
|---|---|
| Study Period | 2020-2034 |
| Base Year | 2025 |
| Estimated Year | 2026 |
| Forecast Period | 2026-2034 |
| Historical Period | 2020-2025 |
| Growth Rate | CAGR of 8.7% from 2020-2034 |
| Segmentation |
|
Table of Contents
- 1. Introduction
- 1.1. Research Scope
- 1.2. Market Segmentation
- 1.3. Research Objective
- 1.4. Definitions and Assumptions
- 2. Executive Summary
- 2.1. Market Snapshot
- 3. Market Dynamics
- 3.1. Market Drivers
- 3.2. Market Restrains
- 3.3. Market Trends
- 3.4. Market Opportunities
- 4. Market Factor Analysis
- 4.1. Porters Five Forces
- 4.1.1. Bargaining Power of Suppliers
- 4.1.2. Bargaining Power of Buyers
- 4.1.3. Threat of New Entrants
- 4.1.4. Threat of Substitutes
- 4.1.5. Competitive Rivalry
- 4.2. PESTEL analysis
- 4.3. BCG Analysis
- 4.3.1. Stars (High Growth, High Market Share)
- 4.3.2. Cash Cows (Low Growth, High Market Share)
- 4.3.3. Question Mark (High Growth, Low Market Share)
- 4.3.4. Dogs (Low Growth, Low Market Share)
- 4.4. Ansoff Matrix Analysis
- 4.5. Supply Chain Analysis
- 4.6. Regulatory Landscape
- 4.7. Current Market Potential and Opportunity Assessment (TAM–SAM–SOM Framework)
- 4.8. VDR Analyst Note
- 4.1. Porters Five Forces
- 5. Market Analysis, Insights and Forecast 2021-2033
- 5.1. Market Analysis, Insights and Forecast - by Material Type
- 5.1.1. Neodymium-Iron-Boron
- 5.1.2. Ferrite
- 5.1.3. Samarium Cobalt
- 5.1.4. Alnico
- 5.2. Market Analysis, Insights and Forecast - by End-user Industry
- 5.2.1. Automotive
- 5.2.2. Electronics
- 5.2.3. Industrial
- 5.2.4. Power Generation
- 5.2.5. Other End-user Industries
- 5.3. Market Analysis, Insights and Forecast - by Region
- 5.3.1. Asia Pacific
- 5.3.2. North America
- 5.3.3. Europe
- 5.3.4. South America
- 5.3.5. Middle East and Africa
- 5.1. Market Analysis, Insights and Forecast - by Material Type
- 6. Global Permanent Magnet Industry Analysis, Insights and Forecast, 2021-2033
- 6.1. Market Analysis, Insights and Forecast - by Material Type
- 6.1.1. Neodymium-Iron-Boron
- 6.1.2. Ferrite
- 6.1.3. Samarium Cobalt
- 6.1.4. Alnico
- 6.2. Market Analysis, Insights and Forecast - by End-user Industry
- 6.2.1. Automotive
- 6.2.2. Electronics
- 6.2.3. Industrial
- 6.2.4. Power Generation
- 6.2.5. Other End-user Industries
- 6.1. Market Analysis, Insights and Forecast - by Material Type
- 7. Asia Pacific Permanent Magnet Industry Analysis, Insights and Forecast, 2021-2033
- 7.1. Market Analysis, Insights and Forecast - by Material Type
- 7.1.1. Neodymium-Iron-Boron
- 7.1.2. Ferrite
- 7.1.3. Samarium Cobalt
- 7.1.4. Alnico
- 7.2. Market Analysis, Insights and Forecast - by End-user Industry
- 7.2.1. Automotive
- 7.2.2. Electronics
- 7.2.3. Industrial
- 7.2.4. Power Generation
- 7.2.5. Other End-user Industries
- 7.1. Market Analysis, Insights and Forecast - by Material Type
- 8. North America Permanent Magnet Industry Analysis, Insights and Forecast, 2021-2033
- 8.1. Market Analysis, Insights and Forecast - by Material Type
- 8.1.1. Neodymium-Iron-Boron
- 8.1.2. Ferrite
- 8.1.3. Samarium Cobalt
- 8.1.4. Alnico
- 8.2. Market Analysis, Insights and Forecast - by End-user Industry
- 8.2.1. Automotive
- 8.2.2. Electronics
- 8.2.3. Industrial
- 8.2.4. Power Generation
- 8.2.5. Other End-user Industries
- 8.1. Market Analysis, Insights and Forecast - by Material Type
- 9. Europe Permanent Magnet Industry Analysis, Insights and Forecast, 2021-2033
- 9.1. Market Analysis, Insights and Forecast - by Material Type
- 9.1.1. Neodymium-Iron-Boron
- 9.1.2. Ferrite
- 9.1.3. Samarium Cobalt
- 9.1.4. Alnico
- 9.2. Market Analysis, Insights and Forecast - by End-user Industry
- 9.2.1. Automotive
- 9.2.2. Electronics
- 9.2.3. Industrial
- 9.2.4. Power Generation
- 9.2.5. Other End-user Industries
- 9.1. Market Analysis, Insights and Forecast - by Material Type
- 10. South America Permanent Magnet Industry Analysis, Insights and Forecast, 2021-2033
- 10.1. Market Analysis, Insights and Forecast - by Material Type
- 10.1.1. Neodymium-Iron-Boron
- 10.1.2. Ferrite
- 10.1.3. Samarium Cobalt
- 10.1.4. Alnico
- 10.2. Market Analysis, Insights and Forecast - by End-user Industry
- 10.2.1. Automotive
- 10.2.2. Electronics
- 10.2.3. Industrial
- 10.2.4. Power Generation
- 10.2.5. Other End-user Industries
- 10.1. Market Analysis, Insights and Forecast - by Material Type
- 11. Middle East and Africa Permanent Magnet Industry Analysis, Insights and Forecast, 2021-2033
- 11.1. Market Analysis, Insights and Forecast - by Material Type
- 11.1.1. Neodymium-Iron-Boron
- 11.1.2. Ferrite
- 11.1.3. Samarium Cobalt
- 11.1.4. Alnico
- 11.2. Market Analysis, Insights and Forecast - by End-user Industry
- 11.2.1. Automotive
- 11.2.2. Electronics
- 11.2.3. Industrial
- 11.2.4. Power Generation
- 11.2.5. Other End-user Industries
- 11.1. Market Analysis, Insights and Forecast - by Material Type
- 12. Competitive Analysis
- 12.1. Company Profiles
- 12.1.1 Anhui Earth Bear New Materials Co Ltd
- 12.1.1.1. Company Overview
- 12.1.1.2. Products
- 12.1.1.3. Company Financials
- 12.1.1.4. SWOT Analysis
- 12.1.2 Lynas Rare Earths Ltd
- 12.1.2.1. Company Overview
- 12.1.2.2. Products
- 12.1.2.3. Company Financials
- 12.1.2.4. SWOT Analysis
- 12.1.3 TDK Corporation
- 12.1.3.1. Company Overview
- 12.1.3.2. Products
- 12.1.3.3. Company Financials
- 12.1.3.4. SWOT Analysis
- 12.1.4 Goudsmit Magnetics
- 12.1.4.1. Company Overview
- 12.1.4.2. Products
- 12.1.4.3. Company Financials
- 12.1.4.4. SWOT Analysis
- 12.1.5 Daido Steel Co Ltd
- 12.1.5.1. Company Overview
- 12.1.5.2. Products
- 12.1.5.3. Company Financials
- 12.1.5.4. SWOT Analysis
- 12.1.6 Galaxymagnets
- 12.1.6.1. Company Overview
- 12.1.6.2. Products
- 12.1.6.3. Company Financials
- 12.1.6.4. SWOT Analysis
- 12.1.7 Hitachi Metals Ltd
- 12.1.7.1. Company Overview
- 12.1.7.2. Products
- 12.1.7.3. Company Financials
- 12.1.7.4. SWOT Analysis
- 12.1.8 Arnold Magnetic Technologies
- 12.1.8.1. Company Overview
- 12.1.8.2. Products
- 12.1.8.3. Company Financials
- 12.1.8.4. SWOT Analysis
- 12.1.9 Shin-Etsu Chemical Co Ltd
- 12.1.9.1. Company Overview
- 12.1.9.2. Products
- 12.1.9.3. Company Financials
- 12.1.9.4. SWOT Analysis
- 12.1.10 GKN Powder Metallurgy
- 12.1.10.1. Company Overview
- 12.1.10.2. Products
- 12.1.10.3. Company Financials
- 12.1.10.4. SWOT Analysis
- 12.1.1 Anhui Earth Bear New Materials Co Ltd
- 12.2. Market Entropy
- 12.2.1 Company's Key Areas Served
- 12.2.2 Recent Developments
- 12.3. Company Market Share Analysis 2025
- 12.3.1 Top 5 Companies Market Share Analysis
- 12.3.2 Top 3 Companies Market Share Analysis
- 12.4. List of Potential Customers
- 13. Research Methodology
List of Figures
- Figure 1: Global Permanent Magnet Industry Revenue Breakdown (Billion, %) by Region 2025 & 2033
- Figure 2: Global Permanent Magnet Industry Volume Breakdown (K Tons, %) by Region 2025 & 2033
- Figure 3: Asia Pacific Permanent Magnet Industry Revenue (Billion), by Material Type 2025 & 2033
- Figure 4: Asia Pacific Permanent Magnet Industry Volume (K Tons), by Material Type 2025 & 2033
- Figure 5: Asia Pacific Permanent Magnet Industry Revenue Share (%), by Material Type 2025 & 2033
- Figure 6: Asia Pacific Permanent Magnet Industry Volume Share (%), by Material Type 2025 & 2033
- Figure 7: Asia Pacific Permanent Magnet Industry Revenue (Billion), by End-user Industry 2025 & 2033
- Figure 8: Asia Pacific Permanent Magnet Industry Volume (K Tons), by End-user Industry 2025 & 2033
- Figure 9: Asia Pacific Permanent Magnet Industry Revenue Share (%), by End-user Industry 2025 & 2033
- Figure 10: Asia Pacific Permanent Magnet Industry Volume Share (%), by End-user Industry 2025 & 2033
- Figure 11: Asia Pacific Permanent Magnet Industry Revenue (Billion), by Country 2025 & 2033
- Figure 12: Asia Pacific Permanent Magnet Industry Volume (K Tons), by Country 2025 & 2033
- Figure 13: Asia Pacific Permanent Magnet Industry Revenue Share (%), by Country 2025 & 2033
- Figure 14: Asia Pacific Permanent Magnet Industry Volume Share (%), by Country 2025 & 2033
- Figure 15: North America Permanent Magnet Industry Revenue (Billion), by Material Type 2025 & 2033
- Figure 16: North America Permanent Magnet Industry Volume (K Tons), by Material Type 2025 & 2033
- Figure 17: North America Permanent Magnet Industry Revenue Share (%), by Material Type 2025 & 2033
- Figure 18: North America Permanent Magnet Industry Volume Share (%), by Material Type 2025 & 2033
- Figure 19: North America Permanent Magnet Industry Revenue (Billion), by End-user Industry 2025 & 2033
- Figure 20: North America Permanent Magnet Industry Volume (K Tons), by End-user Industry 2025 & 2033
- Figure 21: North America Permanent Magnet Industry Revenue Share (%), by End-user Industry 2025 & 2033
- Figure 22: North America Permanent Magnet Industry Volume Share (%), by End-user Industry 2025 & 2033
- Figure 23: North America Permanent Magnet Industry Revenue (Billion), by Country 2025 & 2033
- Figure 24: North America Permanent Magnet Industry Volume (K Tons), by Country 2025 & 2033
- Figure 25: North America Permanent Magnet Industry Revenue Share (%), by Country 2025 & 2033
- Figure 26: North America Permanent Magnet Industry Volume Share (%), by Country 2025 & 2033
- Figure 27: Europe Permanent Magnet Industry Revenue (Billion), by Material Type 2025 & 2033
- Figure 28: Europe Permanent Magnet Industry Volume (K Tons), by Material Type 2025 & 2033
- Figure 29: Europe Permanent Magnet Industry Revenue Share (%), by Material Type 2025 & 2033
- Figure 30: Europe Permanent Magnet Industry Volume Share (%), by Material Type 2025 & 2033
- Figure 31: Europe Permanent Magnet Industry Revenue (Billion), by End-user Industry 2025 & 2033
- Figure 32: Europe Permanent Magnet Industry Volume (K Tons), by End-user Industry 2025 & 2033
- Figure 33: Europe Permanent Magnet Industry Revenue Share (%), by End-user Industry 2025 & 2033
- Figure 34: Europe Permanent Magnet Industry Volume Share (%), by End-user Industry 2025 & 2033
- Figure 35: Europe Permanent Magnet Industry Revenue (Billion), by Country 2025 & 2033
- Figure 36: Europe Permanent Magnet Industry Volume (K Tons), by Country 2025 & 2033
- Figure 37: Europe Permanent Magnet Industry Revenue Share (%), by Country 2025 & 2033
- Figure 38: Europe Permanent Magnet Industry Volume Share (%), by Country 2025 & 2033
- Figure 39: South America Permanent Magnet Industry Revenue (Billion), by Material Type 2025 & 2033
- Figure 40: South America Permanent Magnet Industry Volume (K Tons), by Material Type 2025 & 2033
- Figure 41: South America Permanent Magnet Industry Revenue Share (%), by Material Type 2025 & 2033
- Figure 42: South America Permanent Magnet Industry Volume Share (%), by Material Type 2025 & 2033
- Figure 43: South America Permanent Magnet Industry Revenue (Billion), by End-user Industry 2025 & 2033
- Figure 44: South America Permanent Magnet Industry Volume (K Tons), by End-user Industry 2025 & 2033
- Figure 45: South America Permanent Magnet Industry Revenue Share (%), by End-user Industry 2025 & 2033
- Figure 46: South America Permanent Magnet Industry Volume Share (%), by End-user Industry 2025 & 2033
- Figure 47: South America Permanent Magnet Industry Revenue (Billion), by Country 2025 & 2033
- Figure 48: South America Permanent Magnet Industry Volume (K Tons), by Country 2025 & 2033
- Figure 49: South America Permanent Magnet Industry Revenue Share (%), by Country 2025 & 2033
- Figure 50: South America Permanent Magnet Industry Volume Share (%), by Country 2025 & 2033
- Figure 51: Middle East and Africa Permanent Magnet Industry Revenue (Billion), by Material Type 2025 & 2033
- Figure 52: Middle East and Africa Permanent Magnet Industry Volume (K Tons), by Material Type 2025 & 2033
- Figure 53: Middle East and Africa Permanent Magnet Industry Revenue Share (%), by Material Type 2025 & 2033
- Figure 54: Middle East and Africa Permanent Magnet Industry Volume Share (%), by Material Type 2025 & 2033
- Figure 55: Middle East and Africa Permanent Magnet Industry Revenue (Billion), by End-user Industry 2025 & 2033
- Figure 56: Middle East and Africa Permanent Magnet Industry Volume (K Tons), by End-user Industry 2025 & 2033
- Figure 57: Middle East and Africa Permanent Magnet Industry Revenue Share (%), by End-user Industry 2025 & 2033
- Figure 58: Middle East and Africa Permanent Magnet Industry Volume Share (%), by End-user Industry 2025 & 2033
- Figure 59: Middle East and Africa Permanent Magnet Industry Revenue (Billion), by Country 2025 & 2033
- Figure 60: Middle East and Africa Permanent Magnet Industry Volume (K Tons), by Country 2025 & 2033
- Figure 61: Middle East and Africa Permanent Magnet Industry Revenue Share (%), by Country 2025 & 2033
- Figure 62: Middle East and Africa Permanent Magnet Industry Volume Share (%), by Country 2025 & 2033
List of Tables
- Table 1: Global Permanent Magnet Industry Revenue Billion Forecast, by Material Type 2020 & 2033
- Table 2: Global Permanent Magnet Industry Volume K Tons Forecast, by Material Type 2020 & 2033
- Table 3: Global Permanent Magnet Industry Revenue Billion Forecast, by End-user Industry 2020 & 2033
- Table 4: Global Permanent Magnet Industry Volume K Tons Forecast, by End-user Industry 2020 & 2033
- Table 5: Global Permanent Magnet Industry Revenue Billion Forecast, by Region 2020 & 2033
- Table 6: Global Permanent Magnet Industry Volume K Tons Forecast, by Region 2020 & 2033
- Table 7: Global Permanent Magnet Industry Revenue Billion Forecast, by Material Type 2020 & 2033
- Table 8: Global Permanent Magnet Industry Volume K Tons Forecast, by Material Type 2020 & 2033
- Table 9: Global Permanent Magnet Industry Revenue Billion Forecast, by End-user Industry 2020 & 2033
- Table 10: Global Permanent Magnet Industry Volume K Tons Forecast, by End-user Industry 2020 & 2033
- Table 11: Global Permanent Magnet Industry Revenue Billion Forecast, by Country 2020 & 2033
- Table 12: Global Permanent Magnet Industry Volume K Tons Forecast, by Country 2020 & 2033
- Table 13: China Permanent Magnet Industry Revenue (Billion) Forecast, by Application 2020 & 2033
- Table 14: China Permanent Magnet Industry Volume (K Tons) Forecast, by Application 2020 & 2033
- Table 15: India Permanent Magnet Industry Revenue (Billion) Forecast, by Application 2020 & 2033
- Table 16: India Permanent Magnet Industry Volume (K Tons) Forecast, by Application 2020 & 2033
- Table 17: Japan Permanent Magnet Industry Revenue (Billion) Forecast, by Application 2020 & 2033
- Table 18: Japan Permanent Magnet Industry Volume (K Tons) Forecast, by Application 2020 & 2033
- Table 19: South Korea Permanent Magnet Industry Revenue (Billion) Forecast, by Application 2020 & 2033
- Table 20: South Korea Permanent Magnet Industry Volume (K Tons) Forecast, by Application 2020 & 2033
- Table 21: Rest of Asia Pacific Permanent Magnet Industry Revenue (Billion) Forecast, by Application 2020 & 2033
- Table 22: Rest of Asia Pacific Permanent Magnet Industry Volume (K Tons) Forecast, by Application 2020 & 2033
- Table 23: Global Permanent Magnet Industry Revenue Billion Forecast, by Material Type 2020 & 2033
- Table 24: Global Permanent Magnet Industry Volume K Tons Forecast, by Material Type 2020 & 2033
- Table 25: Global Permanent Magnet Industry Revenue Billion Forecast, by End-user Industry 2020 & 2033
- Table 26: Global Permanent Magnet Industry Volume K Tons Forecast, by End-user Industry 2020 & 2033
- Table 27: Global Permanent Magnet Industry Revenue Billion Forecast, by Country 2020 & 2033
- Table 28: Global Permanent Magnet Industry Volume K Tons Forecast, by Country 2020 & 2033
- Table 29: United States Permanent Magnet Industry Revenue (Billion) Forecast, by Application 2020 & 2033
- Table 30: United States Permanent Magnet Industry Volume (K Tons) Forecast, by Application 2020 & 2033
- Table 31: Canada Permanent Magnet Industry Revenue (Billion) Forecast, by Application 2020 & 2033
- Table 32: Canada Permanent Magnet Industry Volume (K Tons) Forecast, by Application 2020 & 2033
- Table 33: Mexico Permanent Magnet Industry Revenue (Billion) Forecast, by Application 2020 & 2033
- Table 34: Mexico Permanent Magnet Industry Volume (K Tons) Forecast, by Application 2020 & 2033
- Table 35: Global Permanent Magnet Industry Revenue Billion Forecast, by Material Type 2020 & 2033
- Table 36: Global Permanent Magnet Industry Volume K Tons Forecast, by Material Type 2020 & 2033
- Table 37: Global Permanent Magnet Industry Revenue Billion Forecast, by End-user Industry 2020 & 2033
- Table 38: Global Permanent Magnet Industry Volume K Tons Forecast, by End-user Industry 2020 & 2033
- Table 39: Global Permanent Magnet Industry Revenue Billion Forecast, by Country 2020 & 2033
- Table 40: Global Permanent Magnet Industry Volume K Tons Forecast, by Country 2020 & 2033
- Table 41: Germany Permanent Magnet Industry Revenue (Billion) Forecast, by Application 2020 & 2033
- Table 42: Germany Permanent Magnet Industry Volume (K Tons) Forecast, by Application 2020 & 2033
- Table 43: United Kingdom Permanent Magnet Industry Revenue (Billion) Forecast, by Application 2020 & 2033
- Table 44: United Kingdom Permanent Magnet Industry Volume (K Tons) Forecast, by Application 2020 & 2033
- Table 45: France Permanent Magnet Industry Revenue (Billion) Forecast, by Application 2020 & 2033
- Table 46: France Permanent Magnet Industry Volume (K Tons) Forecast, by Application 2020 & 2033
- Table 47: Italy Permanent Magnet Industry Revenue (Billion) Forecast, by Application 2020 & 2033
- Table 48: Italy Permanent Magnet Industry Volume (K Tons) Forecast, by Application 2020 & 2033
- Table 49: Rest of Europe Permanent Magnet Industry Revenue (Billion) Forecast, by Application 2020 & 2033
- Table 50: Rest of Europe Permanent Magnet Industry Volume (K Tons) Forecast, by Application 2020 & 2033
- Table 51: Global Permanent Magnet Industry Revenue Billion Forecast, by Material Type 2020 & 2033
- Table 52: Global Permanent Magnet Industry Volume K Tons Forecast, by Material Type 2020 & 2033
- Table 53: Global Permanent Magnet Industry Revenue Billion Forecast, by End-user Industry 2020 & 2033
- Table 54: Global Permanent Magnet Industry Volume K Tons Forecast, by End-user Industry 2020 & 2033
- Table 55: Global Permanent Magnet Industry Revenue Billion Forecast, by Country 2020 & 2033
- Table 56: Global Permanent Magnet Industry Volume K Tons Forecast, by Country 2020 & 2033
- Table 57: Brazil Permanent Magnet Industry Revenue (Billion) Forecast, by Application 2020 & 2033
- Table 58: Brazil Permanent Magnet Industry Volume (K Tons) Forecast, by Application 2020 & 2033
- Table 59: Argentina Permanent Magnet Industry Revenue (Billion) Forecast, by Application 2020 & 2033
- Table 60: Argentina Permanent Magnet Industry Volume (K Tons) Forecast, by Application 2020 & 2033
- Table 61: Rest of South America Permanent Magnet Industry Revenue (Billion) Forecast, by Application 2020 & 2033
- Table 62: Rest of South America Permanent Magnet Industry Volume (K Tons) Forecast, by Application 2020 & 2033
- Table 63: Global Permanent Magnet Industry Revenue Billion Forecast, by Material Type 2020 & 2033
- Table 64: Global Permanent Magnet Industry Volume K Tons Forecast, by Material Type 2020 & 2033
- Table 65: Global Permanent Magnet Industry Revenue Billion Forecast, by End-user Industry 2020 & 2033
- Table 66: Global Permanent Magnet Industry Volume K Tons Forecast, by End-user Industry 2020 & 2033
- Table 67: Global Permanent Magnet Industry Revenue Billion Forecast, by Country 2020 & 2033
- Table 68: Global Permanent Magnet Industry Volume K Tons Forecast, by Country 2020 & 2033
- Table 69: Saudi Arabia Permanent Magnet Industry Revenue (Billion) Forecast, by Application 2020 & 2033
- Table 70: Saudi Arabia Permanent Magnet Industry Volume (K Tons) Forecast, by Application 2020 & 2033
- Table 71: South Africa Permanent Magnet Industry Revenue (Billion) Forecast, by Application 2020 & 2033
- Table 72: South Africa Permanent Magnet Industry Volume (K Tons) Forecast, by Application 2020 & 2033
- Table 73: Rest of Middle East and Africa Permanent Magnet Industry Revenue (Billion) Forecast, by Application 2020 & 2033
- Table 74: Rest of Middle East and Africa Permanent Magnet Industry Volume (K Tons) Forecast, by Application 2020 & 2033
Frequently Asked Questions
1. What is the projected Compound Annual Growth Rate (CAGR) of the Permanent Magnet Industry?
The projected CAGR is approximately 8.7%.
2. Which companies are prominent players in the Permanent Magnet Industry?
Key companies in the market include Anhui Earth Bear New Materials Co Ltd, Lynas Rare Earths Ltd, TDK Corporation, Goudsmit Magnetics, Daido Steel Co Ltd, Galaxymagnets, Hitachi Metals Ltd, Arnold Magnetic Technologies, Shin-Etsu Chemical Co Ltd, GKN Powder Metallurgy.
3. What are the main segments of the Permanent Magnet Industry?
The market segments include Material Type, End-user Industry.
4. Can you provide details about the market size?
The market size is estimated to be USD 22.1 Billion as of 2022.
5. What are some drivers contributing to market growth?
Increasing Electro-mechanical Applications; Other Drivers.
6. What are the notable trends driving market growth?
Growing Demand from Electronics Industry.
7. Are there any restraints impacting market growth?
Competition from Substitutes; Other Restraints.
8. Can you provide examples of recent developments in the market?
September 2022: Solvay announced plans to expand its rare earths operations in La Rochelle, France to enter the value chain for rare earths permanent magnets in Europe and serve customers in the wind power, electric vehicles, and electronics markets.
9. What pricing options are available for accessing the report?
Pricing options include single-user, multi-user, and enterprise licenses priced at USD 4750, USD 5250, and USD 8750 respectively.
10. Is the market size provided in terms of value or volume?
The market size is provided in terms of value, measured in Billion and volume, measured in K Tons.
11. Are there any specific market keywords associated with the report?
Yes, the market keyword associated with the report is "Permanent Magnet Industry," which aids in identifying and referencing the specific market segment covered.
12. How do I determine which pricing option suits my needs best?
The pricing options vary based on user requirements and access needs. Individual users may opt for single-user licenses, while businesses requiring broader access may choose multi-user or enterprise licenses for cost-effective access to the report.
13. Are there any additional resources or data provided in the Permanent Magnet Industry report?
While the report offers comprehensive insights, it's advisable to review the specific contents or supplementary materials provided to ascertain if additional resources or data are available.
14. How can I stay updated on further developments or reports in the Permanent Magnet Industry?
To stay informed about further developments, trends, and reports in the Permanent Magnet Industry, consider subscribing to industry newsletters, following relevant companies and organizations, or regularly checking reputable industry news sources and publications.
Methodology
Step 1 - Identification of Relevant Samples Size from Population Database


Step 2 - Approaches for Defining Global Market Size (Value, Volume* & Price*)

Note*: In applicable scenarios
Step 3 - Data Sources
Primary Research
- Web Analytics
- Survey Reports
- Research Institute
- Latest Research Reports
- Opinion Leaders
Secondary Research
- Annual Reports
- White Paper
- Latest Press Release
- Industry Association
- Paid Database
- Investor Presentations

Step 4 - Data Triangulation
Involves using different sources of information in order to increase the validity of a study
These sources are likely to be stakeholders in a program - participants, other researchers, program staff, other community members, and so on.
Then we put all data in single framework & apply various statistical tools to find out the dynamic on the market.
During the analysis stage, feedback from the stakeholder groups would be compared to determine areas of agreement as well as areas of divergence