

Key Insights
The global bioethanol market, valued at approximately $66.99 billion in 2025, is projected for substantial growth. It is expected to exhibit a Compound Annual Growth Rate (CAGR) of 11.7% from 2025 to 2033. This expansion is propelled by escalating demand for renewable and sustainable fuels, driven by stringent government regulations targeting carbon emission reduction and enhanced energy independence. The automotive and transportation sector is a primary driver, with widespread bioethanol blending mandates significantly increasing market adoption. Growing awareness of bioethanol's environmental advantages over fossil fuels further fuels this growth. Additionally, the diversification of feedstock sources beyond conventional sugarcane and corn to include wheat and other alternatives bolsters market resilience and scalability. Innovative advancements in bioethanol production technology are enhancing efficiency and reducing costs, contributing to market expansion. While the automotive and transportation sector currently leads, significant application segments also exist in the food and beverage, pharmaceutical, and cosmetics industries.
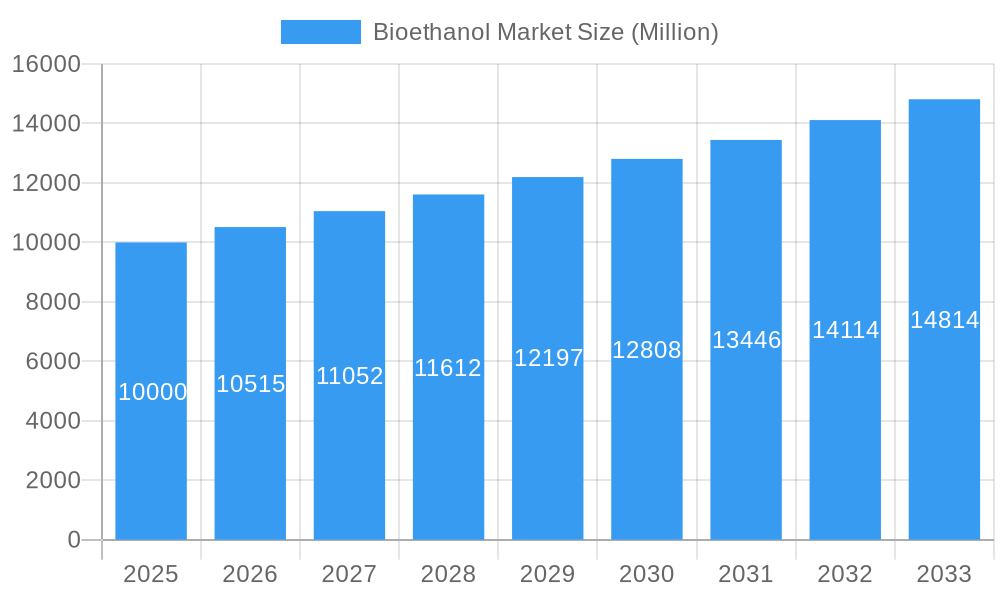
Bioethanol Market Market Size (In Billion)
Potential market growth could be moderated by several factors. Fluctuations in feedstock prices, influenced by agricultural yields and global commodity markets, can impact bioethanol production costs and profitability. Competition from alternative renewable energy sources, including biodiesel and electricity from solar and wind power, presents a challenge. Furthermore, land-use considerations for feedstock cultivation and their potential impact on food security necessitate careful management and sustainable practices. Despite these considerations, the bioethanol market's outlook remains robust, supported by ongoing innovation and favorable government policies. Regional growth is anticipated to vary, with established markets in North America and Europe continuing their expansion, while emerging markets in Asia-Pacific are poised for significant growth due to rising energy demands and increasing governmental initiatives.
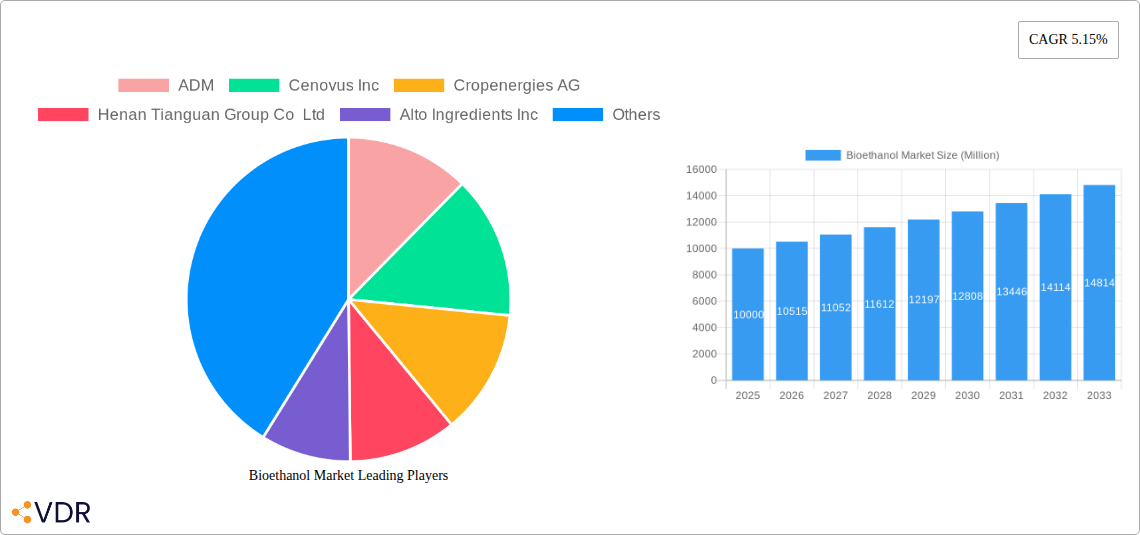
Bioethanol Market Company Market Share
Bioethanol Market: A Comprehensive Report (2019-2033)
This in-depth report provides a comprehensive analysis of the global bioethanol market, encompassing market dynamics, growth trends, regional dominance, product landscape, key players, and future outlook. The study period covers 2019-2033, with 2025 as the base and estimated year. The report is essential for industry professionals, investors, and anyone seeking a complete understanding of this dynamic sector. The total market size in 2025 is estimated at xx Million units, and is projected to reach xx Million units by 2033.
Bioethanol Market Dynamics & Structure
The bioethanol market is characterized by moderate concentration, with several major players holding significant market share. Technological innovation, driven by the need for sustainable alternatives to fossil fuels and the increasing demand for bio-based products, is a key driver. Stringent environmental regulations worldwide are further propelling market growth, while the presence of competing substitutes, such as biodiesel and other renewable fuels, presents a challenge. The market is witnessing substantial M&A activity, reflecting strategic expansion and consolidation.
- Market Concentration: Moderately concentrated, with the top 5 players holding approximately xx% of the market share in 2025.
- Technological Innovation: Focus on improving ethanol yield from diverse feedstocks, cellulosic ethanol production, and advanced biofuel technologies.
- Regulatory Framework: Government policies promoting renewable energy and biofuel mandates are major growth drivers, varying across regions.
- Competitive Substitutes: Biodiesel, other renewable fuels, and gasoline compete for market share.
- End-User Demographics: Primarily automotive and transportation, with growing demand from food and beverage, pharmaceuticals, and cosmetics sectors.
- M&A Trends: An average of xx M&A deals per year observed between 2019-2024, indicating considerable consolidation and expansion within the sector.
Bioethanol Market Growth Trends & Insights
The bioethanol market exhibits consistent growth, driven by the increasing global demand for renewable energy sources and the stringent emission reduction targets set by various governments. The market size experienced a CAGR of xx% during the historical period (2019-2024) and is projected to maintain a CAGR of xx% during the forecast period (2025-2033). Technological advancements, particularly in cellulosic ethanol production, are expected to significantly boost market growth. Consumer preference for sustainable products is also contributing to the market's upward trajectory. Market penetration is expected to increase from xx% in 2025 to xx% by 2033. Specific factors such as fluctuations in feedstock prices and government support schemes influence market growth rates.
Dominant Regions, Countries, or Segments in Bioethanol Market
The automotive and transportation segment holds the largest market share due to its extensive use as a gasoline additive and fuel blend. Geographically, Brazil and the United States are currently the dominant regions, primarily due to their extensive sugarcane and corn cultivation. However, other regions are showing significant growth potential, driven by supportive government policies and increasing environmental concerns.
- Feedstock Type: Corn currently dominates, followed by sugarcane. However, the adoption of other feedstocks like wheat and other lignocellulosic biomass is gradually increasing, fueled by research into efficient conversion technologies.
- Application: Automotive and transportation is the leading application area. The Food and Beverage sector shows steady growth driven by the increasing demand for bio-based ingredients.
- Key Drivers: Government incentives, increasing demand for renewable fuels, stringent emission regulations, and the availability of cost-effective feedstocks are key regional drivers.
Bioethanol Market Product Landscape
The bioethanol market features various products catering to diverse applications. Innovations focus on improving ethanol yield, reducing production costs, and enhancing its performance characteristics, particularly in its usage as a fuel additive and a feedstock for other biochemical products. Unique selling propositions include improved engine efficiency, reduced greenhouse gas emissions compared to fossil fuels, and sustainability aspects. Technological advancements such as advanced fermentation processes and enzyme technology are pivotal in enhancing productivity and reducing environmental impact.
Key Drivers, Barriers & Challenges in Bioethanol Market
Key Drivers:
- Growing demand for renewable fuels to combat climate change.
- Favorable government policies and subsidies promoting biofuel adoption.
- Technological advancements leading to improved efficiency and cost reduction.
Challenges & Restraints:
- Fluctuations in feedstock prices affecting profitability.
- Competition from fossil fuels and other renewable alternatives.
- Land use concerns and potential negative impacts on food security. xx% of the land dedicated to bioethanol production in 2024 experienced yield reduction due to xx factors.
Emerging Opportunities in Bioethanol Market
Emerging opportunities include the growing demand for sustainable aviation fuel (SAF), the expansion into new applications in the chemicals and plastics industry using bio-based ethylene, and the development of advanced biofuels from cellulosic biomass. These present exciting avenues for innovation and market expansion, particularly for new entrants who can bring innovative technologies and sustainability-oriented solutions to the market.
Growth Accelerators in the Bioethanol Market Industry
Technological advancements, particularly in cellulosic ethanol production, and the expansion of strategic partnerships among key players and researchers are pivotal growth accelerators. This focus on developing efficient and cost-effective production methods and securing access to sustainable feedstock sources will significantly boost the bioethanol market in the coming years. Additionally, successful government initiatives for sustainable fuel mandates across different countries play a vital role.
Key Players Shaping the Bioethanol Market Market
- ADM
- Cenovus Inc
- Cropenergies AG
- Henan Tianguan Group Co Ltd
- Alto Ingredients Inc
- Green Plains Inc
- Suncor Energy Inc
- Valero
- Ethanol Technologies
- Verbio Vereinigte Bioenergie AG
- Abengoa
- Granbio Investimentos SA
- Sekab
- Blue Bio Fuels Inc
- Lantmannen
- Tereos
- Cristalco
- Poet LLC
- Jilin Fuel Ethanol Co Ltd
- Raizen
- KWST
Notable Milestones in Bioethanol Market Sector
- May 2022: Blue Biofuels Inc. announced progress on its fifth-generation Cellulose-to-Sugar machine, signaling advancements in cellulosic ethanol production.
- September 2022: CropEnergies AG's investment in Syclus BV indicates a shift towards bio-based chemical production from renewable ethanol.
- January 2023: The joint venture between United Airlines, Tallgrass, Green Plains Inc., and Blue Blade Energy for SAF development highlights the growing importance of bioethanol in the aviation sector.
In-Depth Bioethanol Market Market Outlook
The bioethanol market is poised for significant growth, driven by the increasing demand for sustainable energy and the continuous technological advancements in production processes. Strategic partnerships, focused R&D, and the expansion into new applications, particularly SAF, promise a robust future for the sector. The market's potential is immense, particularly in regions with supportive government policies and readily available feedstock. The focus on sustainable practices and reduced carbon footprint will further enhance market prospects.
Bioethanol Market Segmentation
-
1. Feedstock Type
- 1.1. Sugarcane
- 1.2. Corn
- 1.3. Wheat
- 1.4. Other Feedstock Types
-
2. Application
- 2.1. Automotive and Transportation
- 2.2. Food and Beverage
- 2.3. Pharmaceutical
- 2.4. Cosmetics and Personal Care
- 2.5. Other Applications
Bioethanol Market Segmentation By Geography
-
1. Asia Pacific
- 1.1. China
- 1.2. India
- 1.3. Japan
- 1.4. South Korea
- 1.5. Rest of Asia Pacific
-
2. North America
- 2.1. United States
- 2.2. Canada
- 2.3. Mexico
-
3. Europe
- 3.1. Germany
- 3.2. United Kingdom
- 3.3. France
- 3.4. Italy
- 3.5. Rest of Europe
-
4. South America
- 4.1. Brazil
- 4.2. Argentina
- 4.3. Rest of South America
-
5. Middle East and Africa
- 5.1. Saudi Arabia
- 5.2. South Africa
- 5.3. Rest of Middle East and Africa
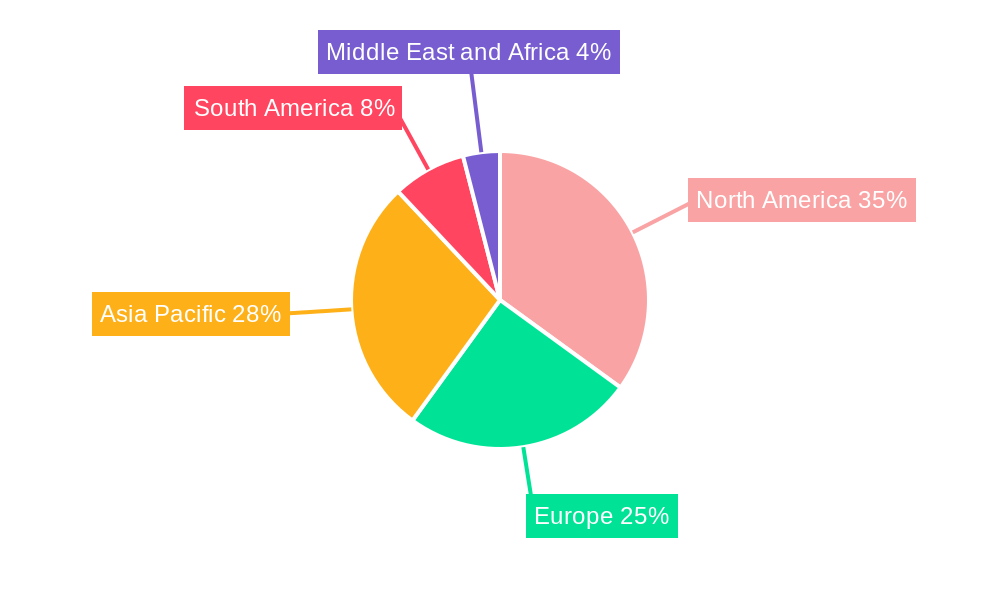
Bioethanol Market Regional Market Share
Geographic Coverage of Bioethanol Market
Bioethanol Market REPORT HIGHLIGHTS
| Aspects | Details |
|---|---|
| Study Period | 2020-2034 |
| Base Year | 2025 |
| Estimated Year | 2026 |
| Forecast Period | 2026-2034 |
| Historical Period | 2020-2025 |
| Growth Rate | CAGR of 11.7% from 2020-2034 |
| Segmentation |
|
Table of Contents
- 1. Introduction
- 1.1. Research Scope
- 1.2. Market Segmentation
- 1.3. Research Objective
- 1.4. Definitions and Assumptions
- 2. Executive Summary
- 2.1. Market Snapshot
- 3. Market Dynamics
- 3.1. Market Drivers
- 3.2. Market Restrains
- 3.3. Market Trends
- 3.4. Market Opportunities
- 4. Market Factor Analysis
- 4.1. Porters Five Forces
- 4.1.1. Bargaining Power of Suppliers
- 4.1.2. Bargaining Power of Buyers
- 4.1.3. Threat of New Entrants
- 4.1.4. Threat of Substitutes
- 4.1.5. Competitive Rivalry
- 4.2. PESTEL analysis
- 4.3. BCG Analysis
- 4.3.1. Stars (High Growth, High Market Share)
- 4.3.2. Cash Cows (Low Growth, High Market Share)
- 4.3.3. Question Mark (High Growth, Low Market Share)
- 4.3.4. Dogs (Low Growth, Low Market Share)
- 4.4. Ansoff Matrix Analysis
- 4.5. Supply Chain Analysis
- 4.6. Regulatory Landscape
- 4.7. Current Market Potential and Opportunity Assessment (TAM–SAM–SOM Framework)
- 4.8. VDR Analyst Note
- 4.1. Porters Five Forces
- 5. Market Analysis, Insights and Forecast 2021-2033
- 5.1. Market Analysis, Insights and Forecast - by Feedstock Type
- 5.1.1. Sugarcane
- 5.1.2. Corn
- 5.1.3. Wheat
- 5.1.4. Other Feedstock Types
- 5.2. Market Analysis, Insights and Forecast - by Application
- 5.2.1. Automotive and Transportation
- 5.2.2. Food and Beverage
- 5.2.3. Pharmaceutical
- 5.2.4. Cosmetics and Personal Care
- 5.2.5. Other Applications
- 5.3. Market Analysis, Insights and Forecast - by Region
- 5.3.1. Asia Pacific
- 5.3.2. North America
- 5.3.3. Europe
- 5.3.4. South America
- 5.3.5. Middle East and Africa
- 5.1. Market Analysis, Insights and Forecast - by Feedstock Type
- 6. Global Bioethanol Market Analysis, Insights and Forecast, 2021-2033
- 6.1. Market Analysis, Insights and Forecast - by Feedstock Type
- 6.1.1. Sugarcane
- 6.1.2. Corn
- 6.1.3. Wheat
- 6.1.4. Other Feedstock Types
- 6.2. Market Analysis, Insights and Forecast - by Application
- 6.2.1. Automotive and Transportation
- 6.2.2. Food and Beverage
- 6.2.3. Pharmaceutical
- 6.2.4. Cosmetics and Personal Care
- 6.2.5. Other Applications
- 6.1. Market Analysis, Insights and Forecast - by Feedstock Type
- 7. Asia Pacific Bioethanol Market Analysis, Insights and Forecast, 2021-2033
- 7.1. Market Analysis, Insights and Forecast - by Feedstock Type
- 7.1.1. Sugarcane
- 7.1.2. Corn
- 7.1.3. Wheat
- 7.1.4. Other Feedstock Types
- 7.2. Market Analysis, Insights and Forecast - by Application
- 7.2.1. Automotive and Transportation
- 7.2.2. Food and Beverage
- 7.2.3. Pharmaceutical
- 7.2.4. Cosmetics and Personal Care
- 7.2.5. Other Applications
- 7.1. Market Analysis, Insights and Forecast - by Feedstock Type
- 8. North America Bioethanol Market Analysis, Insights and Forecast, 2021-2033
- 8.1. Market Analysis, Insights and Forecast - by Feedstock Type
- 8.1.1. Sugarcane
- 8.1.2. Corn
- 8.1.3. Wheat
- 8.1.4. Other Feedstock Types
- 8.2. Market Analysis, Insights and Forecast - by Application
- 8.2.1. Automotive and Transportation
- 8.2.2. Food and Beverage
- 8.2.3. Pharmaceutical
- 8.2.4. Cosmetics and Personal Care
- 8.2.5. Other Applications
- 8.1. Market Analysis, Insights and Forecast - by Feedstock Type
- 9. Europe Bioethanol Market Analysis, Insights and Forecast, 2021-2033
- 9.1. Market Analysis, Insights and Forecast - by Feedstock Type
- 9.1.1. Sugarcane
- 9.1.2. Corn
- 9.1.3. Wheat
- 9.1.4. Other Feedstock Types
- 9.2. Market Analysis, Insights and Forecast - by Application
- 9.2.1. Automotive and Transportation
- 9.2.2. Food and Beverage
- 9.2.3. Pharmaceutical
- 9.2.4. Cosmetics and Personal Care
- 9.2.5. Other Applications
- 9.1. Market Analysis, Insights and Forecast - by Feedstock Type
- 10. South America Bioethanol Market Analysis, Insights and Forecast, 2021-2033
- 10.1. Market Analysis, Insights and Forecast - by Feedstock Type
- 10.1.1. Sugarcane
- 10.1.2. Corn
- 10.1.3. Wheat
- 10.1.4. Other Feedstock Types
- 10.2. Market Analysis, Insights and Forecast - by Application
- 10.2.1. Automotive and Transportation
- 10.2.2. Food and Beverage
- 10.2.3. Pharmaceutical
- 10.2.4. Cosmetics and Personal Care
- 10.2.5. Other Applications
- 10.1. Market Analysis, Insights and Forecast - by Feedstock Type
- 11. Middle East and Africa Bioethanol Market Analysis, Insights and Forecast, 2021-2033
- 11.1. Market Analysis, Insights and Forecast - by Feedstock Type
- 11.1.1. Sugarcane
- 11.1.2. Corn
- 11.1.3. Wheat
- 11.1.4. Other Feedstock Types
- 11.2. Market Analysis, Insights and Forecast - by Application
- 11.2.1. Automotive and Transportation
- 11.2.2. Food and Beverage
- 11.2.3. Pharmaceutical
- 11.2.4. Cosmetics and Personal Care
- 11.2.5. Other Applications
- 11.1. Market Analysis, Insights and Forecast - by Feedstock Type
- 12. Competitive Analysis
- 12.1. Company Profiles
- 12.1.1 ADM
- 12.1.1.1. Company Overview
- 12.1.1.2. Products
- 12.1.1.3. Company Financials
- 12.1.1.4. SWOT Analysis
- 12.1.2 Cenovus Inc
- 12.1.2.1. Company Overview
- 12.1.2.2. Products
- 12.1.2.3. Company Financials
- 12.1.2.4. SWOT Analysis
- 12.1.3 Cropenergies AG
- 12.1.3.1. Company Overview
- 12.1.3.2. Products
- 12.1.3.3. Company Financials
- 12.1.3.4. SWOT Analysis
- 12.1.4 Henan Tianguan Group Co Ltd
- 12.1.4.1. Company Overview
- 12.1.4.2. Products
- 12.1.4.3. Company Financials
- 12.1.4.4. SWOT Analysis
- 12.1.5 Alto Ingredients Inc
- 12.1.5.1. Company Overview
- 12.1.5.2. Products
- 12.1.5.3. Company Financials
- 12.1.5.4. SWOT Analysis
- 12.1.6 Green Plains Inc
- 12.1.6.1. Company Overview
- 12.1.6.2. Products
- 12.1.6.3. Company Financials
- 12.1.6.4. SWOT Analysis
- 12.1.7 Suncor Energy Inc
- 12.1.7.1. Company Overview
- 12.1.7.2. Products
- 12.1.7.3. Company Financials
- 12.1.7.4. SWOT Analysis
- 12.1.8 Valero
- 12.1.8.1. Company Overview
- 12.1.8.2. Products
- 12.1.8.3. Company Financials
- 12.1.8.4. SWOT Analysis
- 12.1.9 Ethanol Technologies
- 12.1.9.1. Company Overview
- 12.1.9.2. Products
- 12.1.9.3. Company Financials
- 12.1.9.4. SWOT Analysis
- 12.1.10 Verbio Vereinigte Bioenergie AG*List Not Exhaustive
- 12.1.10.1. Company Overview
- 12.1.10.2. Products
- 12.1.10.3. Company Financials
- 12.1.10.4. SWOT Analysis
- 12.1.11 Abengoa
- 12.1.11.1. Company Overview
- 12.1.11.2. Products
- 12.1.11.3. Company Financials
- 12.1.11.4. SWOT Analysis
- 12.1.12 Granbio Investimentos SA
- 12.1.12.1. Company Overview
- 12.1.12.2. Products
- 12.1.12.3. Company Financials
- 12.1.12.4. SWOT Analysis
- 12.1.13 Sekab
- 12.1.13.1. Company Overview
- 12.1.13.2. Products
- 12.1.13.3. Company Financials
- 12.1.13.4. SWOT Analysis
- 12.1.14 Blue Bio Fuels Inc
- 12.1.14.1. Company Overview
- 12.1.14.2. Products
- 12.1.14.3. Company Financials
- 12.1.14.4. SWOT Analysis
- 12.1.15 Lantmannen
- 12.1.15.1. Company Overview
- 12.1.15.2. Products
- 12.1.15.3. Company Financials
- 12.1.15.4. SWOT Analysis
- 12.1.16 Tereos
- 12.1.16.1. Company Overview
- 12.1.16.2. Products
- 12.1.16.3. Company Financials
- 12.1.16.4. SWOT Analysis
- 12.1.17 Cristalco
- 12.1.17.1. Company Overview
- 12.1.17.2. Products
- 12.1.17.3. Company Financials
- 12.1.17.4. SWOT Analysis
- 12.1.18 Poet LLC
- 12.1.18.1. Company Overview
- 12.1.18.2. Products
- 12.1.18.3. Company Financials
- 12.1.18.4. SWOT Analysis
- 12.1.19 Jilin Fuel Ethanol Co Ltd
- 12.1.19.1. Company Overview
- 12.1.19.2. Products
- 12.1.19.3. Company Financials
- 12.1.19.4. SWOT Analysis
- 12.1.20 Raizen
- 12.1.20.1. Company Overview
- 12.1.20.2. Products
- 12.1.20.3. Company Financials
- 12.1.20.4. SWOT Analysis
- 12.1.21 KWST
- 12.1.21.1. Company Overview
- 12.1.21.2. Products
- 12.1.21.3. Company Financials
- 12.1.21.4. SWOT Analysis
- 12.1.1 ADM
- 12.2. Market Entropy
- 12.2.1 Company's Key Areas Served
- 12.2.2 Recent Developments
- 12.3. Company Market Share Analysis 2025
- 12.3.1 Top 5 Companies Market Share Analysis
- 12.3.2 Top 3 Companies Market Share Analysis
- 12.4. List of Potential Customers
- 13. Research Methodology
List of Figures
- Figure 1: Global Bioethanol Market Revenue Breakdown (billion, %) by Region 2025 & 2033
- Figure 2: Global Bioethanol Market Volume Breakdown (Billion, %) by Region 2025 & 2033
- Figure 3: Asia Pacific Bioethanol Market Revenue (billion), by Feedstock Type 2025 & 2033
- Figure 4: Asia Pacific Bioethanol Market Volume (Billion), by Feedstock Type 2025 & 2033
- Figure 5: Asia Pacific Bioethanol Market Revenue Share (%), by Feedstock Type 2025 & 2033
- Figure 6: Asia Pacific Bioethanol Market Volume Share (%), by Feedstock Type 2025 & 2033
- Figure 7: Asia Pacific Bioethanol Market Revenue (billion), by Application 2025 & 2033
- Figure 8: Asia Pacific Bioethanol Market Volume (Billion), by Application 2025 & 2033
- Figure 9: Asia Pacific Bioethanol Market Revenue Share (%), by Application 2025 & 2033
- Figure 10: Asia Pacific Bioethanol Market Volume Share (%), by Application 2025 & 2033
- Figure 11: Asia Pacific Bioethanol Market Revenue (billion), by Country 2025 & 2033
- Figure 12: Asia Pacific Bioethanol Market Volume (Billion), by Country 2025 & 2033
- Figure 13: Asia Pacific Bioethanol Market Revenue Share (%), by Country 2025 & 2033
- Figure 14: Asia Pacific Bioethanol Market Volume Share (%), by Country 2025 & 2033
- Figure 15: North America Bioethanol Market Revenue (billion), by Feedstock Type 2025 & 2033
- Figure 16: North America Bioethanol Market Volume (Billion), by Feedstock Type 2025 & 2033
- Figure 17: North America Bioethanol Market Revenue Share (%), by Feedstock Type 2025 & 2033
- Figure 18: North America Bioethanol Market Volume Share (%), by Feedstock Type 2025 & 2033
- Figure 19: North America Bioethanol Market Revenue (billion), by Application 2025 & 2033
- Figure 20: North America Bioethanol Market Volume (Billion), by Application 2025 & 2033
- Figure 21: North America Bioethanol Market Revenue Share (%), by Application 2025 & 2033
- Figure 22: North America Bioethanol Market Volume Share (%), by Application 2025 & 2033
- Figure 23: North America Bioethanol Market Revenue (billion), by Country 2025 & 2033
- Figure 24: North America Bioethanol Market Volume (Billion), by Country 2025 & 2033
- Figure 25: North America Bioethanol Market Revenue Share (%), by Country 2025 & 2033
- Figure 26: North America Bioethanol Market Volume Share (%), by Country 2025 & 2033
- Figure 27: Europe Bioethanol Market Revenue (billion), by Feedstock Type 2025 & 2033
- Figure 28: Europe Bioethanol Market Volume (Billion), by Feedstock Type 2025 & 2033
- Figure 29: Europe Bioethanol Market Revenue Share (%), by Feedstock Type 2025 & 2033
- Figure 30: Europe Bioethanol Market Volume Share (%), by Feedstock Type 2025 & 2033
- Figure 31: Europe Bioethanol Market Revenue (billion), by Application 2025 & 2033
- Figure 32: Europe Bioethanol Market Volume (Billion), by Application 2025 & 2033
- Figure 33: Europe Bioethanol Market Revenue Share (%), by Application 2025 & 2033
- Figure 34: Europe Bioethanol Market Volume Share (%), by Application 2025 & 2033
- Figure 35: Europe Bioethanol Market Revenue (billion), by Country 2025 & 2033
- Figure 36: Europe Bioethanol Market Volume (Billion), by Country 2025 & 2033
- Figure 37: Europe Bioethanol Market Revenue Share (%), by Country 2025 & 2033
- Figure 38: Europe Bioethanol Market Volume Share (%), by Country 2025 & 2033
- Figure 39: South America Bioethanol Market Revenue (billion), by Feedstock Type 2025 & 2033
- Figure 40: South America Bioethanol Market Volume (Billion), by Feedstock Type 2025 & 2033
- Figure 41: South America Bioethanol Market Revenue Share (%), by Feedstock Type 2025 & 2033
- Figure 42: South America Bioethanol Market Volume Share (%), by Feedstock Type 2025 & 2033
- Figure 43: South America Bioethanol Market Revenue (billion), by Application 2025 & 2033
- Figure 44: South America Bioethanol Market Volume (Billion), by Application 2025 & 2033
- Figure 45: South America Bioethanol Market Revenue Share (%), by Application 2025 & 2033
- Figure 46: South America Bioethanol Market Volume Share (%), by Application 2025 & 2033
- Figure 47: South America Bioethanol Market Revenue (billion), by Country 2025 & 2033
- Figure 48: South America Bioethanol Market Volume (Billion), by Country 2025 & 2033
- Figure 49: South America Bioethanol Market Revenue Share (%), by Country 2025 & 2033
- Figure 50: South America Bioethanol Market Volume Share (%), by Country 2025 & 2033
- Figure 51: Middle East and Africa Bioethanol Market Revenue (billion), by Feedstock Type 2025 & 2033
- Figure 52: Middle East and Africa Bioethanol Market Volume (Billion), by Feedstock Type 2025 & 2033
- Figure 53: Middle East and Africa Bioethanol Market Revenue Share (%), by Feedstock Type 2025 & 2033
- Figure 54: Middle East and Africa Bioethanol Market Volume Share (%), by Feedstock Type 2025 & 2033
- Figure 55: Middle East and Africa Bioethanol Market Revenue (billion), by Application 2025 & 2033
- Figure 56: Middle East and Africa Bioethanol Market Volume (Billion), by Application 2025 & 2033
- Figure 57: Middle East and Africa Bioethanol Market Revenue Share (%), by Application 2025 & 2033
- Figure 58: Middle East and Africa Bioethanol Market Volume Share (%), by Application 2025 & 2033
- Figure 59: Middle East and Africa Bioethanol Market Revenue (billion), by Country 2025 & 2033
- Figure 60: Middle East and Africa Bioethanol Market Volume (Billion), by Country 2025 & 2033
- Figure 61: Middle East and Africa Bioethanol Market Revenue Share (%), by Country 2025 & 2033
- Figure 62: Middle East and Africa Bioethanol Market Volume Share (%), by Country 2025 & 2033
List of Tables
- Table 1: Global Bioethanol Market Revenue billion Forecast, by Feedstock Type 2020 & 2033
- Table 2: Global Bioethanol Market Volume Billion Forecast, by Feedstock Type 2020 & 2033
- Table 3: Global Bioethanol Market Revenue billion Forecast, by Application 2020 & 2033
- Table 4: Global Bioethanol Market Volume Billion Forecast, by Application 2020 & 2033
- Table 5: Global Bioethanol Market Revenue billion Forecast, by Region 2020 & 2033
- Table 6: Global Bioethanol Market Volume Billion Forecast, by Region 2020 & 2033
- Table 7: Global Bioethanol Market Revenue billion Forecast, by Feedstock Type 2020 & 2033
- Table 8: Global Bioethanol Market Volume Billion Forecast, by Feedstock Type 2020 & 2033
- Table 9: Global Bioethanol Market Revenue billion Forecast, by Application 2020 & 2033
- Table 10: Global Bioethanol Market Volume Billion Forecast, by Application 2020 & 2033
- Table 11: Global Bioethanol Market Revenue billion Forecast, by Country 2020 & 2033
- Table 12: Global Bioethanol Market Volume Billion Forecast, by Country 2020 & 2033
- Table 13: China Bioethanol Market Revenue (billion) Forecast, by Application 2020 & 2033
- Table 14: China Bioethanol Market Volume (Billion) Forecast, by Application 2020 & 2033
- Table 15: India Bioethanol Market Revenue (billion) Forecast, by Application 2020 & 2033
- Table 16: India Bioethanol Market Volume (Billion) Forecast, by Application 2020 & 2033
- Table 17: Japan Bioethanol Market Revenue (billion) Forecast, by Application 2020 & 2033
- Table 18: Japan Bioethanol Market Volume (Billion) Forecast, by Application 2020 & 2033
- Table 19: South Korea Bioethanol Market Revenue (billion) Forecast, by Application 2020 & 2033
- Table 20: South Korea Bioethanol Market Volume (Billion) Forecast, by Application 2020 & 2033
- Table 21: Rest of Asia Pacific Bioethanol Market Revenue (billion) Forecast, by Application 2020 & 2033
- Table 22: Rest of Asia Pacific Bioethanol Market Volume (Billion) Forecast, by Application 2020 & 2033
- Table 23: Global Bioethanol Market Revenue billion Forecast, by Feedstock Type 2020 & 2033
- Table 24: Global Bioethanol Market Volume Billion Forecast, by Feedstock Type 2020 & 2033
- Table 25: Global Bioethanol Market Revenue billion Forecast, by Application 2020 & 2033
- Table 26: Global Bioethanol Market Volume Billion Forecast, by Application 2020 & 2033
- Table 27: Global Bioethanol Market Revenue billion Forecast, by Country 2020 & 2033
- Table 28: Global Bioethanol Market Volume Billion Forecast, by Country 2020 & 2033
- Table 29: United States Bioethanol Market Revenue (billion) Forecast, by Application 2020 & 2033
- Table 30: United States Bioethanol Market Volume (Billion) Forecast, by Application 2020 & 2033
- Table 31: Canada Bioethanol Market Revenue (billion) Forecast, by Application 2020 & 2033
- Table 32: Canada Bioethanol Market Volume (Billion) Forecast, by Application 2020 & 2033
- Table 33: Mexico Bioethanol Market Revenue (billion) Forecast, by Application 2020 & 2033
- Table 34: Mexico Bioethanol Market Volume (Billion) Forecast, by Application 2020 & 2033
- Table 35: Global Bioethanol Market Revenue billion Forecast, by Feedstock Type 2020 & 2033
- Table 36: Global Bioethanol Market Volume Billion Forecast, by Feedstock Type 2020 & 2033
- Table 37: Global Bioethanol Market Revenue billion Forecast, by Application 2020 & 2033
- Table 38: Global Bioethanol Market Volume Billion Forecast, by Application 2020 & 2033
- Table 39: Global Bioethanol Market Revenue billion Forecast, by Country 2020 & 2033
- Table 40: Global Bioethanol Market Volume Billion Forecast, by Country 2020 & 2033
- Table 41: Germany Bioethanol Market Revenue (billion) Forecast, by Application 2020 & 2033
- Table 42: Germany Bioethanol Market Volume (Billion) Forecast, by Application 2020 & 2033
- Table 43: United Kingdom Bioethanol Market Revenue (billion) Forecast, by Application 2020 & 2033
- Table 44: United Kingdom Bioethanol Market Volume (Billion) Forecast, by Application 2020 & 2033
- Table 45: France Bioethanol Market Revenue (billion) Forecast, by Application 2020 & 2033
- Table 46: France Bioethanol Market Volume (Billion) Forecast, by Application 2020 & 2033
- Table 47: Italy Bioethanol Market Revenue (billion) Forecast, by Application 2020 & 2033
- Table 48: Italy Bioethanol Market Volume (Billion) Forecast, by Application 2020 & 2033
- Table 49: Rest of Europe Bioethanol Market Revenue (billion) Forecast, by Application 2020 & 2033
- Table 50: Rest of Europe Bioethanol Market Volume (Billion) Forecast, by Application 2020 & 2033
- Table 51: Global Bioethanol Market Revenue billion Forecast, by Feedstock Type 2020 & 2033
- Table 52: Global Bioethanol Market Volume Billion Forecast, by Feedstock Type 2020 & 2033
- Table 53: Global Bioethanol Market Revenue billion Forecast, by Application 2020 & 2033
- Table 54: Global Bioethanol Market Volume Billion Forecast, by Application 2020 & 2033
- Table 55: Global Bioethanol Market Revenue billion Forecast, by Country 2020 & 2033
- Table 56: Global Bioethanol Market Volume Billion Forecast, by Country 2020 & 2033
- Table 57: Brazil Bioethanol Market Revenue (billion) Forecast, by Application 2020 & 2033
- Table 58: Brazil Bioethanol Market Volume (Billion) Forecast, by Application 2020 & 2033
- Table 59: Argentina Bioethanol Market Revenue (billion) Forecast, by Application 2020 & 2033
- Table 60: Argentina Bioethanol Market Volume (Billion) Forecast, by Application 2020 & 2033
- Table 61: Rest of South America Bioethanol Market Revenue (billion) Forecast, by Application 2020 & 2033
- Table 62: Rest of South America Bioethanol Market Volume (Billion) Forecast, by Application 2020 & 2033
- Table 63: Global Bioethanol Market Revenue billion Forecast, by Feedstock Type 2020 & 2033
- Table 64: Global Bioethanol Market Volume Billion Forecast, by Feedstock Type 2020 & 2033
- Table 65: Global Bioethanol Market Revenue billion Forecast, by Application 2020 & 2033
- Table 66: Global Bioethanol Market Volume Billion Forecast, by Application 2020 & 2033
- Table 67: Global Bioethanol Market Revenue billion Forecast, by Country 2020 & 2033
- Table 68: Global Bioethanol Market Volume Billion Forecast, by Country 2020 & 2033
- Table 69: Saudi Arabia Bioethanol Market Revenue (billion) Forecast, by Application 2020 & 2033
- Table 70: Saudi Arabia Bioethanol Market Volume (Billion) Forecast, by Application 2020 & 2033
- Table 71: South Africa Bioethanol Market Revenue (billion) Forecast, by Application 2020 & 2033
- Table 72: South Africa Bioethanol Market Volume (Billion) Forecast, by Application 2020 & 2033
- Table 73: Rest of Middle East and Africa Bioethanol Market Revenue (billion) Forecast, by Application 2020 & 2033
- Table 74: Rest of Middle East and Africa Bioethanol Market Volume (Billion) Forecast, by Application 2020 & 2033
Frequently Asked Questions
1. What is the projected Compound Annual Growth Rate (CAGR) of the Bioethanol Market?
The projected CAGR is approximately 11.7%.
2. Which companies are prominent players in the Bioethanol Market?
Key companies in the market include ADM, Cenovus Inc, Cropenergies AG, Henan Tianguan Group Co Ltd, Alto Ingredients Inc, Green Plains Inc, Suncor Energy Inc, Valero, Ethanol Technologies, Verbio Vereinigte Bioenergie AG*List Not Exhaustive, Abengoa, Granbio Investimentos SA, Sekab, Blue Bio Fuels Inc, Lantmannen, Tereos, Cristalco, Poet LLC, Jilin Fuel Ethanol Co Ltd, Raizen, KWST.
3. What are the main segments of the Bioethanol Market?
The market segments include Feedstock Type, Application.
4. Can you provide details about the market size?
The market size is estimated to be USD 66.99 billion as of 2022.
5. What are some drivers contributing to market growth?
Increasing Favorable Initiatives and Blending Mandates by Regulatory Bodies; Rising Environmental Concerns by the Use of Fossil Fuels and Need for the Bio-fuels.
6. What are the notable trends driving market growth?
Increasing Usage in the Automotive and Transportation Sector.
7. Are there any restraints impacting market growth?
Phasing out of Fuel-based Vehicles Due to Rising Demand for Electric Vehicles; Shifting Focus to Bio-butanol.
8. Can you provide examples of recent developments in the market?
January 2023: United Airlines, Tallgrass, and Green Plains Inc. announced a joint venture with Blue Blade Energy to develop and commercialize a novel Sustainable Aviation Fuel (SAF) technology that uses ethanol feedstock.
9. What pricing options are available for accessing the report?
Pricing options include single-user, multi-user, and enterprise licenses priced at USD 4750, USD 5250, and USD 8750 respectively.
10. Is the market size provided in terms of value or volume?
The market size is provided in terms of value, measured in billion and volume, measured in Billion.
11. Are there any specific market keywords associated with the report?
Yes, the market keyword associated with the report is "Bioethanol Market," which aids in identifying and referencing the specific market segment covered.
12. How do I determine which pricing option suits my needs best?
The pricing options vary based on user requirements and access needs. Individual users may opt for single-user licenses, while businesses requiring broader access may choose multi-user or enterprise licenses for cost-effective access to the report.
13. Are there any additional resources or data provided in the Bioethanol Market report?
While the report offers comprehensive insights, it's advisable to review the specific contents or supplementary materials provided to ascertain if additional resources or data are available.
14. How can I stay updated on further developments or reports in the Bioethanol Market?
To stay informed about further developments, trends, and reports in the Bioethanol Market, consider subscribing to industry newsletters, following relevant companies and organizations, or regularly checking reputable industry news sources and publications.
Methodology
Step 1 - Identification of Relevant Samples Size from Population Database


Step 2 - Approaches for Defining Global Market Size (Value, Volume* & Price*)

Note*: In applicable scenarios
Step 3 - Data Sources
Primary Research
- Web Analytics
- Survey Reports
- Research Institute
- Latest Research Reports
- Opinion Leaders
Secondary Research
- Annual Reports
- White Paper
- Latest Press Release
- Industry Association
- Paid Database
- Investor Presentations

Step 4 - Data Triangulation
Involves using different sources of information in order to increase the validity of a study
These sources are likely to be stakeholders in a program - participants, other researchers, program staff, other community members, and so on.
Then we put all data in single framework & apply various statistical tools to find out the dynamic on the market.
During the analysis stage, feedback from the stakeholder groups would be compared to determine areas of agreement as well as areas of divergence