
Key Insights
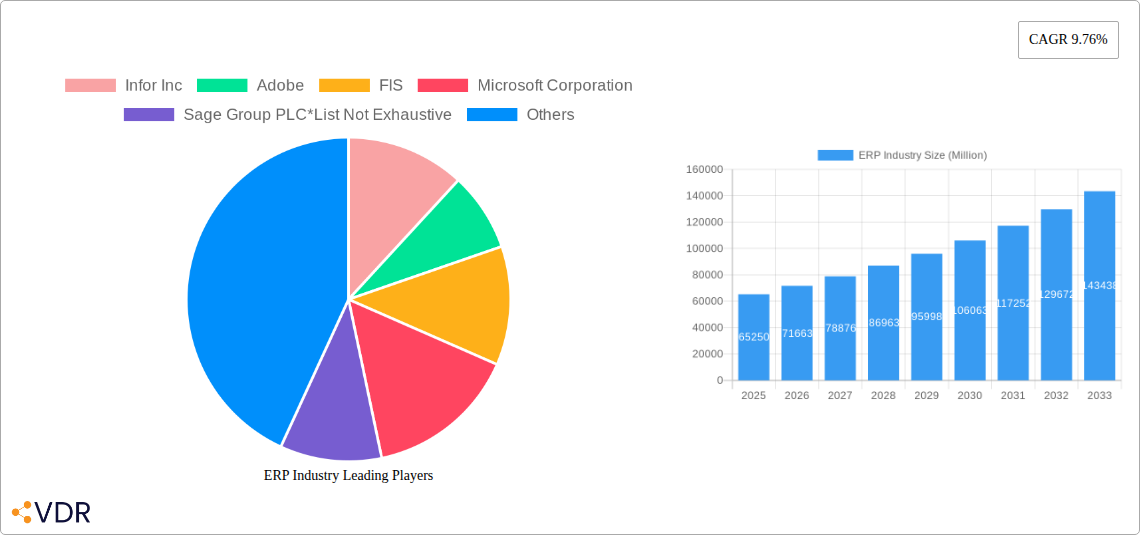
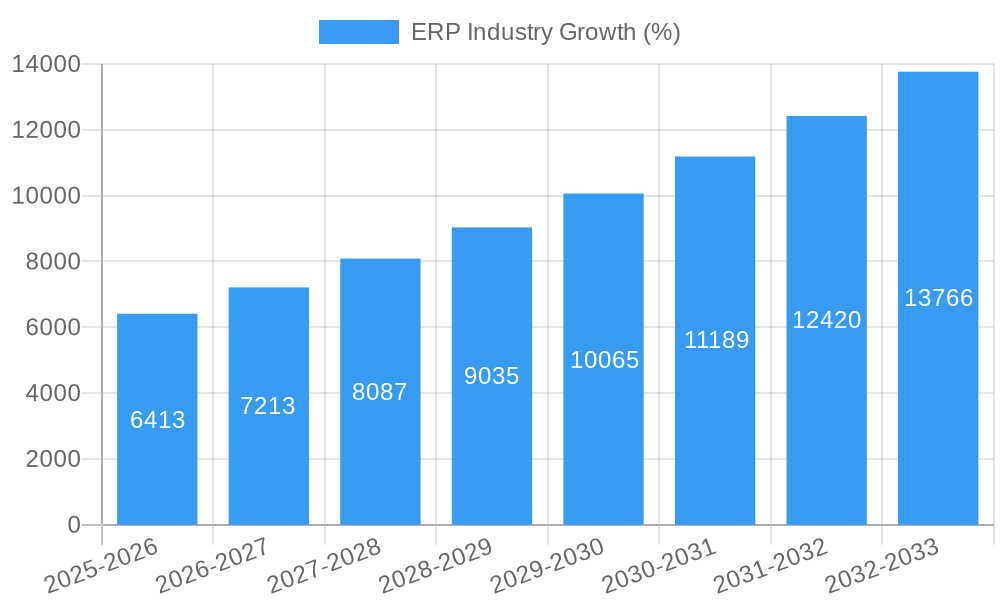
The Enterprise Resource Planning (ERP) industry, valued at $65.25 billion in 2025, is experiencing robust growth, projected to maintain a Compound Annual Growth Rate (CAGR) of 9.76% from 2025 to 2033. This expansion is fueled by several key drivers. The increasing need for streamlined business processes across diverse sectors like IT & Telecom, Government, Retail & E-commerce, Manufacturing, and Oil & Gas is a primary catalyst. Furthermore, the rising adoption of cloud-based solutions (Hybrid and On-Premise) and the growing demand for integrated functionalities across HR, Supply Chain, Finance, and Marketing departments are significantly boosting market growth. Large Enterprises are currently the biggest adopters, but the SME segment presents a significant untapped market potential, contributing to future growth. Technological advancements, such as Artificial Intelligence (AI) and Machine Learning (ML) integration within ERP systems, are further enhancing efficiency and driving adoption. Competitive pressures and the constant need for improved operational visibility are compelling organizations to invest in advanced ERP systems.
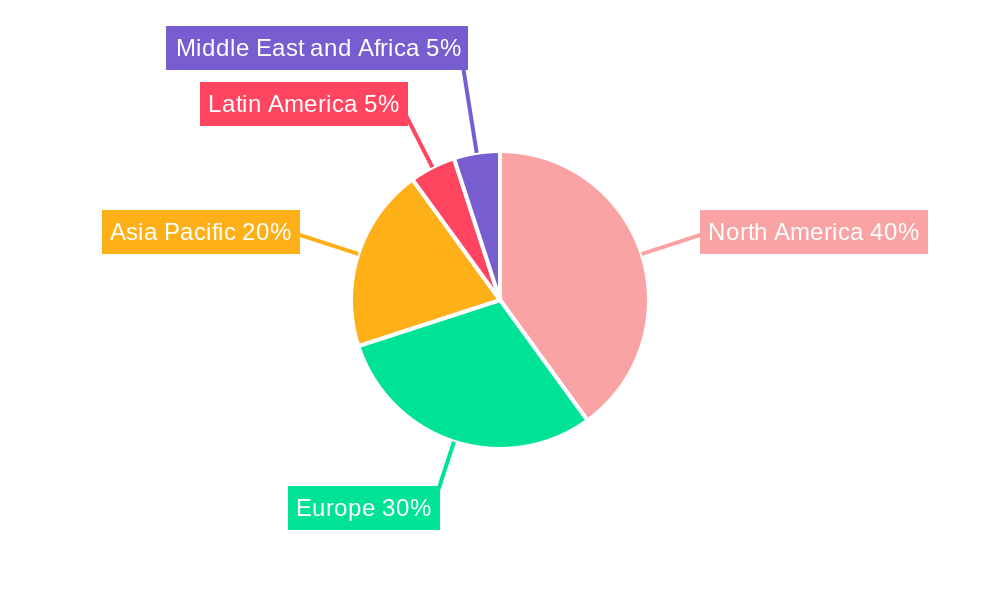
Geographical expansion is another vital factor. North America and Europe currently hold significant market shares, but the Asia-Pacific region, driven by economic growth and digital transformation initiatives in countries like China and India, shows substantial growth potential. While factors like high implementation costs and the complexity of integrating legacy systems pose some restraints, the overall market outlook remains positive. The increasing availability of affordable, user-friendly cloud-based ERP solutions, coupled with rising awareness about the benefits of improved data analytics and real-time insights, is likely to mitigate these challenges. The leading players, including Infor, Adobe, FIS, Microsoft, Sage, Constellation Software, Intuit, Oracle, SAP, and IBM, are continuously innovating to meet the evolving needs of businesses, contributing to the overall market dynamism and expansion.
ERP Industry Market Report: 2019-2033
This comprehensive report provides a detailed analysis of the Enterprise Resource Planning (ERP) industry, covering market dynamics, growth trends, key players, and future outlook. The study period spans from 2019 to 2033, with 2025 serving as the base and estimated year. The report leverages extensive data and insights to offer a valuable resource for industry professionals, investors, and strategic decision-makers. The report segments the market by Use Cases, Offering, Function, Deployment, Organization Size, and Industry Verticals, offering a granular view of the market landscape. The total market value in 2025 is estimated at xx Million.
ERP Industry Market Dynamics & Structure
The ERP market is characterized by moderate concentration, with key players like SAP SE, Oracle Corporation, and Microsoft Corporation holding significant market share. However, the market exhibits a dynamic competitive landscape with continuous innovation and mergers and acquisitions (M&A) activity. The global ERP market size in 2025 is estimated at xx Million.
- Market Concentration: The top 5 players account for approximately xx% of the market share in 2025.
- Technological Innovation: Cloud-based ERP solutions, AI integration (e.g., Microsoft Dynamics 365 Copilot), and the increasing adoption of mobile ERP are major drivers of innovation.
- Regulatory Frameworks: Data privacy regulations (GDPR, CCPA) and industry-specific compliance standards influence ERP system implementation and development.
- Competitive Product Substitutes: Specialized software solutions for specific business functions pose competition to comprehensive ERP suites.
- End-User Demographics: Large Enterprises currently dominate the market, but SMEs are increasingly adopting cloud-based ERP solutions.
- M&A Trends: The number of M&A deals in the ERP sector averaged xx per year during the historical period (2019-2024), indicating consolidation in the market. This trend is expected to continue.
ERP Industry Growth Trends & Insights
The ERP market exhibits robust growth driven by the increasing need for efficient resource management, improved operational efficiency, and enhanced decision-making capabilities across various industries. The market experienced a Compound Annual Growth Rate (CAGR) of xx% during the historical period (2019-2024) and is projected to grow at a CAGR of xx% during the forecast period (2025-2033), reaching an estimated value of xx Million by 2033. This growth is fueled by the rising adoption of cloud-based ERP solutions, increasing digital transformation initiatives, and the growing demand for advanced analytics and AI capabilities within ERP systems. Market penetration in key industries like BFSI and Manufacturing is steadily rising.
Dominant Regions, Countries, or Segments in ERP Industry
North America and Europe currently dominate the ERP market, driven by high technology adoption rates, robust digital infrastructure, and a large base of enterprises. However, the Asia-Pacific region is witnessing rapid growth due to increasing digitalization and economic expansion. Within segments:
- By Use Case: Manufacturing and BFSI (Banking, Financial Services, and Insurance) sectors are the largest revenue generators.
- By Offering: The solutions segment currently holds the larger market share compared to services, but the services segment is experiencing faster growth.
- By Function: Finance, Supply Chain, and HR are the most widely adopted ERP functions.
- By Deployment: Cloud-based ERP deployments are rapidly gaining traction, surpassing on-premise deployments.
- By Organization Size: Large Enterprises constitute a major revenue contributor due to their high investment capacity, but SMEs are adopting ERP solutions at an increasing rate.
- By Industry Vertical: BFSI is the leading industry segment for ERP adoption due to strict regulatory compliance needs and the need for efficient financial management.
Key drivers in these dominant regions and segments include:
- Favorable Economic Policies: Government initiatives promoting digital transformation and technology adoption.
- Robust IT Infrastructure: Availability of high-speed internet and cloud infrastructure.
- Skilled Workforce: Presence of a skilled IT workforce capable of implementing and managing ERP systems.
- High Business Investment: Companies are increasingly willing to invest in ERP systems to gain a competitive advantage.
ERP Industry Product Landscape
The ERP product landscape is constantly evolving, with vendors introducing innovative solutions to address specific industry needs. Key advancements include cloud-based ERP platforms, AI-powered analytics dashboards, integrated business intelligence tools, and enhanced mobile accessibility. These advancements deliver improved efficiency, better decision-making, and enhanced collaboration across different departments within an organization. The focus is shifting towards user-friendly interfaces and customizable solutions to cater to the diverse requirements of different industries and business sizes.
Key Drivers, Barriers & Challenges in ERP Industry
Key Drivers:
- Increasing need for business process automation and digital transformation.
- Growing demand for real-time data analytics and business intelligence.
- Rising adoption of cloud-based ERP solutions offering scalability and cost-effectiveness.
Challenges and Restraints:
- High implementation costs associated with complex ERP systems, especially for SMEs.
- Data security and privacy concerns regarding sensitive business information.
- Lack of skilled professionals for ERP implementation and maintenance. This shortage could impact the growth of the market by approximately xx Million by 2030.
Emerging Opportunities in ERP Industry
- Untapped potential in emerging markets with rising digitalization.
- Growing demand for industry-specific ERP solutions.
- Integration of emerging technologies like blockchain and IoT into ERP systems.
Growth Accelerators in the ERP Industry
The long-term growth of the ERP industry will be driven by continued technological advancements, strategic partnerships between ERP vendors and technology providers, and expansion into new geographic markets. The increasing focus on providing tailored solutions for specific industries and business sizes will also play a significant role.
Key Players Shaping the ERP Industry Market
- Infor Inc
- Adobe
- FIS
- Microsoft Corporation
- Sage Group PLC
- Constellation Software
- Intuit
- Oracle Corporation
- SAP SE
- IBM
Notable Milestones in ERP Industry Sector
- September 2023: Oracle and Mastercard partnership to automate B2B payment transactions. This significantly streamlines financial processes for Oracle's enterprise customers.
- March 2023: Microsoft launches Dynamics 365 Copilot, integrating AI into CRM and ERP, enhancing productivity and efficiency.
In-Depth ERP Industry Market Outlook
The ERP market is poised for significant growth in the coming years, driven by the increasing adoption of cloud-based solutions, the integration of AI and machine learning capabilities, and the expansion into new markets. Strategic partnerships, product innovation, and a focus on customer experience will be crucial for success in this evolving landscape. The market is expected to witness substantial growth, particularly in emerging economies and industries experiencing rapid digital transformation. The total market value is expected to reach xx Million by 2033.
ERP Industry Segmentation
-
1. Offering
- 1.1. Solutions
- 1.2. Services
-
2. Function
- 2.1. HR
- 2.2. Supply Chain
- 2.3. Finance
- 2.4. Marketing
- 2.5. Other Functions
-
3. Deployment
- 3.1. On-premise
- 3.2. Hybrid
-
4. Organization Size
- 4.1. Small and Medium Enterprises
- 4.2. Large Enterprises
-
5. Industry Verticals
-
5.1. BFSI
- 5.1.1. Use Cases
- 5.2. IT and Telecom
- 5.3. Government
- 5.4. Retail and E-commerce
- 5.5. Manufacturing
- 5.6. Oil, Gas, and Energy
- 5.7. Other Industry Verticals
-
5.1. BFSI
ERP Industry Segmentation By Geography
- 1. North America
- 2. Europe
- 3. Asia Pacific
- 4. Latin America
- 5. Middle East and Africa
ERP Industry REPORT HIGHLIGHTS
| Aspects | Details |
|---|---|
| Study Period | 2019-2033 |
| Base Year | 2024 |
| Estimated Year | 2025 |
| Forecast Period | 2025-2033 |
| Historical Period | 2019-2024 |
| Growth Rate | CAGR of 9.76% from 2019-2033 |
| Segmentation |
|
Table of Contents
- 1. Introduction
- 1.1. Research Scope
- 1.2. Market Segmentation
- 1.3. Research Methodology
- 1.4. Definitions and Assumptions
- 2. Executive Summary
- 2.1. Introduction
- 3. Market Dynamics
- 3.1. Introduction
- 3.2. Market Drivers
- 3.2.1. Rising Demand for Customer Centric Approach; Rapid Increase in Cloud and Mobile Application; Increase in Adoption of Data-intensive Approach and Decisions
- 3.3. Market Restrains
- 3.3.1. ; Lack of End-to-end Solutions; Lack of Techniques that allow Seamless IT systems and Application Integration
- 3.4. Market Trends
- 3.4.1. Large Enterprises to Witness Highest Market Growth
- 4. Market Factor Analysis
- 4.1. Porters Five Forces
- 4.2. Supply/Value Chain
- 4.3. PESTEL analysis
- 4.4. Market Entropy
- 4.5. Patent/Trademark Analysis
- 5. Global ERP Industry Analysis, Insights and Forecast, 2019-2031
- 5.1. Market Analysis, Insights and Forecast - by Offering
- 5.1.1. Solutions
- 5.1.2. Services
- 5.2. Market Analysis, Insights and Forecast - by Function
- 5.2.1. HR
- 5.2.2. Supply Chain
- 5.2.3. Finance
- 5.2.4. Marketing
- 5.2.5. Other Functions
- 5.3. Market Analysis, Insights and Forecast - by Deployment
- 5.3.1. On-premise
- 5.3.2. Hybrid
- 5.4. Market Analysis, Insights and Forecast - by Organization Size
- 5.4.1. Small and Medium Enterprises
- 5.4.2. Large Enterprises
- 5.5. Market Analysis, Insights and Forecast - by Industry Verticals
- 5.5.1. BFSI
- 5.5.1.1. Use Cases
- 5.5.2. IT and Telecom
- 5.5.3. Government
- 5.5.4. Retail and E-commerce
- 5.5.5. Manufacturing
- 5.5.6. Oil, Gas, and Energy
- 5.5.7. Other Industry Verticals
- 5.5.1. BFSI
- 5.6. Market Analysis, Insights and Forecast - by Region
- 5.6.1. North America
- 5.6.2. Europe
- 5.6.3. Asia Pacific
- 5.6.4. Latin America
- 5.6.5. Middle East and Africa
- 5.1. Market Analysis, Insights and Forecast - by Offering
- 6. North America ERP Industry Analysis, Insights and Forecast, 2019-2031
- 6.1. Market Analysis, Insights and Forecast - by Offering
- 6.1.1. Solutions
- 6.1.2. Services
- 6.2. Market Analysis, Insights and Forecast - by Function
- 6.2.1. HR
- 6.2.2. Supply Chain
- 6.2.3. Finance
- 6.2.4. Marketing
- 6.2.5. Other Functions
- 6.3. Market Analysis, Insights and Forecast - by Deployment
- 6.3.1. On-premise
- 6.3.2. Hybrid
- 6.4. Market Analysis, Insights and Forecast - by Organization Size
- 6.4.1. Small and Medium Enterprises
- 6.4.2. Large Enterprises
- 6.5. Market Analysis, Insights and Forecast - by Industry Verticals
- 6.5.1. BFSI
- 6.5.1.1. Use Cases
- 6.5.2. IT and Telecom
- 6.5.3. Government
- 6.5.4. Retail and E-commerce
- 6.5.5. Manufacturing
- 6.5.6. Oil, Gas, and Energy
- 6.5.7. Other Industry Verticals
- 6.5.1. BFSI
- 6.1. Market Analysis, Insights and Forecast - by Offering
- 7. Europe ERP Industry Analysis, Insights and Forecast, 2019-2031
- 7.1. Market Analysis, Insights and Forecast - by Offering
- 7.1.1. Solutions
- 7.1.2. Services
- 7.2. Market Analysis, Insights and Forecast - by Function
- 7.2.1. HR
- 7.2.2. Supply Chain
- 7.2.3. Finance
- 7.2.4. Marketing
- 7.2.5. Other Functions
- 7.3. Market Analysis, Insights and Forecast - by Deployment
- 7.3.1. On-premise
- 7.3.2. Hybrid
- 7.4. Market Analysis, Insights and Forecast - by Organization Size
- 7.4.1. Small and Medium Enterprises
- 7.4.2. Large Enterprises
- 7.5. Market Analysis, Insights and Forecast - by Industry Verticals
- 7.5.1. BFSI
- 7.5.1.1. Use Cases
- 7.5.2. IT and Telecom
- 7.5.3. Government
- 7.5.4. Retail and E-commerce
- 7.5.5. Manufacturing
- 7.5.6. Oil, Gas, and Energy
- 7.5.7. Other Industry Verticals
- 7.5.1. BFSI
- 7.1. Market Analysis, Insights and Forecast - by Offering
- 8. Asia Pacific ERP Industry Analysis, Insights and Forecast, 2019-2031
- 8.1. Market Analysis, Insights and Forecast - by Offering
- 8.1.1. Solutions
- 8.1.2. Services
- 8.2. Market Analysis, Insights and Forecast - by Function
- 8.2.1. HR
- 8.2.2. Supply Chain
- 8.2.3. Finance
- 8.2.4. Marketing
- 8.2.5. Other Functions
- 8.3. Market Analysis, Insights and Forecast - by Deployment
- 8.3.1. On-premise
- 8.3.2. Hybrid
- 8.4. Market Analysis, Insights and Forecast - by Organization Size
- 8.4.1. Small and Medium Enterprises
- 8.4.2. Large Enterprises
- 8.5. Market Analysis, Insights and Forecast - by Industry Verticals
- 8.5.1. BFSI
- 8.5.1.1. Use Cases
- 8.5.2. IT and Telecom
- 8.5.3. Government
- 8.5.4. Retail and E-commerce
- 8.5.5. Manufacturing
- 8.5.6. Oil, Gas, and Energy
- 8.5.7. Other Industry Verticals
- 8.5.1. BFSI
- 8.1. Market Analysis, Insights and Forecast - by Offering
- 9. Latin America ERP Industry Analysis, Insights and Forecast, 2019-2031
- 9.1. Market Analysis, Insights and Forecast - by Offering
- 9.1.1. Solutions
- 9.1.2. Services
- 9.2. Market Analysis, Insights and Forecast - by Function
- 9.2.1. HR
- 9.2.2. Supply Chain
- 9.2.3. Finance
- 9.2.4. Marketing
- 9.2.5. Other Functions
- 9.3. Market Analysis, Insights and Forecast - by Deployment
- 9.3.1. On-premise
- 9.3.2. Hybrid
- 9.4. Market Analysis, Insights and Forecast - by Organization Size
- 9.4.1. Small and Medium Enterprises
- 9.4.2. Large Enterprises
- 9.5. Market Analysis, Insights and Forecast - by Industry Verticals
- 9.5.1. BFSI
- 9.5.1.1. Use Cases
- 9.5.2. IT and Telecom
- 9.5.3. Government
- 9.5.4. Retail and E-commerce
- 9.5.5. Manufacturing
- 9.5.6. Oil, Gas, and Energy
- 9.5.7. Other Industry Verticals
- 9.5.1. BFSI
- 9.1. Market Analysis, Insights and Forecast - by Offering
- 10. Middle East and Africa ERP Industry Analysis, Insights and Forecast, 2019-2031
- 10.1. Market Analysis, Insights and Forecast - by Offering
- 10.1.1. Solutions
- 10.1.2. Services
- 10.2. Market Analysis, Insights and Forecast - by Function
- 10.2.1. HR
- 10.2.2. Supply Chain
- 10.2.3. Finance
- 10.2.4. Marketing
- 10.2.5. Other Functions
- 10.3. Market Analysis, Insights and Forecast - by Deployment
- 10.3.1. On-premise
- 10.3.2. Hybrid
- 10.4. Market Analysis, Insights and Forecast - by Organization Size
- 10.4.1. Small and Medium Enterprises
- 10.4.2. Large Enterprises
- 10.5. Market Analysis, Insights and Forecast - by Industry Verticals
- 10.5.1. BFSI
- 10.5.1.1. Use Cases
- 10.5.2. IT and Telecom
- 10.5.3. Government
- 10.5.4. Retail and E-commerce
- 10.5.5. Manufacturing
- 10.5.6. Oil, Gas, and Energy
- 10.5.7. Other Industry Verticals
- 10.5.1. BFSI
- 10.1. Market Analysis, Insights and Forecast - by Offering
- 11. North America ERP Industry Analysis, Insights and Forecast, 2019-2031
- 11.1. Market Analysis, Insights and Forecast - By Country/Sub-region
- 11.1.1 United States
- 11.1.2 Canada
- 12. Europe ERP Industry Analysis, Insights and Forecast, 2019-2031
- 12.1. Market Analysis, Insights and Forecast - By Country/Sub-region
- 12.1.1 United Kingdom
- 12.1.2 Germany
- 12.1.3 France
- 12.1.4 Greece
- 12.1.5 Rest of Europe
- 13. Asia Pacific ERP Industry Analysis, Insights and Forecast, 2019-2031
- 13.1. Market Analysis, Insights and Forecast - By Country/Sub-region
- 13.1.1 China
- 13.1.2 India
- 13.1.3 Japan
- 13.1.4 Australia
- 13.1.5 Indonesia
- 13.1.6 Philippines
- 13.1.7 Malaysia
- 13.1.8 Singapore
- 13.1.9 Rest of Asia Pacific
- 14. Latin America ERP Industry Analysis, Insights and Forecast, 2019-2031
- 14.1. Market Analysis, Insights and Forecast - By Country/Sub-region
- 14.1.1 Brazil
- 14.1.2 Argentina
- 14.1.3 Mexico
- 14.1.4 Rest of Latin America
- 15. Middle East and Africa ERP Industry Analysis, Insights and Forecast, 2019-2031
- 15.1. Market Analysis, Insights and Forecast - By Country/Sub-region
- 15.1.1 Saudi Arabia
- 15.1.2 GCC
- 16. United Arab Emirates ERP Industry Analysis, Insights and Forecast, 2019-2031
- 16.1. Market Analysis, Insights and Forecast - By Country/Sub-region
- 16.1.1.
- 17. Rest of GCC ERP Industry Analysis, Insights and Forecast, 2019-2031
- 17.1. Market Analysis, Insights and Forecast - By Country/Sub-region
- 17.1.1 South Africa
- 17.1.2 Rest of Middle East
- 18. Competitive Analysis
- 18.1. Global Market Share Analysis 2024
- 18.2. Company Profiles
- 18.2.1 Infor Inc
- 18.2.1.1. Overview
- 18.2.1.2. Products
- 18.2.1.3. SWOT Analysis
- 18.2.1.4. Recent Developments
- 18.2.1.5. Financials (Based on Availability)
- 18.2.2 Adobe
- 18.2.2.1. Overview
- 18.2.2.2. Products
- 18.2.2.3. SWOT Analysis
- 18.2.2.4. Recent Developments
- 18.2.2.5. Financials (Based on Availability)
- 18.2.3 FIS
- 18.2.3.1. Overview
- 18.2.3.2. Products
- 18.2.3.3. SWOT Analysis
- 18.2.3.4. Recent Developments
- 18.2.3.5. Financials (Based on Availability)
- 18.2.4 Microsoft Corporation
- 18.2.4.1. Overview
- 18.2.4.2. Products
- 18.2.4.3. SWOT Analysis
- 18.2.4.4. Recent Developments
- 18.2.4.5. Financials (Based on Availability)
- 18.2.5 Sage Group PLC*List Not Exhaustive
- 18.2.5.1. Overview
- 18.2.5.2. Products
- 18.2.5.3. SWOT Analysis
- 18.2.5.4. Recent Developments
- 18.2.5.5. Financials (Based on Availability)
- 18.2.6 Constellation Software
- 18.2.6.1. Overview
- 18.2.6.2. Products
- 18.2.6.3. SWOT Analysis
- 18.2.6.4. Recent Developments
- 18.2.6.5. Financials (Based on Availability)
- 18.2.7 Intuit
- 18.2.7.1. Overview
- 18.2.7.2. Products
- 18.2.7.3. SWOT Analysis
- 18.2.7.4. Recent Developments
- 18.2.7.5. Financials (Based on Availability)
- 18.2.8 Oracle Corporation
- 18.2.8.1. Overview
- 18.2.8.2. Products
- 18.2.8.3. SWOT Analysis
- 18.2.8.4. Recent Developments
- 18.2.8.5. Financials (Based on Availability)
- 18.2.9 SAP SE
- 18.2.9.1. Overview
- 18.2.9.2. Products
- 18.2.9.3. SWOT Analysis
- 18.2.9.4. Recent Developments
- 18.2.9.5. Financials (Based on Availability)
- 18.2.10 IBM
- 18.2.10.1. Overview
- 18.2.10.2. Products
- 18.2.10.3. SWOT Analysis
- 18.2.10.4. Recent Developments
- 18.2.10.5. Financials (Based on Availability)
- 18.2.1 Infor Inc
List of Figures
- Figure 1: Global ERP Industry Revenue Breakdown (Million, %) by Region 2024 & 2032
- Figure 2: North America ERP Industry Revenue (Million), by Country 2024 & 2032
- Figure 3: North America ERP Industry Revenue Share (%), by Country 2024 & 2032
- Figure 4: Europe ERP Industry Revenue (Million), by Country 2024 & 2032
- Figure 5: Europe ERP Industry Revenue Share (%), by Country 2024 & 2032
- Figure 6: Asia Pacific ERP Industry Revenue (Million), by Country 2024 & 2032
- Figure 7: Asia Pacific ERP Industry Revenue Share (%), by Country 2024 & 2032
- Figure 8: Latin America ERP Industry Revenue (Million), by Country 2024 & 2032
- Figure 9: Latin America ERP Industry Revenue Share (%), by Country 2024 & 2032
- Figure 10: Middle East and Africa ERP Industry Revenue (Million), by Country 2024 & 2032
- Figure 11: Middle East and Africa ERP Industry Revenue Share (%), by Country 2024 & 2032
- Figure 12: United Arab Emirates ERP Industry Revenue (Million), by Country 2024 & 2032
- Figure 13: United Arab Emirates ERP Industry Revenue Share (%), by Country 2024 & 2032
- Figure 14: Rest of GCC ERP Industry Revenue (Million), by Country 2024 & 2032
- Figure 15: Rest of GCC ERP Industry Revenue Share (%), by Country 2024 & 2032
- Figure 16: North America ERP Industry Revenue (Million), by Offering 2024 & 2032
- Figure 17: North America ERP Industry Revenue Share (%), by Offering 2024 & 2032
- Figure 18: North America ERP Industry Revenue (Million), by Function 2024 & 2032
- Figure 19: North America ERP Industry Revenue Share (%), by Function 2024 & 2032
- Figure 20: North America ERP Industry Revenue (Million), by Deployment 2024 & 2032
- Figure 21: North America ERP Industry Revenue Share (%), by Deployment 2024 & 2032
- Figure 22: North America ERP Industry Revenue (Million), by Organization Size 2024 & 2032
- Figure 23: North America ERP Industry Revenue Share (%), by Organization Size 2024 & 2032
- Figure 24: North America ERP Industry Revenue (Million), by Industry Verticals 2024 & 2032
- Figure 25: North America ERP Industry Revenue Share (%), by Industry Verticals 2024 & 2032
- Figure 26: North America ERP Industry Revenue (Million), by Country 2024 & 2032
- Figure 27: North America ERP Industry Revenue Share (%), by Country 2024 & 2032
- Figure 28: Europe ERP Industry Revenue (Million), by Offering 2024 & 2032
- Figure 29: Europe ERP Industry Revenue Share (%), by Offering 2024 & 2032
- Figure 30: Europe ERP Industry Revenue (Million), by Function 2024 & 2032
- Figure 31: Europe ERP Industry Revenue Share (%), by Function 2024 & 2032
- Figure 32: Europe ERP Industry Revenue (Million), by Deployment 2024 & 2032
- Figure 33: Europe ERP Industry Revenue Share (%), by Deployment 2024 & 2032
- Figure 34: Europe ERP Industry Revenue (Million), by Organization Size 2024 & 2032
- Figure 35: Europe ERP Industry Revenue Share (%), by Organization Size 2024 & 2032
- Figure 36: Europe ERP Industry Revenue (Million), by Industry Verticals 2024 & 2032
- Figure 37: Europe ERP Industry Revenue Share (%), by Industry Verticals 2024 & 2032
- Figure 38: Europe ERP Industry Revenue (Million), by Country 2024 & 2032
- Figure 39: Europe ERP Industry Revenue Share (%), by Country 2024 & 2032
- Figure 40: Asia Pacific ERP Industry Revenue (Million), by Offering 2024 & 2032
- Figure 41: Asia Pacific ERP Industry Revenue Share (%), by Offering 2024 & 2032
- Figure 42: Asia Pacific ERP Industry Revenue (Million), by Function 2024 & 2032
- Figure 43: Asia Pacific ERP Industry Revenue Share (%), by Function 2024 & 2032
- Figure 44: Asia Pacific ERP Industry Revenue (Million), by Deployment 2024 & 2032
- Figure 45: Asia Pacific ERP Industry Revenue Share (%), by Deployment 2024 & 2032
- Figure 46: Asia Pacific ERP Industry Revenue (Million), by Organization Size 2024 & 2032
- Figure 47: Asia Pacific ERP Industry Revenue Share (%), by Organization Size 2024 & 2032
- Figure 48: Asia Pacific ERP Industry Revenue (Million), by Industry Verticals 2024 & 2032
- Figure 49: Asia Pacific ERP Industry Revenue Share (%), by Industry Verticals 2024 & 2032
- Figure 50: Asia Pacific ERP Industry Revenue (Million), by Country 2024 & 2032
- Figure 51: Asia Pacific ERP Industry Revenue Share (%), by Country 2024 & 2032
- Figure 52: Latin America ERP Industry Revenue (Million), by Offering 2024 & 2032
- Figure 53: Latin America ERP Industry Revenue Share (%), by Offering 2024 & 2032
- Figure 54: Latin America ERP Industry Revenue (Million), by Function 2024 & 2032
- Figure 55: Latin America ERP Industry Revenue Share (%), by Function 2024 & 2032
- Figure 56: Latin America ERP Industry Revenue (Million), by Deployment 2024 & 2032
- Figure 57: Latin America ERP Industry Revenue Share (%), by Deployment 2024 & 2032
- Figure 58: Latin America ERP Industry Revenue (Million), by Organization Size 2024 & 2032
- Figure 59: Latin America ERP Industry Revenue Share (%), by Organization Size 2024 & 2032
- Figure 60: Latin America ERP Industry Revenue (Million), by Industry Verticals 2024 & 2032
- Figure 61: Latin America ERP Industry Revenue Share (%), by Industry Verticals 2024 & 2032
- Figure 62: Latin America ERP Industry Revenue (Million), by Country 2024 & 2032
- Figure 63: Latin America ERP Industry Revenue Share (%), by Country 2024 & 2032
- Figure 64: Middle East and Africa ERP Industry Revenue (Million), by Offering 2024 & 2032
- Figure 65: Middle East and Africa ERP Industry Revenue Share (%), by Offering 2024 & 2032
- Figure 66: Middle East and Africa ERP Industry Revenue (Million), by Function 2024 & 2032
- Figure 67: Middle East and Africa ERP Industry Revenue Share (%), by Function 2024 & 2032
- Figure 68: Middle East and Africa ERP Industry Revenue (Million), by Deployment 2024 & 2032
- Figure 69: Middle East and Africa ERP Industry Revenue Share (%), by Deployment 2024 & 2032
- Figure 70: Middle East and Africa ERP Industry Revenue (Million), by Organization Size 2024 & 2032
- Figure 71: Middle East and Africa ERP Industry Revenue Share (%), by Organization Size 2024 & 2032
- Figure 72: Middle East and Africa ERP Industry Revenue (Million), by Industry Verticals 2024 & 2032
- Figure 73: Middle East and Africa ERP Industry Revenue Share (%), by Industry Verticals 2024 & 2032
- Figure 74: Middle East and Africa ERP Industry Revenue (Million), by Country 2024 & 2032
- Figure 75: Middle East and Africa ERP Industry Revenue Share (%), by Country 2024 & 2032
List of Tables
- Table 1: Global ERP Industry Revenue Million Forecast, by Region 2019 & 2032
- Table 2: Global ERP Industry Revenue Million Forecast, by Offering 2019 & 2032
- Table 3: Global ERP Industry Revenue Million Forecast, by Function 2019 & 2032
- Table 4: Global ERP Industry Revenue Million Forecast, by Deployment 2019 & 2032
- Table 5: Global ERP Industry Revenue Million Forecast, by Organization Size 2019 & 2032
- Table 6: Global ERP Industry Revenue Million Forecast, by Industry Verticals 2019 & 2032
- Table 7: Global ERP Industry Revenue Million Forecast, by Region 2019 & 2032
- Table 8: Global ERP Industry Revenue Million Forecast, by Country 2019 & 2032
- Table 9: United States ERP Industry Revenue (Million) Forecast, by Application 2019 & 2032
- Table 10: Canada ERP Industry Revenue (Million) Forecast, by Application 2019 & 2032
- Table 11: Global ERP Industry Revenue Million Forecast, by Country 2019 & 2032
- Table 12: United Kingdom ERP Industry Revenue (Million) Forecast, by Application 2019 & 2032
- Table 13: Germany ERP Industry Revenue (Million) Forecast, by Application 2019 & 2032
- Table 14: France ERP Industry Revenue (Million) Forecast, by Application 2019 & 2032
- Table 15: Greece ERP Industry Revenue (Million) Forecast, by Application 2019 & 2032
- Table 16: Rest of Europe ERP Industry Revenue (Million) Forecast, by Application 2019 & 2032
- Table 17: Global ERP Industry Revenue Million Forecast, by Country 2019 & 2032
- Table 18: China ERP Industry Revenue (Million) Forecast, by Application 2019 & 2032
- Table 19: India ERP Industry Revenue (Million) Forecast, by Application 2019 & 2032
- Table 20: Japan ERP Industry Revenue (Million) Forecast, by Application 2019 & 2032
- Table 21: Australia ERP Industry Revenue (Million) Forecast, by Application 2019 & 2032
- Table 22: Indonesia ERP Industry Revenue (Million) Forecast, by Application 2019 & 2032
- Table 23: Philippines ERP Industry Revenue (Million) Forecast, by Application 2019 & 2032
- Table 24: Malaysia ERP Industry Revenue (Million) Forecast, by Application 2019 & 2032
- Table 25: Singapore ERP Industry Revenue (Million) Forecast, by Application 2019 & 2032
- Table 26: Rest of Asia Pacific ERP Industry Revenue (Million) Forecast, by Application 2019 & 2032
- Table 27: Global ERP Industry Revenue Million Forecast, by Country 2019 & 2032
- Table 28: Brazil ERP Industry Revenue (Million) Forecast, by Application 2019 & 2032
- Table 29: Argentina ERP Industry Revenue (Million) Forecast, by Application 2019 & 2032
- Table 30: Mexico ERP Industry Revenue (Million) Forecast, by Application 2019 & 2032
- Table 31: Rest of Latin America ERP Industry Revenue (Million) Forecast, by Application 2019 & 2032
- Table 32: Global ERP Industry Revenue Million Forecast, by Country 2019 & 2032
- Table 33: Saudi Arabia ERP Industry Revenue (Million) Forecast, by Application 2019 & 2032
- Table 34: GCC ERP Industry Revenue (Million) Forecast, by Application 2019 & 2032
- Table 35: Global ERP Industry Revenue Million Forecast, by Country 2019 & 2032
- Table 36: ERP Industry Revenue (Million) Forecast, by Application 2019 & 2032
- Table 37: Global ERP Industry Revenue Million Forecast, by Country 2019 & 2032
- Table 38: South Africa ERP Industry Revenue (Million) Forecast, by Application 2019 & 2032
- Table 39: Rest of Middle East ERP Industry Revenue (Million) Forecast, by Application 2019 & 2032
- Table 40: Global ERP Industry Revenue Million Forecast, by Offering 2019 & 2032
- Table 41: Global ERP Industry Revenue Million Forecast, by Function 2019 & 2032
- Table 42: Global ERP Industry Revenue Million Forecast, by Deployment 2019 & 2032
- Table 43: Global ERP Industry Revenue Million Forecast, by Organization Size 2019 & 2032
- Table 44: Global ERP Industry Revenue Million Forecast, by Industry Verticals 2019 & 2032
- Table 45: Global ERP Industry Revenue Million Forecast, by Country 2019 & 2032
- Table 46: Global ERP Industry Revenue Million Forecast, by Offering 2019 & 2032
- Table 47: Global ERP Industry Revenue Million Forecast, by Function 2019 & 2032
- Table 48: Global ERP Industry Revenue Million Forecast, by Deployment 2019 & 2032
- Table 49: Global ERP Industry Revenue Million Forecast, by Organization Size 2019 & 2032
- Table 50: Global ERP Industry Revenue Million Forecast, by Industry Verticals 2019 & 2032
- Table 51: Global ERP Industry Revenue Million Forecast, by Country 2019 & 2032
- Table 52: Global ERP Industry Revenue Million Forecast, by Offering 2019 & 2032
- Table 53: Global ERP Industry Revenue Million Forecast, by Function 2019 & 2032
- Table 54: Global ERP Industry Revenue Million Forecast, by Deployment 2019 & 2032
- Table 55: Global ERP Industry Revenue Million Forecast, by Organization Size 2019 & 2032
- Table 56: Global ERP Industry Revenue Million Forecast, by Industry Verticals 2019 & 2032
- Table 57: Global ERP Industry Revenue Million Forecast, by Country 2019 & 2032
- Table 58: Global ERP Industry Revenue Million Forecast, by Offering 2019 & 2032
- Table 59: Global ERP Industry Revenue Million Forecast, by Function 2019 & 2032
- Table 60: Global ERP Industry Revenue Million Forecast, by Deployment 2019 & 2032
- Table 61: Global ERP Industry Revenue Million Forecast, by Organization Size 2019 & 2032
- Table 62: Global ERP Industry Revenue Million Forecast, by Industry Verticals 2019 & 2032
- Table 63: Global ERP Industry Revenue Million Forecast, by Country 2019 & 2032
- Table 64: Global ERP Industry Revenue Million Forecast, by Offering 2019 & 2032
- Table 65: Global ERP Industry Revenue Million Forecast, by Function 2019 & 2032
- Table 66: Global ERP Industry Revenue Million Forecast, by Deployment 2019 & 2032
- Table 67: Global ERP Industry Revenue Million Forecast, by Organization Size 2019 & 2032
- Table 68: Global ERP Industry Revenue Million Forecast, by Industry Verticals 2019 & 2032
- Table 69: Global ERP Industry Revenue Million Forecast, by Country 2019 & 2032
Frequently Asked Questions
1. What is the projected Compound Annual Growth Rate (CAGR) of the ERP Industry?
The projected CAGR is approximately 9.76%.
2. Which companies are prominent players in the ERP Industry?
Key companies in the market include Infor Inc, Adobe, FIS, Microsoft Corporation, Sage Group PLC*List Not Exhaustive, Constellation Software, Intuit, Oracle Corporation, SAP SE, IBM.
3. What are the main segments of the ERP Industry?
The market segments include Offering, Function, Deployment, Organization Size, Industry Verticals.
4. Can you provide details about the market size?
The market size is estimated to be USD 65.25 Million as of 2022.
5. What are some drivers contributing to market growth?
Rising Demand for Customer Centric Approach; Rapid Increase in Cloud and Mobile Application; Increase in Adoption of Data-intensive Approach and Decisions.
6. What are the notable trends driving market growth?
Large Enterprises to Witness Highest Market Growth.
7. Are there any restraints impacting market growth?
; Lack of End-to-end Solutions; Lack of Techniques that allow Seamless IT systems and Application Integration.
8. Can you provide examples of recent developments in the market?
September 2023 - Oracle and Mastercard announced a new partnership to help enterprise customers automate end-to-end business-to-business (B2B) payment transactions. The partnership lets Oracle directly connect Oracle Fusion Cloud Enterprise Resource Planning (ERP) with banks to streamline and automate the B2B finance and payment process. Moreover, many companies desire simpler commercial payment experiences. Yet, disparate data, systems, and processes across the ecosystem hinder enterprises and their suppliers from transacting efficiently. To address these challenges and enable organizations to connect and share information across all trading parties, Oracle aims to leverage Mastercard’s innovative virtual card platform to help expedite end-to-end financial transactions for Oracle’s corporate customers and enable banks to offer value-added services inside Oracle Cloud ERP.
9. What pricing options are available for accessing the report?
Pricing options include single-user, multi-user, and enterprise licenses priced at USD 4750, USD 5250, and USD 8750 respectively.
10. Is the market size provided in terms of value or volume?
The market size is provided in terms of value, measured in Million.
11. Are there any specific market keywords associated with the report?
Yes, the market keyword associated with the report is "ERP Industry," which aids in identifying and referencing the specific market segment covered.
12. How do I determine which pricing option suits my needs best?
The pricing options vary based on user requirements and access needs. Individual users may opt for single-user licenses, while businesses requiring broader access may choose multi-user or enterprise licenses for cost-effective access to the report.
13. Are there any additional resources or data provided in the ERP Industry report?
While the report offers comprehensive insights, it's advisable to review the specific contents or supplementary materials provided to ascertain if additional resources or data are available.
14. How can I stay updated on further developments or reports in the ERP Industry?
To stay informed about further developments, trends, and reports in the ERP Industry, consider subscribing to industry newsletters, following relevant companies and organizations, or regularly checking reputable industry news sources and publications.
Methodology
Step 1 - Identification of Relevant Samples Size from Population Database


Step 2 - Approaches for Defining Global Market Size (Value, Volume* & Price*)

Note*: In applicable scenarios
Step 3 - Data Sources
Primary Research
- Web Analytics
- Survey Reports
- Research Institute
- Latest Research Reports
- Opinion Leaders
Secondary Research
- Annual Reports
- White Paper
- Latest Press Release
- Industry Association
- Paid Database
- Investor Presentations

Step 4 - Data Triangulation
Involves using different sources of information in order to increase the validity of a study
These sources are likely to be stakeholders in a program - participants, other researchers, program staff, other community members, and so on.
Then we put all data in single framework & apply various statistical tools to find out the dynamic on the market.
During the analysis stage, feedback from the stakeholder groups would be compared to determine areas of agreement as well as areas of divergence


