
Key Insights
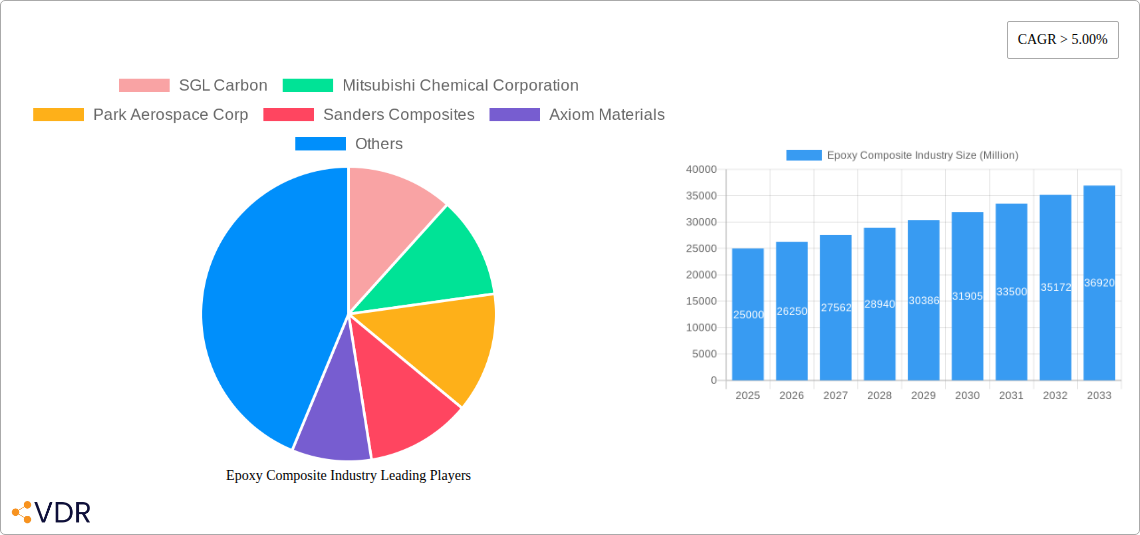
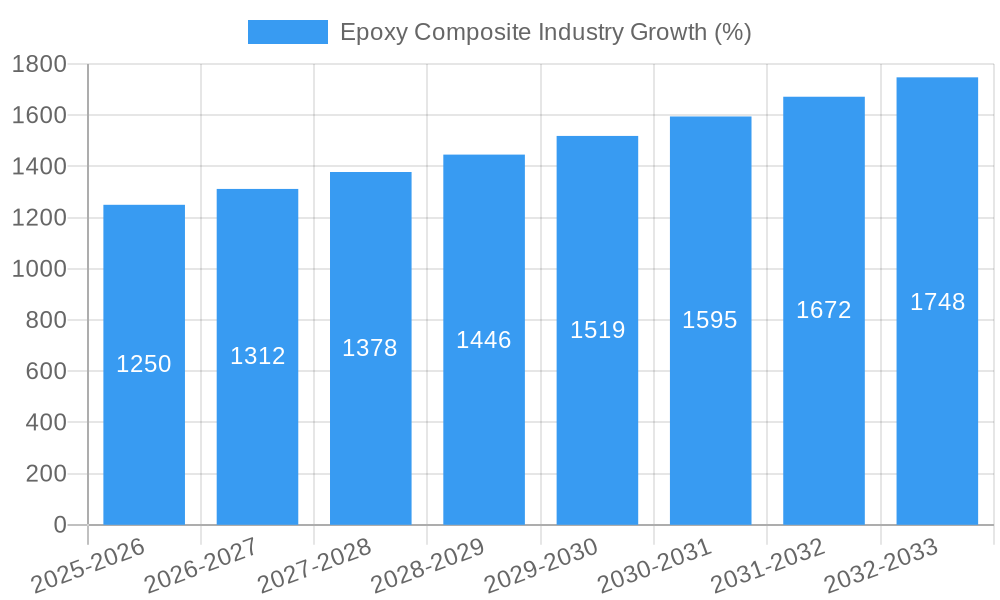
The global epoxy composite market is experiencing robust growth, projected to maintain a CAGR exceeding 5% from 2025 to 2033. This expansion is driven by several key factors. The increasing demand for lightweight yet high-strength materials across diverse sectors, including aerospace & defense, automotive & transportation, and wind energy, is a major catalyst. The superior mechanical properties of epoxy composites, coupled with their design flexibility and cost-effectiveness compared to traditional materials in certain applications, are fueling market penetration. Furthermore, ongoing advancements in epoxy resin formulations, leading to improved performance characteristics like enhanced durability and thermal resistance, are attracting new applications and driving innovation within the industry. The Asia-Pacific region, particularly China and India, is expected to lead market growth due to rapid industrialization and infrastructure development in these economies, creating substantial demand for advanced composite materials. While raw material price fluctuations and potential environmental concerns related to manufacturing processes pose challenges, the overall market outlook remains positive, driven by sustained technological advancements and expanding end-use applications.
The market segmentation reveals a strong presence of glass fiber-reinforced epoxy composites, though carbon fiber composites are gaining traction owing to their superior strength-to-weight ratio and are increasingly preferred in high-performance applications. The aerospace and defense sectors currently represent a significant portion of the market, benefiting from the lightweight and high-strength characteristics of epoxy composites, critical for fuel efficiency and enhanced performance. However, the automotive and wind energy sectors are expected to witness faster growth, as manufacturers seek to reduce vehicle weight and improve turbine blade efficiency. Key players in the market, such as SGL Carbon, Mitsubishi Chemical Corporation, and Hexcel Corporation, are focusing on R&D to develop innovative products and expand their market reach through strategic partnerships and acquisitions. The competitive landscape is characterized by both established players and emerging companies, fostering innovation and ensuring a dynamic market evolution.
Epoxy Composite Industry Market Report: 2019-2033
This comprehensive report provides a detailed analysis of the Epoxy Composite Industry, offering invaluable insights for industry professionals, investors, and strategic decision-makers. Covering the period 2019-2033, with a focus on 2025, this report meticulously examines market dynamics, growth trends, regional dominance, product landscape, challenges, opportunities, and key players. The report leverages extensive data analysis to provide a robust forecast for the Epoxy Composite market, segmented by fiber type (glass, carbon, others), end-user industry (aerospace & defense, automotive & transportation, electrical & electronics, wind energy, sporting goods, others), and geographic location. The total market value is projected to reach xx Million by 2033.
Epoxy Composite Industry Market Dynamics & Structure
This section analyzes the competitive landscape of the Epoxy Composite market, evaluating market concentration, technological advancements, regulatory influences, and competitive substitutions. We explore end-user demographics and M&A activities to provide a holistic understanding of the market structure. The study period is 2019-2033, with 2025 as the base and estimated year.
- Market Concentration: The Epoxy Composite market exhibits a moderately concentrated structure, with the top five players holding an estimated xx% market share in 2025. This concentration is expected to shift slightly by 2033 due to anticipated M&A activity and the emergence of new players.
- Technological Innovation: Continuous innovation in fiber technology, resin systems, and manufacturing processes drives market growth. However, high R&D costs and complex manufacturing processes present barriers to entry for new players.
- Regulatory Framework: Stringent environmental regulations regarding VOC emissions and material safety impact material selection and manufacturing processes. Compliance costs represent a significant challenge for smaller companies.
- Competitive Substitutes: Alternative materials like thermoplastics and metal composites pose a competitive threat, especially in cost-sensitive applications. However, Epoxy Composites retain a competitive edge in terms of strength-to-weight ratio and design flexibility.
- End-User Demographics: The aerospace & defense sector remains a major consumer, followed by automotive and wind energy. Growth in these sectors directly correlates with Epoxy Composite demand.
- M&A Trends: The past five years have witnessed xx M&A deals in the Epoxy Composite industry, primarily driven by strategic acquisitions aimed at expanding product portfolios and geographical reach. This trend is expected to continue.
Epoxy Composite Industry Growth Trends & Insights
This section provides a detailed analysis of the Epoxy Composite market's size evolution, adoption rates, technological disruptions, and consumer behavior shifts, utilizing advanced analytical methodologies to generate precise insights. The report highlights the Compound Annual Growth Rate (CAGR) and market penetration across various segments.
The global Epoxy Composite market size was valued at xx Million in 2024 and is projected to reach xx Million by 2033, exhibiting a CAGR of xx% during the forecast period (2025-2033). This robust growth is fueled by increasing demand from the aerospace and automotive sectors, driven by lightweighting initiatives and stringent fuel efficiency standards. Technological advancements such as the development of high-performance resins and improved manufacturing techniques further contribute to market expansion. Shifting consumer preferences towards sustainable and eco-friendly materials are also creating new opportunities within the market. The market penetration rate for Epoxy Composites in key end-user industries is expected to increase significantly over the forecast period, driven by the advantages offered by these materials in terms of strength, durability, and lightweight properties.
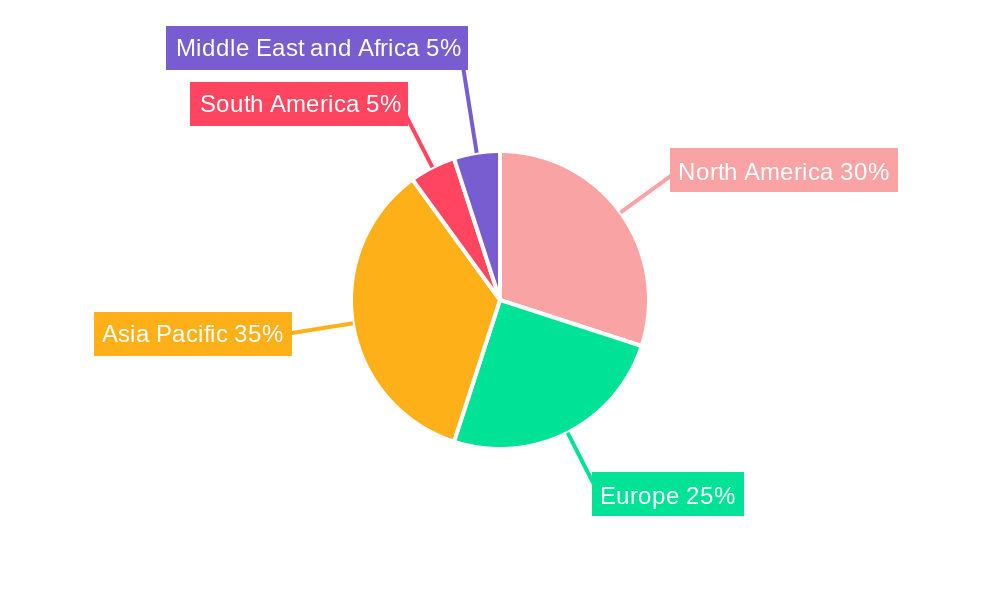
Dominant Regions, Countries, or Segments in Epoxy Composite Industry
This section identifies the leading regions, countries, and segments driving market growth. North America currently holds the largest market share, followed by Europe and Asia-Pacific. Within fiber types, carbon fiber composites represent the highest value segment, driven by its superior mechanical properties. The aerospace and defense sector dominates end-user applications.
- North America: Strong aerospace and defense industries, coupled with supportive government policies, contribute to the region's dominance.
- Europe: The automotive sector and renewable energy initiatives fuel growth within this region.
- Asia-Pacific: Rapid industrialization and infrastructure development are driving significant demand.
- Carbon Fiber: Superior strength-to-weight ratio and high performance characteristics propel the segment's growth.
- Aerospace & Defense: Stringent demands for lightweight and high-strength materials make this sector a major driver of market growth.
Epoxy Composite Industry Product Landscape
The Epoxy Composite market offers a diverse range of products, tailored to specific application requirements. Innovations focus on enhancing mechanical properties, improving durability, and reducing manufacturing costs. Key advancements include the development of high-temperature resins, nano-modified composites, and self-healing materials. These advancements are improving the performance and expanding the application range of Epoxy Composites, offering unique selling propositions such as enhanced strength, stiffness, and fatigue resistance compared to traditional materials.
Key Drivers, Barriers & Challenges in Epoxy Composite Industry
Key Drivers:
- Increasing demand from the aerospace and automotive sectors for lightweight materials.
- Growing adoption of renewable energy technologies, particularly wind energy.
- Technological advancements in resin systems and manufacturing processes.
Key Challenges & Restraints:
- High raw material costs and fluctuating prices.
- Environmental concerns related to resin VOC emissions.
- Intense competition from alternative materials and manufacturing technologies. The impact of these challenges is estimated to reduce the market growth rate by approximately xx% over the forecast period.
Emerging Opportunities in Epoxy Composite Industry
- Expansion into untapped markets, such as construction and infrastructure.
- Development of innovative applications in areas such as medical implants and electronics.
- Growing demand for sustainable and recyclable Epoxy Composites.
Growth Accelerators in the Epoxy Composite Industry Industry
Technological breakthroughs in resin chemistry, advancements in manufacturing techniques, and strategic partnerships between material suppliers and end-users are key catalysts driving long-term growth. Market expansion into emerging economies and the development of new applications in rapidly growing industries contribute further.
Key Players Shaping the Epoxy Composite Market
- SGL Carbon
- Mitsubishi Chemical Corporation
- Park Aerospace Corp
- Sanders Composites
- Axiom Materials
- Barrday
- Veplas d.d.
- Hexcel Corporation
Notable Milestones in Epoxy Composite Industry Sector
- 2020: Introduction of a new bio-based epoxy resin by Company X.
- 2022: Merger between Company Y and Company Z, expanding market reach.
- 2023: Launch of a high-temperature epoxy composite by Company A, broadening application possibilities.
In-Depth Epoxy Composite Industry Market Outlook
The Epoxy Composite market is poised for continued growth, driven by increasing demand from key end-user industries and ongoing technological advancements. Strategic partnerships, expansion into new markets, and the development of sustainable materials will further fuel this growth, creating significant opportunities for industry players. The market is anticipated to reach a value of xx Million by 2033, presenting lucrative prospects for both established and emerging companies in the sector.
Epoxy Composite Industry Segmentation
-
1. Fiber Type
- 1.1. Glass
- 1.2. Carbon
- 1.3. Other Fiber Types
-
2. End-user Industry
- 2.1. Aerospace and Defense
- 2.2. Automotive and Transportation
- 2.3. Electrical and Electronics
- 2.4. Wind Energy
- 2.5. Sporting Goods
- 2.6. Other End-user Industries
Epoxy Composite Industry Segmentation By Geography
-
1. Asia Pacific
- 1.1. China
- 1.2. India
- 1.3. Japan
- 1.4. South Korea
- 1.5. Malaysia
- 1.6. Thailand
- 1.7. Indonesia
- 1.8. Vietnam
- 1.9. Rest of Asia Pacific
-
2. North America
- 2.1. United States
- 2.2. Canada
- 2.3. Mexico
-
3. Europe
- 3.1. Germany
- 3.2. United Kingdom
- 3.3. Italy
- 3.4. France
- 3.5. Spain
- 3.6. NORDIC Countries
- 3.7. Turkey
- 3.8. Russia
- 3.9. Rest of Europe
-
4. South America
- 4.1. Brazil
- 4.2. Argentina
- 4.3. Colombia
- 4.4. Rest of South America
-
5. Middle East and Africa
- 5.1. Saudi Arabia
- 5.2. South Africa
- 5.3. Nigeria
- 5.4. Qatar
- 5.5. Egypt
- 5.6. United Arab Emirates
- 5.7. Rest of Middle East and Africa
Epoxy Composite Industry REPORT HIGHLIGHTS
| Aspects | Details |
|---|---|
| Study Period | 2019-2033 |
| Base Year | 2024 |
| Estimated Year | 2025 |
| Forecast Period | 2025-2033 |
| Historical Period | 2019-2024 |
| Growth Rate | CAGR of > 5.00% from 2019-2033 |
| Segmentation |
|
Table of Contents
- 1. Introduction
- 1.1. Research Scope
- 1.2. Market Segmentation
- 1.3. Research Methodology
- 1.4. Definitions and Assumptions
- 2. Executive Summary
- 2.1. Introduction
- 3. Market Dynamics
- 3.1. Introduction
- 3.2. Market Drivers
- 3.2.1. Growing Demand from the Wind Energy Sector; Other Drivers
- 3.3. Market Restrains
- 3.3.1. Availability of Close Substitutes; Unfavorable Conditions Arising Due to COVID-19 Outbreak
- 3.4. Market Trends
- 3.4.1. Growing Demand from the Aerospace and Defense Industry
- 4. Market Factor Analysis
- 4.1. Porters Five Forces
- 4.2. Supply/Value Chain
- 4.3. PESTEL analysis
- 4.4. Market Entropy
- 4.5. Patent/Trademark Analysis
- 5. Global Epoxy Composite Industry Analysis, Insights and Forecast, 2019-2031
- 5.1. Market Analysis, Insights and Forecast - by Fiber Type
- 5.1.1. Glass
- 5.1.2. Carbon
- 5.1.3. Other Fiber Types
- 5.2. Market Analysis, Insights and Forecast - by End-user Industry
- 5.2.1. Aerospace and Defense
- 5.2.2. Automotive and Transportation
- 5.2.3. Electrical and Electronics
- 5.2.4. Wind Energy
- 5.2.5. Sporting Goods
- 5.2.6. Other End-user Industries
- 5.3. Market Analysis, Insights and Forecast - by Region
- 5.3.1. Asia Pacific
- 5.3.2. North America
- 5.3.3. Europe
- 5.3.4. South America
- 5.3.5. Middle East and Africa
- 5.1. Market Analysis, Insights and Forecast - by Fiber Type
- 6. Asia Pacific Epoxy Composite Industry Analysis, Insights and Forecast, 2019-2031
- 6.1. Market Analysis, Insights and Forecast - by Fiber Type
- 6.1.1. Glass
- 6.1.2. Carbon
- 6.1.3. Other Fiber Types
- 6.2. Market Analysis, Insights and Forecast - by End-user Industry
- 6.2.1. Aerospace and Defense
- 6.2.2. Automotive and Transportation
- 6.2.3. Electrical and Electronics
- 6.2.4. Wind Energy
- 6.2.5. Sporting Goods
- 6.2.6. Other End-user Industries
- 6.1. Market Analysis, Insights and Forecast - by Fiber Type
- 7. North America Epoxy Composite Industry Analysis, Insights and Forecast, 2019-2031
- 7.1. Market Analysis, Insights and Forecast - by Fiber Type
- 7.1.1. Glass
- 7.1.2. Carbon
- 7.1.3. Other Fiber Types
- 7.2. Market Analysis, Insights and Forecast - by End-user Industry
- 7.2.1. Aerospace and Defense
- 7.2.2. Automotive and Transportation
- 7.2.3. Electrical and Electronics
- 7.2.4. Wind Energy
- 7.2.5. Sporting Goods
- 7.2.6. Other End-user Industries
- 7.1. Market Analysis, Insights and Forecast - by Fiber Type
- 8. Europe Epoxy Composite Industry Analysis, Insights and Forecast, 2019-2031
- 8.1. Market Analysis, Insights and Forecast - by Fiber Type
- 8.1.1. Glass
- 8.1.2. Carbon
- 8.1.3. Other Fiber Types
- 8.2. Market Analysis, Insights and Forecast - by End-user Industry
- 8.2.1. Aerospace and Defense
- 8.2.2. Automotive and Transportation
- 8.2.3. Electrical and Electronics
- 8.2.4. Wind Energy
- 8.2.5. Sporting Goods
- 8.2.6. Other End-user Industries
- 8.1. Market Analysis, Insights and Forecast - by Fiber Type
- 9. South America Epoxy Composite Industry Analysis, Insights and Forecast, 2019-2031
- 9.1. Market Analysis, Insights and Forecast - by Fiber Type
- 9.1.1. Glass
- 9.1.2. Carbon
- 9.1.3. Other Fiber Types
- 9.2. Market Analysis, Insights and Forecast - by End-user Industry
- 9.2.1. Aerospace and Defense
- 9.2.2. Automotive and Transportation
- 9.2.3. Electrical and Electronics
- 9.2.4. Wind Energy
- 9.2.5. Sporting Goods
- 9.2.6. Other End-user Industries
- 9.1. Market Analysis, Insights and Forecast - by Fiber Type
- 10. Middle East and Africa Epoxy Composite Industry Analysis, Insights and Forecast, 2019-2031
- 10.1. Market Analysis, Insights and Forecast - by Fiber Type
- 10.1.1. Glass
- 10.1.2. Carbon
- 10.1.3. Other Fiber Types
- 10.2. Market Analysis, Insights and Forecast - by End-user Industry
- 10.2.1. Aerospace and Defense
- 10.2.2. Automotive and Transportation
- 10.2.3. Electrical and Electronics
- 10.2.4. Wind Energy
- 10.2.5. Sporting Goods
- 10.2.6. Other End-user Industries
- 10.1. Market Analysis, Insights and Forecast - by Fiber Type
- 11. Asia Pacific Epoxy Composite Industry Analysis, Insights and Forecast, 2019-2031
- 11.1. Market Analysis, Insights and Forecast - By Country/Sub-region
- 11.1.1 China
- 11.1.2 India
- 11.1.3 Japan
- 11.1.4 South Korea
- 11.1.5 Rest of Asia Pacific
- 12. North America Epoxy Composite Industry Analysis, Insights and Forecast, 2019-2031
- 12.1. Market Analysis, Insights and Forecast - By Country/Sub-region
- 12.1.1 United States
- 12.1.2 Canada
- 12.1.3 Mexico
- 13. Europe Epoxy Composite Industry Analysis, Insights and Forecast, 2019-2031
- 13.1. Market Analysis, Insights and Forecast - By Country/Sub-region
- 13.1.1 Germany
- 13.1.2 United Kingdom
- 13.1.3 Italy
- 13.1.4 France
- 13.1.5 Rest of Europe
- 14. South America Epoxy Composite Industry Analysis, Insights and Forecast, 2019-2031
- 14.1. Market Analysis, Insights and Forecast - By Country/Sub-region
- 14.1.1 Brazil
- 14.1.2 Argentina
- 14.1.3 Rest of South America
- 15. Middle East and Africa Epoxy Composite Industry Analysis, Insights and Forecast, 2019-2031
- 15.1. Market Analysis, Insights and Forecast - By Country/Sub-region
- 15.1.1 Saudi Arabia
- 15.1.2 South Africa
- 15.1.3 Rest of Middle East and Africa
- 16. Competitive Analysis
- 16.1. Global Market Share Analysis 2024
- 16.2. Company Profiles
- 16.2.1 SGL Carbon
- 16.2.1.1. Overview
- 16.2.1.2. Products
- 16.2.1.3. SWOT Analysis
- 16.2.1.4. Recent Developments
- 16.2.1.5. Financials (Based on Availability)
- 16.2.2 Mitsubishi Chemical Corporation
- 16.2.2.1. Overview
- 16.2.2.2. Products
- 16.2.2.3. SWOT Analysis
- 16.2.2.4. Recent Developments
- 16.2.2.5. Financials (Based on Availability)
- 16.2.3 Park Aerospace Corp
- 16.2.3.1. Overview
- 16.2.3.2. Products
- 16.2.3.3. SWOT Analysis
- 16.2.3.4. Recent Developments
- 16.2.3.5. Financials (Based on Availability)
- 16.2.4 Sanders Composites
- 16.2.4.1. Overview
- 16.2.4.2. Products
- 16.2.4.3. SWOT Analysis
- 16.2.4.4. Recent Developments
- 16.2.4.5. Financials (Based on Availability)
- 16.2.5 Axiom Materials
- 16.2.5.1. Overview
- 16.2.5.2. Products
- 16.2.5.3. SWOT Analysis
- 16.2.5.4. Recent Developments
- 16.2.5.5. Financials (Based on Availability)
- 16.2.6 Barrday
- 16.2.6.1. Overview
- 16.2.6.2. Products
- 16.2.6.3. SWOT Analysis
- 16.2.6.4. Recent Developments
- 16.2.6.5. Financials (Based on Availability)
- 16.2.7 Veplas d d
- 16.2.7.1. Overview
- 16.2.7.2. Products
- 16.2.7.3. SWOT Analysis
- 16.2.7.4. Recent Developments
- 16.2.7.5. Financials (Based on Availability)
- 16.2.8 Hexcel Corporation
- 16.2.8.1. Overview
- 16.2.8.2. Products
- 16.2.8.3. SWOT Analysis
- 16.2.8.4. Recent Developments
- 16.2.8.5. Financials (Based on Availability)
- 16.2.1 SGL Carbon
List of Figures
- Figure 1: Global Epoxy Composite Industry Revenue Breakdown (Million, %) by Region 2024 & 2032
- Figure 2: Global Epoxy Composite Industry Volume Breakdown (K Tons, %) by Region 2024 & 2032
- Figure 3: Asia Pacific Epoxy Composite Industry Revenue (Million), by Country 2024 & 2032
- Figure 4: Asia Pacific Epoxy Composite Industry Volume (K Tons), by Country 2024 & 2032
- Figure 5: Asia Pacific Epoxy Composite Industry Revenue Share (%), by Country 2024 & 2032
- Figure 6: Asia Pacific Epoxy Composite Industry Volume Share (%), by Country 2024 & 2032
- Figure 7: North America Epoxy Composite Industry Revenue (Million), by Country 2024 & 2032
- Figure 8: North America Epoxy Composite Industry Volume (K Tons), by Country 2024 & 2032
- Figure 9: North America Epoxy Composite Industry Revenue Share (%), by Country 2024 & 2032
- Figure 10: North America Epoxy Composite Industry Volume Share (%), by Country 2024 & 2032
- Figure 11: Europe Epoxy Composite Industry Revenue (Million), by Country 2024 & 2032
- Figure 12: Europe Epoxy Composite Industry Volume (K Tons), by Country 2024 & 2032
- Figure 13: Europe Epoxy Composite Industry Revenue Share (%), by Country 2024 & 2032
- Figure 14: Europe Epoxy Composite Industry Volume Share (%), by Country 2024 & 2032
- Figure 15: South America Epoxy Composite Industry Revenue (Million), by Country 2024 & 2032
- Figure 16: South America Epoxy Composite Industry Volume (K Tons), by Country 2024 & 2032
- Figure 17: South America Epoxy Composite Industry Revenue Share (%), by Country 2024 & 2032
- Figure 18: South America Epoxy Composite Industry Volume Share (%), by Country 2024 & 2032
- Figure 19: Middle East and Africa Epoxy Composite Industry Revenue (Million), by Country 2024 & 2032
- Figure 20: Middle East and Africa Epoxy Composite Industry Volume (K Tons), by Country 2024 & 2032
- Figure 21: Middle East and Africa Epoxy Composite Industry Revenue Share (%), by Country 2024 & 2032
- Figure 22: Middle East and Africa Epoxy Composite Industry Volume Share (%), by Country 2024 & 2032
- Figure 23: Asia Pacific Epoxy Composite Industry Revenue (Million), by Fiber Type 2024 & 2032
- Figure 24: Asia Pacific Epoxy Composite Industry Volume (K Tons), by Fiber Type 2024 & 2032
- Figure 25: Asia Pacific Epoxy Composite Industry Revenue Share (%), by Fiber Type 2024 & 2032
- Figure 26: Asia Pacific Epoxy Composite Industry Volume Share (%), by Fiber Type 2024 & 2032
- Figure 27: Asia Pacific Epoxy Composite Industry Revenue (Million), by End-user Industry 2024 & 2032
- Figure 28: Asia Pacific Epoxy Composite Industry Volume (K Tons), by End-user Industry 2024 & 2032
- Figure 29: Asia Pacific Epoxy Composite Industry Revenue Share (%), by End-user Industry 2024 & 2032
- Figure 30: Asia Pacific Epoxy Composite Industry Volume Share (%), by End-user Industry 2024 & 2032
- Figure 31: Asia Pacific Epoxy Composite Industry Revenue (Million), by Country 2024 & 2032
- Figure 32: Asia Pacific Epoxy Composite Industry Volume (K Tons), by Country 2024 & 2032
- Figure 33: Asia Pacific Epoxy Composite Industry Revenue Share (%), by Country 2024 & 2032
- Figure 34: Asia Pacific Epoxy Composite Industry Volume Share (%), by Country 2024 & 2032
- Figure 35: North America Epoxy Composite Industry Revenue (Million), by Fiber Type 2024 & 2032
- Figure 36: North America Epoxy Composite Industry Volume (K Tons), by Fiber Type 2024 & 2032
- Figure 37: North America Epoxy Composite Industry Revenue Share (%), by Fiber Type 2024 & 2032
- Figure 38: North America Epoxy Composite Industry Volume Share (%), by Fiber Type 2024 & 2032
- Figure 39: North America Epoxy Composite Industry Revenue (Million), by End-user Industry 2024 & 2032
- Figure 40: North America Epoxy Composite Industry Volume (K Tons), by End-user Industry 2024 & 2032
- Figure 41: North America Epoxy Composite Industry Revenue Share (%), by End-user Industry 2024 & 2032
- Figure 42: North America Epoxy Composite Industry Volume Share (%), by End-user Industry 2024 & 2032
- Figure 43: North America Epoxy Composite Industry Revenue (Million), by Country 2024 & 2032
- Figure 44: North America Epoxy Composite Industry Volume (K Tons), by Country 2024 & 2032
- Figure 45: North America Epoxy Composite Industry Revenue Share (%), by Country 2024 & 2032
- Figure 46: North America Epoxy Composite Industry Volume Share (%), by Country 2024 & 2032
- Figure 47: Europe Epoxy Composite Industry Revenue (Million), by Fiber Type 2024 & 2032
- Figure 48: Europe Epoxy Composite Industry Volume (K Tons), by Fiber Type 2024 & 2032
- Figure 49: Europe Epoxy Composite Industry Revenue Share (%), by Fiber Type 2024 & 2032
- Figure 50: Europe Epoxy Composite Industry Volume Share (%), by Fiber Type 2024 & 2032
- Figure 51: Europe Epoxy Composite Industry Revenue (Million), by End-user Industry 2024 & 2032
- Figure 52: Europe Epoxy Composite Industry Volume (K Tons), by End-user Industry 2024 & 2032
- Figure 53: Europe Epoxy Composite Industry Revenue Share (%), by End-user Industry 2024 & 2032
- Figure 54: Europe Epoxy Composite Industry Volume Share (%), by End-user Industry 2024 & 2032
- Figure 55: Europe Epoxy Composite Industry Revenue (Million), by Country 2024 & 2032
- Figure 56: Europe Epoxy Composite Industry Volume (K Tons), by Country 2024 & 2032
- Figure 57: Europe Epoxy Composite Industry Revenue Share (%), by Country 2024 & 2032
- Figure 58: Europe Epoxy Composite Industry Volume Share (%), by Country 2024 & 2032
- Figure 59: South America Epoxy Composite Industry Revenue (Million), by Fiber Type 2024 & 2032
- Figure 60: South America Epoxy Composite Industry Volume (K Tons), by Fiber Type 2024 & 2032
- Figure 61: South America Epoxy Composite Industry Revenue Share (%), by Fiber Type 2024 & 2032
- Figure 62: South America Epoxy Composite Industry Volume Share (%), by Fiber Type 2024 & 2032
- Figure 63: South America Epoxy Composite Industry Revenue (Million), by End-user Industry 2024 & 2032
- Figure 64: South America Epoxy Composite Industry Volume (K Tons), by End-user Industry 2024 & 2032
- Figure 65: South America Epoxy Composite Industry Revenue Share (%), by End-user Industry 2024 & 2032
- Figure 66: South America Epoxy Composite Industry Volume Share (%), by End-user Industry 2024 & 2032
- Figure 67: South America Epoxy Composite Industry Revenue (Million), by Country 2024 & 2032
- Figure 68: South America Epoxy Composite Industry Volume (K Tons), by Country 2024 & 2032
- Figure 69: South America Epoxy Composite Industry Revenue Share (%), by Country 2024 & 2032
- Figure 70: South America Epoxy Composite Industry Volume Share (%), by Country 2024 & 2032
- Figure 71: Middle East and Africa Epoxy Composite Industry Revenue (Million), by Fiber Type 2024 & 2032
- Figure 72: Middle East and Africa Epoxy Composite Industry Volume (K Tons), by Fiber Type 2024 & 2032
- Figure 73: Middle East and Africa Epoxy Composite Industry Revenue Share (%), by Fiber Type 2024 & 2032
- Figure 74: Middle East and Africa Epoxy Composite Industry Volume Share (%), by Fiber Type 2024 & 2032
- Figure 75: Middle East and Africa Epoxy Composite Industry Revenue (Million), by End-user Industry 2024 & 2032
- Figure 76: Middle East and Africa Epoxy Composite Industry Volume (K Tons), by End-user Industry 2024 & 2032
- Figure 77: Middle East and Africa Epoxy Composite Industry Revenue Share (%), by End-user Industry 2024 & 2032
- Figure 78: Middle East and Africa Epoxy Composite Industry Volume Share (%), by End-user Industry 2024 & 2032
- Figure 79: Middle East and Africa Epoxy Composite Industry Revenue (Million), by Country 2024 & 2032
- Figure 80: Middle East and Africa Epoxy Composite Industry Volume (K Tons), by Country 2024 & 2032
- Figure 81: Middle East and Africa Epoxy Composite Industry Revenue Share (%), by Country 2024 & 2032
- Figure 82: Middle East and Africa Epoxy Composite Industry Volume Share (%), by Country 2024 & 2032
List of Tables
- Table 1: Global Epoxy Composite Industry Revenue Million Forecast, by Region 2019 & 2032
- Table 2: Global Epoxy Composite Industry Volume K Tons Forecast, by Region 2019 & 2032
- Table 3: Global Epoxy Composite Industry Revenue Million Forecast, by Fiber Type 2019 & 2032
- Table 4: Global Epoxy Composite Industry Volume K Tons Forecast, by Fiber Type 2019 & 2032
- Table 5: Global Epoxy Composite Industry Revenue Million Forecast, by End-user Industry 2019 & 2032
- Table 6: Global Epoxy Composite Industry Volume K Tons Forecast, by End-user Industry 2019 & 2032
- Table 7: Global Epoxy Composite Industry Revenue Million Forecast, by Region 2019 & 2032
- Table 8: Global Epoxy Composite Industry Volume K Tons Forecast, by Region 2019 & 2032
- Table 9: Global Epoxy Composite Industry Revenue Million Forecast, by Country 2019 & 2032
- Table 10: Global Epoxy Composite Industry Volume K Tons Forecast, by Country 2019 & 2032
- Table 11: China Epoxy Composite Industry Revenue (Million) Forecast, by Application 2019 & 2032
- Table 12: China Epoxy Composite Industry Volume (K Tons) Forecast, by Application 2019 & 2032
- Table 13: India Epoxy Composite Industry Revenue (Million) Forecast, by Application 2019 & 2032
- Table 14: India Epoxy Composite Industry Volume (K Tons) Forecast, by Application 2019 & 2032
- Table 15: Japan Epoxy Composite Industry Revenue (Million) Forecast, by Application 2019 & 2032
- Table 16: Japan Epoxy Composite Industry Volume (K Tons) Forecast, by Application 2019 & 2032
- Table 17: South Korea Epoxy Composite Industry Revenue (Million) Forecast, by Application 2019 & 2032
- Table 18: South Korea Epoxy Composite Industry Volume (K Tons) Forecast, by Application 2019 & 2032
- Table 19: Rest of Asia Pacific Epoxy Composite Industry Revenue (Million) Forecast, by Application 2019 & 2032
- Table 20: Rest of Asia Pacific Epoxy Composite Industry Volume (K Tons) Forecast, by Application 2019 & 2032
- Table 21: Global Epoxy Composite Industry Revenue Million Forecast, by Country 2019 & 2032
- Table 22: Global Epoxy Composite Industry Volume K Tons Forecast, by Country 2019 & 2032
- Table 23: United States Epoxy Composite Industry Revenue (Million) Forecast, by Application 2019 & 2032
- Table 24: United States Epoxy Composite Industry Volume (K Tons) Forecast, by Application 2019 & 2032
- Table 25: Canada Epoxy Composite Industry Revenue (Million) Forecast, by Application 2019 & 2032
- Table 26: Canada Epoxy Composite Industry Volume (K Tons) Forecast, by Application 2019 & 2032
- Table 27: Mexico Epoxy Composite Industry Revenue (Million) Forecast, by Application 2019 & 2032
- Table 28: Mexico Epoxy Composite Industry Volume (K Tons) Forecast, by Application 2019 & 2032
- Table 29: Global Epoxy Composite Industry Revenue Million Forecast, by Country 2019 & 2032
- Table 30: Global Epoxy Composite Industry Volume K Tons Forecast, by Country 2019 & 2032
- Table 31: Germany Epoxy Composite Industry Revenue (Million) Forecast, by Application 2019 & 2032
- Table 32: Germany Epoxy Composite Industry Volume (K Tons) Forecast, by Application 2019 & 2032
- Table 33: United Kingdom Epoxy Composite Industry Revenue (Million) Forecast, by Application 2019 & 2032
- Table 34: United Kingdom Epoxy Composite Industry Volume (K Tons) Forecast, by Application 2019 & 2032
- Table 35: Italy Epoxy Composite Industry Revenue (Million) Forecast, by Application 2019 & 2032
- Table 36: Italy Epoxy Composite Industry Volume (K Tons) Forecast, by Application 2019 & 2032
- Table 37: France Epoxy Composite Industry Revenue (Million) Forecast, by Application 2019 & 2032
- Table 38: France Epoxy Composite Industry Volume (K Tons) Forecast, by Application 2019 & 2032
- Table 39: Rest of Europe Epoxy Composite Industry Revenue (Million) Forecast, by Application 2019 & 2032
- Table 40: Rest of Europe Epoxy Composite Industry Volume (K Tons) Forecast, by Application 2019 & 2032
- Table 41: Global Epoxy Composite Industry Revenue Million Forecast, by Country 2019 & 2032
- Table 42: Global Epoxy Composite Industry Volume K Tons Forecast, by Country 2019 & 2032
- Table 43: Brazil Epoxy Composite Industry Revenue (Million) Forecast, by Application 2019 & 2032
- Table 44: Brazil Epoxy Composite Industry Volume (K Tons) Forecast, by Application 2019 & 2032
- Table 45: Argentina Epoxy Composite Industry Revenue (Million) Forecast, by Application 2019 & 2032
- Table 46: Argentina Epoxy Composite Industry Volume (K Tons) Forecast, by Application 2019 & 2032
- Table 47: Rest of South America Epoxy Composite Industry Revenue (Million) Forecast, by Application 2019 & 2032
- Table 48: Rest of South America Epoxy Composite Industry Volume (K Tons) Forecast, by Application 2019 & 2032
- Table 49: Global Epoxy Composite Industry Revenue Million Forecast, by Country 2019 & 2032
- Table 50: Global Epoxy Composite Industry Volume K Tons Forecast, by Country 2019 & 2032
- Table 51: Saudi Arabia Epoxy Composite Industry Revenue (Million) Forecast, by Application 2019 & 2032
- Table 52: Saudi Arabia Epoxy Composite Industry Volume (K Tons) Forecast, by Application 2019 & 2032
- Table 53: South Africa Epoxy Composite Industry Revenue (Million) Forecast, by Application 2019 & 2032
- Table 54: South Africa Epoxy Composite Industry Volume (K Tons) Forecast, by Application 2019 & 2032
- Table 55: Rest of Middle East and Africa Epoxy Composite Industry Revenue (Million) Forecast, by Application 2019 & 2032
- Table 56: Rest of Middle East and Africa Epoxy Composite Industry Volume (K Tons) Forecast, by Application 2019 & 2032
- Table 57: Global Epoxy Composite Industry Revenue Million Forecast, by Fiber Type 2019 & 2032
- Table 58: Global Epoxy Composite Industry Volume K Tons Forecast, by Fiber Type 2019 & 2032
- Table 59: Global Epoxy Composite Industry Revenue Million Forecast, by End-user Industry 2019 & 2032
- Table 60: Global Epoxy Composite Industry Volume K Tons Forecast, by End-user Industry 2019 & 2032
- Table 61: Global Epoxy Composite Industry Revenue Million Forecast, by Country 2019 & 2032
- Table 62: Global Epoxy Composite Industry Volume K Tons Forecast, by Country 2019 & 2032
- Table 63: China Epoxy Composite Industry Revenue (Million) Forecast, by Application 2019 & 2032
- Table 64: China Epoxy Composite Industry Volume (K Tons) Forecast, by Application 2019 & 2032
- Table 65: India Epoxy Composite Industry Revenue (Million) Forecast, by Application 2019 & 2032
- Table 66: India Epoxy Composite Industry Volume (K Tons) Forecast, by Application 2019 & 2032
- Table 67: Japan Epoxy Composite Industry Revenue (Million) Forecast, by Application 2019 & 2032
- Table 68: Japan Epoxy Composite Industry Volume (K Tons) Forecast, by Application 2019 & 2032
- Table 69: South Korea Epoxy Composite Industry Revenue (Million) Forecast, by Application 2019 & 2032
- Table 70: South Korea Epoxy Composite Industry Volume (K Tons) Forecast, by Application 2019 & 2032
- Table 71: Malaysia Epoxy Composite Industry Revenue (Million) Forecast, by Application 2019 & 2032
- Table 72: Malaysia Epoxy Composite Industry Volume (K Tons) Forecast, by Application 2019 & 2032
- Table 73: Thailand Epoxy Composite Industry Revenue (Million) Forecast, by Application 2019 & 2032
- Table 74: Thailand Epoxy Composite Industry Volume (K Tons) Forecast, by Application 2019 & 2032
- Table 75: Indonesia Epoxy Composite Industry Revenue (Million) Forecast, by Application 2019 & 2032
- Table 76: Indonesia Epoxy Composite Industry Volume (K Tons) Forecast, by Application 2019 & 2032
- Table 77: Vietnam Epoxy Composite Industry Revenue (Million) Forecast, by Application 2019 & 2032
- Table 78: Vietnam Epoxy Composite Industry Volume (K Tons) Forecast, by Application 2019 & 2032
- Table 79: Rest of Asia Pacific Epoxy Composite Industry Revenue (Million) Forecast, by Application 2019 & 2032
- Table 80: Rest of Asia Pacific Epoxy Composite Industry Volume (K Tons) Forecast, by Application 2019 & 2032
- Table 81: Global Epoxy Composite Industry Revenue Million Forecast, by Fiber Type 2019 & 2032
- Table 82: Global Epoxy Composite Industry Volume K Tons Forecast, by Fiber Type 2019 & 2032
- Table 83: Global Epoxy Composite Industry Revenue Million Forecast, by End-user Industry 2019 & 2032
- Table 84: Global Epoxy Composite Industry Volume K Tons Forecast, by End-user Industry 2019 & 2032
- Table 85: Global Epoxy Composite Industry Revenue Million Forecast, by Country 2019 & 2032
- Table 86: Global Epoxy Composite Industry Volume K Tons Forecast, by Country 2019 & 2032
- Table 87: United States Epoxy Composite Industry Revenue (Million) Forecast, by Application 2019 & 2032
- Table 88: United States Epoxy Composite Industry Volume (K Tons) Forecast, by Application 2019 & 2032
- Table 89: Canada Epoxy Composite Industry Revenue (Million) Forecast, by Application 2019 & 2032
- Table 90: Canada Epoxy Composite Industry Volume (K Tons) Forecast, by Application 2019 & 2032
- Table 91: Mexico Epoxy Composite Industry Revenue (Million) Forecast, by Application 2019 & 2032
- Table 92: Mexico Epoxy Composite Industry Volume (K Tons) Forecast, by Application 2019 & 2032
- Table 93: Global Epoxy Composite Industry Revenue Million Forecast, by Fiber Type 2019 & 2032
- Table 94: Global Epoxy Composite Industry Volume K Tons Forecast, by Fiber Type 2019 & 2032
- Table 95: Global Epoxy Composite Industry Revenue Million Forecast, by End-user Industry 2019 & 2032
- Table 96: Global Epoxy Composite Industry Volume K Tons Forecast, by End-user Industry 2019 & 2032
- Table 97: Global Epoxy Composite Industry Revenue Million Forecast, by Country 2019 & 2032
- Table 98: Global Epoxy Composite Industry Volume K Tons Forecast, by Country 2019 & 2032
- Table 99: Germany Epoxy Composite Industry Revenue (Million) Forecast, by Application 2019 & 2032
- Table 100: Germany Epoxy Composite Industry Volume (K Tons) Forecast, by Application 2019 & 2032
- Table 101: United Kingdom Epoxy Composite Industry Revenue (Million) Forecast, by Application 2019 & 2032
- Table 102: United Kingdom Epoxy Composite Industry Volume (K Tons) Forecast, by Application 2019 & 2032
- Table 103: Italy Epoxy Composite Industry Revenue (Million) Forecast, by Application 2019 & 2032
- Table 104: Italy Epoxy Composite Industry Volume (K Tons) Forecast, by Application 2019 & 2032
- Table 105: France Epoxy Composite Industry Revenue (Million) Forecast, by Application 2019 & 2032
- Table 106: France Epoxy Composite Industry Volume (K Tons) Forecast, by Application 2019 & 2032
- Table 107: Spain Epoxy Composite Industry Revenue (Million) Forecast, by Application 2019 & 2032
- Table 108: Spain Epoxy Composite Industry Volume (K Tons) Forecast, by Application 2019 & 2032
- Table 109: NORDIC Countries Epoxy Composite Industry Revenue (Million) Forecast, by Application 2019 & 2032
- Table 110: NORDIC Countries Epoxy Composite Industry Volume (K Tons) Forecast, by Application 2019 & 2032
- Table 111: Turkey Epoxy Composite Industry Revenue (Million) Forecast, by Application 2019 & 2032
- Table 112: Turkey Epoxy Composite Industry Volume (K Tons) Forecast, by Application 2019 & 2032
- Table 113: Russia Epoxy Composite Industry Revenue (Million) Forecast, by Application 2019 & 2032
- Table 114: Russia Epoxy Composite Industry Volume (K Tons) Forecast, by Application 2019 & 2032
- Table 115: Rest of Europe Epoxy Composite Industry Revenue (Million) Forecast, by Application 2019 & 2032
- Table 116: Rest of Europe Epoxy Composite Industry Volume (K Tons) Forecast, by Application 2019 & 2032
- Table 117: Global Epoxy Composite Industry Revenue Million Forecast, by Fiber Type 2019 & 2032
- Table 118: Global Epoxy Composite Industry Volume K Tons Forecast, by Fiber Type 2019 & 2032
- Table 119: Global Epoxy Composite Industry Revenue Million Forecast, by End-user Industry 2019 & 2032
- Table 120: Global Epoxy Composite Industry Volume K Tons Forecast, by End-user Industry 2019 & 2032
- Table 121: Global Epoxy Composite Industry Revenue Million Forecast, by Country 2019 & 2032
- Table 122: Global Epoxy Composite Industry Volume K Tons Forecast, by Country 2019 & 2032
- Table 123: Brazil Epoxy Composite Industry Revenue (Million) Forecast, by Application 2019 & 2032
- Table 124: Brazil Epoxy Composite Industry Volume (K Tons) Forecast, by Application 2019 & 2032
- Table 125: Argentina Epoxy Composite Industry Revenue (Million) Forecast, by Application 2019 & 2032
- Table 126: Argentina Epoxy Composite Industry Volume (K Tons) Forecast, by Application 2019 & 2032
- Table 127: Colombia Epoxy Composite Industry Revenue (Million) Forecast, by Application 2019 & 2032
- Table 128: Colombia Epoxy Composite Industry Volume (K Tons) Forecast, by Application 2019 & 2032
- Table 129: Rest of South America Epoxy Composite Industry Revenue (Million) Forecast, by Application 2019 & 2032
- Table 130: Rest of South America Epoxy Composite Industry Volume (K Tons) Forecast, by Application 2019 & 2032
- Table 131: Global Epoxy Composite Industry Revenue Million Forecast, by Fiber Type 2019 & 2032
- Table 132: Global Epoxy Composite Industry Volume K Tons Forecast, by Fiber Type 2019 & 2032
- Table 133: Global Epoxy Composite Industry Revenue Million Forecast, by End-user Industry 2019 & 2032
- Table 134: Global Epoxy Composite Industry Volume K Tons Forecast, by End-user Industry 2019 & 2032
- Table 135: Global Epoxy Composite Industry Revenue Million Forecast, by Country 2019 & 2032
- Table 136: Global Epoxy Composite Industry Volume K Tons Forecast, by Country 2019 & 2032
- Table 137: Saudi Arabia Epoxy Composite Industry Revenue (Million) Forecast, by Application 2019 & 2032
- Table 138: Saudi Arabia Epoxy Composite Industry Volume (K Tons) Forecast, by Application 2019 & 2032
- Table 139: South Africa Epoxy Composite Industry Revenue (Million) Forecast, by Application 2019 & 2032
- Table 140: South Africa Epoxy Composite Industry Volume (K Tons) Forecast, by Application 2019 & 2032
- Table 141: Nigeria Epoxy Composite Industry Revenue (Million) Forecast, by Application 2019 & 2032
- Table 142: Nigeria Epoxy Composite Industry Volume (K Tons) Forecast, by Application 2019 & 2032
- Table 143: Qatar Epoxy Composite Industry Revenue (Million) Forecast, by Application 2019 & 2032
- Table 144: Qatar Epoxy Composite Industry Volume (K Tons) Forecast, by Application 2019 & 2032
- Table 145: Egypt Epoxy Composite Industry Revenue (Million) Forecast, by Application 2019 & 2032
- Table 146: Egypt Epoxy Composite Industry Volume (K Tons) Forecast, by Application 2019 & 2032
- Table 147: United Arab Emirates Epoxy Composite Industry Revenue (Million) Forecast, by Application 2019 & 2032
- Table 148: United Arab Emirates Epoxy Composite Industry Volume (K Tons) Forecast, by Application 2019 & 2032
- Table 149: Rest of Middle East and Africa Epoxy Composite Industry Revenue (Million) Forecast, by Application 2019 & 2032
- Table 150: Rest of Middle East and Africa Epoxy Composite Industry Volume (K Tons) Forecast, by Application 2019 & 2032
Frequently Asked Questions
1. What is the projected Compound Annual Growth Rate (CAGR) of the Epoxy Composite Industry?
The projected CAGR is approximately > 5.00%.
2. Which companies are prominent players in the Epoxy Composite Industry?
Key companies in the market include SGL Carbon, Mitsubishi Chemical Corporation, Park Aerospace Corp, Sanders Composites, Axiom Materials, Barrday, Veplas d d , Hexcel Corporation.
3. What are the main segments of the Epoxy Composite Industry?
The market segments include Fiber Type, End-user Industry.
4. Can you provide details about the market size?
The market size is estimated to be USD XX Million as of 2022.
5. What are some drivers contributing to market growth?
Growing Demand from the Wind Energy Sector; Other Drivers.
6. What are the notable trends driving market growth?
Growing Demand from the Aerospace and Defense Industry.
7. Are there any restraints impacting market growth?
Availability of Close Substitutes; Unfavorable Conditions Arising Due to COVID-19 Outbreak.
8. Can you provide examples of recent developments in the market?
N/A
9. What pricing options are available for accessing the report?
Pricing options include single-user, multi-user, and enterprise licenses priced at USD 4750, USD 5250, and USD 8750 respectively.
10. Is the market size provided in terms of value or volume?
The market size is provided in terms of value, measured in Million and volume, measured in K Tons.
11. Are there any specific market keywords associated with the report?
Yes, the market keyword associated with the report is "Epoxy Composite Industry," which aids in identifying and referencing the specific market segment covered.
12. How do I determine which pricing option suits my needs best?
The pricing options vary based on user requirements and access needs. Individual users may opt for single-user licenses, while businesses requiring broader access may choose multi-user or enterprise licenses for cost-effective access to the report.
13. Are there any additional resources or data provided in the Epoxy Composite Industry report?
While the report offers comprehensive insights, it's advisable to review the specific contents or supplementary materials provided to ascertain if additional resources or data are available.
14. How can I stay updated on further developments or reports in the Epoxy Composite Industry?
To stay informed about further developments, trends, and reports in the Epoxy Composite Industry, consider subscribing to industry newsletters, following relevant companies and organizations, or regularly checking reputable industry news sources and publications.
Methodology
Step 1 - Identification of Relevant Samples Size from Population Database


Step 2 - Approaches for Defining Global Market Size (Value, Volume* & Price*)

Note*: In applicable scenarios
Step 3 - Data Sources
Primary Research
- Web Analytics
- Survey Reports
- Research Institute
- Latest Research Reports
- Opinion Leaders
Secondary Research
- Annual Reports
- White Paper
- Latest Press Release
- Industry Association
- Paid Database
- Investor Presentations

Step 4 - Data Triangulation
Involves using different sources of information in order to increase the validity of a study
These sources are likely to be stakeholders in a program - participants, other researchers, program staff, other community members, and so on.
Then we put all data in single framework & apply various statistical tools to find out the dynamic on the market.
During the analysis stage, feedback from the stakeholder groups would be compared to determine areas of agreement as well as areas of divergence


