

Key Insights
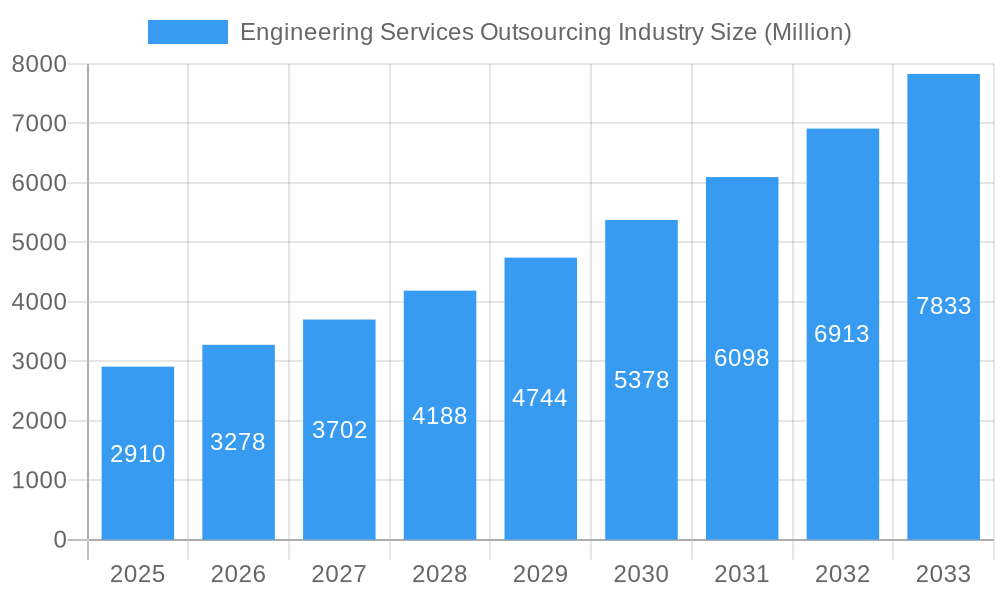
The Engineering Services Outsourcing (ESO) industry is experiencing robust growth, projected to reach a market size of $2.91 billion in 2025 and exhibiting a Compound Annual Growth Rate (CAGR) of 12.89% from 2019 to 2033. This expansion is fueled by several key drivers. Firstly, the increasing complexity of engineering projects across diverse sectors, such as automotive, aerospace, and manufacturing, necessitates specialized expertise often unavailable in-house. Outsourcing provides access to a global talent pool and specialized skills at a lower cost than maintaining an internal team. Secondly, the digital transformation sweeping industries is accelerating the adoption of ESO, particularly in areas like product design, simulation, and data analytics. Companies are leveraging these services to improve efficiency, reduce time-to-market, and enhance product innovation. Finally, the growing adoption of cloud-based platforms and collaborative tools further facilitates efficient outsourcing, making it a more accessible and streamlined option for businesses of all sizes.
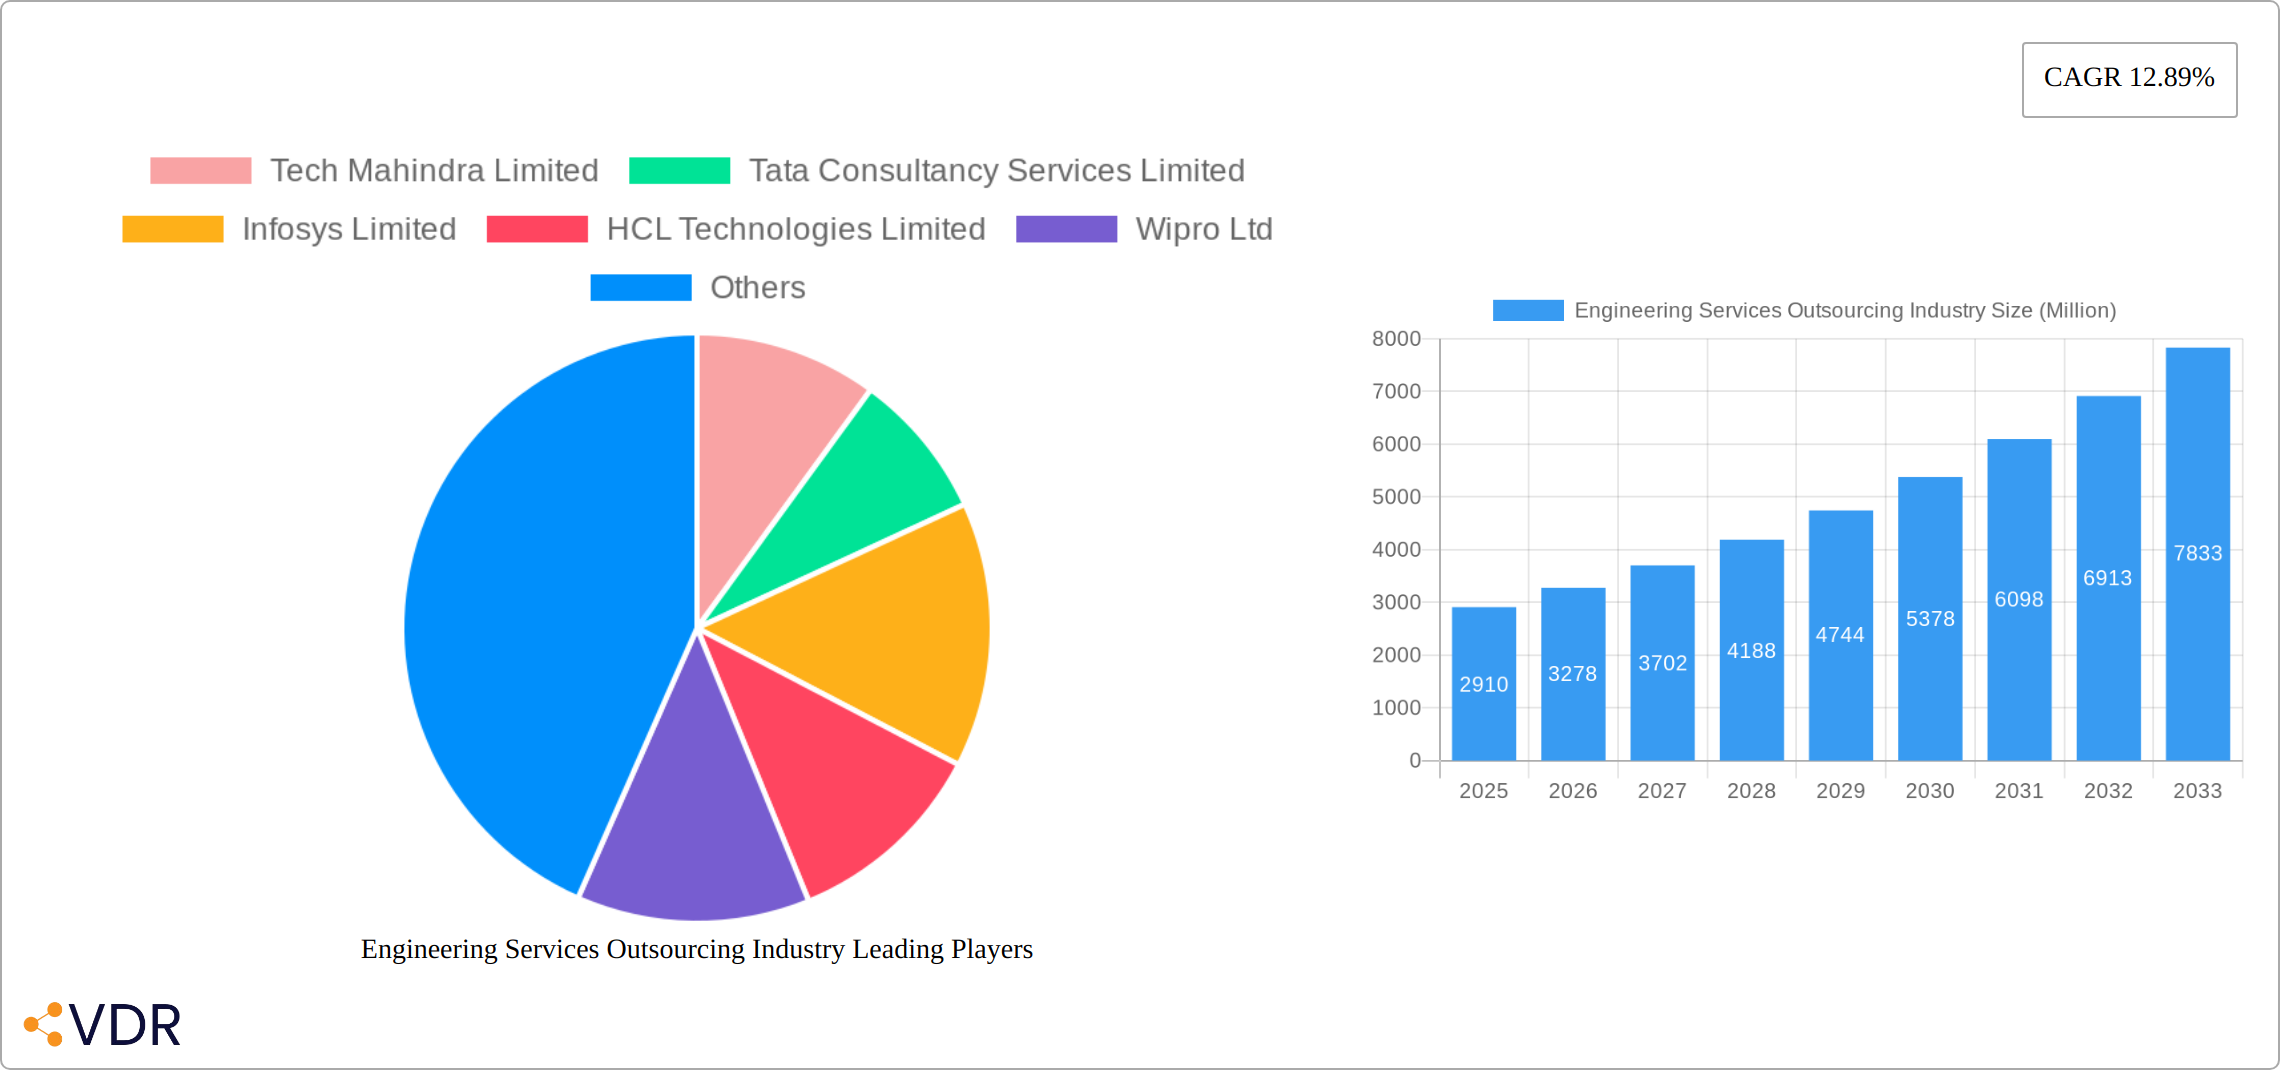
Engineering Services Outsourcing Industry Market Size (In Billion)
However, the industry also faces certain challenges. Competition among established players like Tech Mahindra, TCS, Infosys, HCL Technologies, Wipro, Capgemini, Accenture, and others is intense, resulting in pricing pressure. The need for robust security measures and data protection protocols is also paramount, necessitating significant investments to maintain trust and comply with regulations. Furthermore, managing the complexities of geographically dispersed teams and ensuring consistent quality of service across diverse projects remains a crucial factor influencing the industry's growth trajectory. Despite these restraints, the long-term outlook for the ESO market remains positive, driven by continuous technological advancements and the increasing demand for specialized engineering expertise worldwide. The market is expected to significantly expand over the forecast period (2025-2033), creating opportunities for both established players and emerging companies.
Engineering Services Outsourcing Industry Company Market Share
Engineering Services Outsourcing Industry: A Comprehensive Market Report (2019-2033)
This in-depth report provides a comprehensive analysis of the Engineering Services Outsourcing (ESO) industry, encompassing market dynamics, growth trends, key players, and future outlook. The report covers the period from 2019 to 2033, with a focus on the base year 2025 and forecast period 2025-2033. It examines the parent market of IT Outsourcing and the child market of Engineering Services Outsourcing, offering granular insights for industry professionals, investors, and strategic decision-makers. The market size is presented in million units.
Engineering Services Outsourcing Industry Market Dynamics & Structure
The Engineering Services Outsourcing (ESO) market, a significant segment within the broader IT outsourcing market, is characterized by moderate concentration, with several large players holding substantial market share. However, the landscape is dynamic, marked by continuous technological innovation and shifting client demands. The market is subject to regulatory frameworks varying across regions, impacting operational costs and compliance requirements. Competitive pressures arise from both established ESO providers and emerging niche players offering specialized services. M&A activity remains a significant factor, with larger firms strategically acquiring smaller companies to expand their service portfolios and geographic reach.
- Market Concentration: The top 5 players hold approximately xx% of the global market share in 2025 (estimated).
- Technological Innovation: Key drivers include advancements in AI, automation, IoT, and cloud computing, leading to increased efficiency and new service offerings. Barriers to innovation include high R&D costs and the need for skilled workforce development.
- Regulatory Frameworks: Data privacy regulations (GDPR, CCPA) significantly impact operational procedures and compliance costs for ESO providers. Variations in regulations across regions create complexities for global operations.
- Competitive Substitutes: In-house engineering teams, open-source solutions, and alternative sourcing models pose competitive challenges.
- End-User Demographics: Demand is driven by industries such as automotive, aerospace, manufacturing, energy, and healthcare, with a growing emphasis on digital transformation.
- M&A Trends: An average of xx M&A deals per year were observed during the historical period (2019-2024), with a projected increase in deal volume in the forecast period driven by consolidation efforts and expansion strategies.
Engineering Services Outsourcing Industry Growth Trends & Insights
The ESO market experienced robust growth in the historical period (2019-2024), driven primarily by increasing demand for specialized engineering skills, the rising adoption of digital technologies, and the cost advantages of outsourcing. Market size grew from xx million in 2019 to xx million in 2024, representing a CAGR of xx%. This positive trend is projected to continue during the forecast period (2025-2033), with a projected CAGR of xx%, driven by factors such as the increasing complexity of engineering projects, the growing adoption of Industry 4.0 technologies, and rising investments in digital transformation initiatives across various industries. Technological disruptions, particularly the rise of AI and automation, are transforming service delivery models, leading to increased efficiency and new service offerings. Consumer behavior is shifting towards greater demand for specialized expertise and customized solutions. Market penetration is expected to increase significantly, particularly in developing economies.
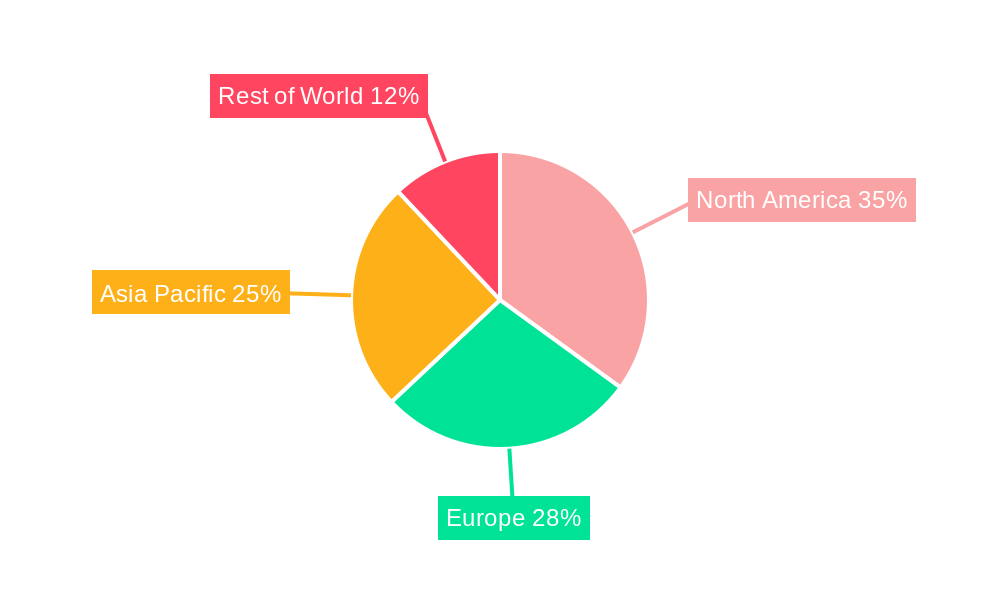
Dominant Regions, Countries, or Segments in Engineering Services Outsourcing Industry
North America and Europe currently hold the largest market shares in the ESO industry, driven by a strong presence of multinational corporations and advanced technological infrastructure. However, the Asia-Pacific region is expected to experience significant growth in the coming years due to rapid industrialization, a large pool of skilled engineers, and favorable government policies. Within segments, the automotive and manufacturing industries are leading demand, followed by aerospace and healthcare.
- Key Drivers for North America: High demand for specialized engineering services, robust technological innovation, and a strong focus on digital transformation.
- Key Drivers for Europe: Large multinational corporations, advanced infrastructure, and stringent regulatory frameworks fostering quality.
- Key Drivers for Asia-Pacific: Rapid industrialization, cost-effective labor, and government initiatives to promote technology adoption.
- Segment Dominance: Automotive and manufacturing segments hold the largest market share due to their high reliance on specialized engineering expertise. Aerospace and healthcare are emerging as fast-growing segments.
Engineering Services Outsourcing Industry Product Landscape
The Engineering Services Outsourcing (ESO) industry provides a diverse portfolio of services encompassing product design and development, sophisticated engineering analysis and simulation, streamlined manufacturing process optimization, and robust supply chain management. Innovation within the sector is propelled by the seamless integration of cutting-edge technologies, including Artificial Intelligence (AI), machine learning algorithms, and the utilization of digital twins for enhanced product development and lifecycle management. Key performance indicators (KPIs) are increasingly centered around accelerating time-to-market, achieving substantial cost reductions, and ensuring unwavering quality. ESO providers differentiate themselves through specialized industry expertise, flexible and adaptable service models tailored to client needs, and the provision of highly cost-effective solutions. Continuous technological advancements are fostering the development of more agile and efficient service delivery models, resulting in improved responsiveness and reduced lead times.
Key Drivers, Barriers & Challenges in Engineering Services Outsourcing Industry
Key Drivers: The escalating complexity inherent in modern engineering projects, coupled with the widespread adoption of Industry 4.0 technologies and the surging demand for specialized engineering expertise, are primary growth drivers. Furthermore, government initiatives actively promoting digital transformation and the strategic outsourcing of engineering functions are significantly contributing to market expansion. Illustrative examples include Memoranda of Understanding (MoUs), such as the one between the Saudi Arabian government and Tech Mahindra, which underscore the increasing role of governments in nurturing the growth of the ESO industry.
Key Challenges: Intense competition from established in-house engineering teams and a multitude of other outsourcing providers presents a significant hurdle. Global supply chain disruptions, notably those experienced in the wake of the COVID-19 pandemic, have demonstrably impacted service delivery timelines and reliability. Stringent regulatory compliance requirements, encompassing data privacy regulations (e.g., GDPR, CCPA), add a layer of complexity and increase operational costs. The persistent shortage of skilled engineers in certain geographical regions also acts as a constraint on industry growth and expansion.
Emerging Opportunities in Engineering Services Outsourcing Industry
Vast untapped markets in developing and emerging economies present compelling opportunities for significant expansion and market penetration. The growing adoption of sustainable engineering practices, driven by environmental concerns and regulatory pressures, offers lucrative niche opportunities for specialized ESO providers. The increasing demand for highly customized solutions and the need for specialized engineering expertise create fertile ground for service differentiation, allowing companies to command premium pricing and achieve higher profit margins. Rapid growth in specific sectors, such as renewable energy, biotechnology, and advanced materials, fuels the demand for specialized engineering services, creating further growth avenues for ESO providers.
Growth Accelerators in the Engineering Services Outsourcing Industry
Rapid technological breakthroughs, such as AI-powered design tools and the increasingly sophisticated applications of digital twins, are poised to significantly enhance operational efficiency and drive innovation within the industry. Strategic partnerships between established ESO providers and innovative technology companies are crucial for creating novel service offerings and expanding market reach, allowing companies to tap into new customer segments and diversify their revenue streams. Proactive market expansion strategies targeting emerging economies with significant growth potential are essential for unlocking significant growth potential and establishing a global presence.
Key Players Shaping the Engineering Services Outsourcing Market
- Tech Mahindra Limited
- Tata Consultancy Services Limited
- Infosys Limited
- HCL Technologies Limited
- Wipro Ltd
- Capgemini Technology Services India Limited
- Globallogic Inc
- Accenture
- RLE International Inc
- ASAP Holding GmbH
- Tata Technologies
Notable Milestones in Engineering Services Outsourcing Industry Sector
- April 2023: Marks & Spencer PLC extends its relationship with Tata Consultancy Services (TCS) for a major technology modernization program.
- February 2023: Tech Mahindra signs an MoU with the Saudi Arabian Ministry of Communication and Information Technology to establish a Data & AI and Cloud Centre of Excellence in Riyadh.
In-Depth Engineering Services Outsourcing Industry Market Outlook
The ESO market is projected to experience sustained and robust growth, fueled by continuous technological advancements, escalating global demand for engineering services, and the formation of strategic alliances and partnerships. The overarching focus on digital transformation initiatives, the widespread adoption of Industry 4.0 principles, and the increasing emphasis on sustainable engineering practices will collectively shape future market trends. Strategic opportunities for ESO providers lie in specializing in niche market segments, leveraging AI and automation to enhance efficiency and reduce costs, and strategically expanding into previously untapped markets. The long-term growth potential of the ESO industry remains considerable, presenting significant opportunities for both established industry leaders and ambitious new entrants.
Engineering Services Outsourcing Industry Segmentation
-
1. Services
- 1.1. Designing
- 1.2. Prototyping
- 1.3. System Integration
- 1.4. Testing
- 1.5. Others
-
2. End User
- 2.1. Automotive
- 2.2. Industrial
- 2.3. Consumer Electronics And Semiconductors
- 2.4. Telecom
- 2.5. Others
Engineering Services Outsourcing Industry Segmentation By Geography
-
1. North America
- 1.1. United States
- 1.2. Canada
- 1.3. Mexico
-
2. Europe
- 2.1. United Kingdom
- 2.2. Germany
- 2.3. France
- 2.4. Italy
- 2.5. Spain
- 2.6. Rest of Europe
-
3. Asia Pacific
- 3.1. China
- 3.2. India
- 3.3. Japan
- 3.4. South Korea
- 3.5. Thailand
- 3.6. Indonesia
- 3.7. Rest of Asia pacific
- 4. Rest of the World
Engineering Services Outsourcing Industry Regional Market Share
Geographic Coverage of Engineering Services Outsourcing Industry
Engineering Services Outsourcing Industry REPORT HIGHLIGHTS
| Aspects | Details |
|---|---|
| Study Period | 2020-2034 |
| Base Year | 2025 |
| Estimated Year | 2026 |
| Forecast Period | 2026-2034 |
| Historical Period | 2020-2025 |
| Growth Rate | CAGR of 12.89% from 2020-2034 |
| Segmentation |
|
Table of Contents
- 1. Introduction
- 1.1. Research Scope
- 1.2. Market Segmentation
- 1.3. Research Objective
- 1.4. Definitions and Assumptions
- 2. Executive Summary
- 2.1. Market Snapshot
- 3. Market Dynamics
- 3.1. Market Drivers
- 3.2. Market Restrains
- 3.3. Market Trends
- 3.4. Market Opportunities
- 4. Market Factor Analysis
- 4.1. Porters Five Forces
- 4.1.1. Bargaining Power of Suppliers
- 4.1.2. Bargaining Power of Buyers
- 4.1.3. Threat of New Entrants
- 4.1.4. Threat of Substitutes
- 4.1.5. Competitive Rivalry
- 4.2. PESTEL analysis
- 4.3. BCG Analysis
- 4.3.1. Stars (High Growth, High Market Share)
- 4.3.2. Cash Cows (Low Growth, High Market Share)
- 4.3.3. Question Mark (High Growth, Low Market Share)
- 4.3.4. Dogs (Low Growth, Low Market Share)
- 4.4. Ansoff Matrix Analysis
- 4.5. Supply Chain Analysis
- 4.6. Regulatory Landscape
- 4.7. Current Market Potential and Opportunity Assessment (TAM–SAM–SOM Framework)
- 4.8. VDR Analyst Note
- 4.1. Porters Five Forces
- 5. Market Analysis, Insights and Forecast 2021-2033
- 5.1. Market Analysis, Insights and Forecast - by Services
- 5.1.1. Designing
- 5.1.2. Prototyping
- 5.1.3. System Integration
- 5.1.4. Testing
- 5.1.5. Others
- 5.2. Market Analysis, Insights and Forecast - by End User
- 5.2.1. Automotive
- 5.2.2. Industrial
- 5.2.3. Consumer Electronics And Semiconductors
- 5.2.4. Telecom
- 5.2.5. Others
- 5.3. Market Analysis, Insights and Forecast - by Region
- 5.3.1. North America
- 5.3.2. Europe
- 5.3.3. Asia Pacific
- 5.3.4. Rest of the World
- 5.1. Market Analysis, Insights and Forecast - by Services
- 6. Global Engineering Services Outsourcing Industry Analysis, Insights and Forecast, 2021-2033
- 6.1. Market Analysis, Insights and Forecast - by Services
- 6.1.1. Designing
- 6.1.2. Prototyping
- 6.1.3. System Integration
- 6.1.4. Testing
- 6.1.5. Others
- 6.2. Market Analysis, Insights and Forecast - by End User
- 6.2.1. Automotive
- 6.2.2. Industrial
- 6.2.3. Consumer Electronics And Semiconductors
- 6.2.4. Telecom
- 6.2.5. Others
- 6.1. Market Analysis, Insights and Forecast - by Services
- 7. North America Engineering Services Outsourcing Industry Analysis, Insights and Forecast, 2021-2033
- 7.1. Market Analysis, Insights and Forecast - by Services
- 7.1.1. Designing
- 7.1.2. Prototyping
- 7.1.3. System Integration
- 7.1.4. Testing
- 7.1.5. Others
- 7.2. Market Analysis, Insights and Forecast - by End User
- 7.2.1. Automotive
- 7.2.2. Industrial
- 7.2.3. Consumer Electronics And Semiconductors
- 7.2.4. Telecom
- 7.2.5. Others
- 7.1. Market Analysis, Insights and Forecast - by Services
- 8. Europe Engineering Services Outsourcing Industry Analysis, Insights and Forecast, 2021-2033
- 8.1. Market Analysis, Insights and Forecast - by Services
- 8.1.1. Designing
- 8.1.2. Prototyping
- 8.1.3. System Integration
- 8.1.4. Testing
- 8.1.5. Others
- 8.2. Market Analysis, Insights and Forecast - by End User
- 8.2.1. Automotive
- 8.2.2. Industrial
- 8.2.3. Consumer Electronics And Semiconductors
- 8.2.4. Telecom
- 8.2.5. Others
- 8.1. Market Analysis, Insights and Forecast - by Services
- 9. Asia Pacific Engineering Services Outsourcing Industry Analysis, Insights and Forecast, 2021-2033
- 9.1. Market Analysis, Insights and Forecast - by Services
- 9.1.1. Designing
- 9.1.2. Prototyping
- 9.1.3. System Integration
- 9.1.4. Testing
- 9.1.5. Others
- 9.2. Market Analysis, Insights and Forecast - by End User
- 9.2.1. Automotive
- 9.2.2. Industrial
- 9.2.3. Consumer Electronics And Semiconductors
- 9.2.4. Telecom
- 9.2.5. Others
- 9.1. Market Analysis, Insights and Forecast - by Services
- 10. Rest of the World Engineering Services Outsourcing Industry Analysis, Insights and Forecast, 2021-2033
- 10.1. Market Analysis, Insights and Forecast - by Services
- 10.1.1. Designing
- 10.1.2. Prototyping
- 10.1.3. System Integration
- 10.1.4. Testing
- 10.1.5. Others
- 10.2. Market Analysis, Insights and Forecast - by End User
- 10.2.1. Automotive
- 10.2.2. Industrial
- 10.2.3. Consumer Electronics And Semiconductors
- 10.2.4. Telecom
- 10.2.5. Others
- 10.1. Market Analysis, Insights and Forecast - by Services
- 11. Competitive Analysis
- 11.1. Company Profiles
- 11.1.1 Tech Mahindra Limited
- 11.1.1.1. Company Overview
- 11.1.1.2. Products
- 11.1.1.3. Company Financials
- 11.1.1.4. SWOT Analysis
- 11.1.2 Tata Consultancy Services Limited
- 11.1.2.1. Company Overview
- 11.1.2.2. Products
- 11.1.2.3. Company Financials
- 11.1.2.4. SWOT Analysis
- 11.1.3 Infosys Limited
- 11.1.3.1. Company Overview
- 11.1.3.2. Products
- 11.1.3.3. Company Financials
- 11.1.3.4. SWOT Analysis
- 11.1.4 HCL Technologies Limited
- 11.1.4.1. Company Overview
- 11.1.4.2. Products
- 11.1.4.3. Company Financials
- 11.1.4.4. SWOT Analysis
- 11.1.5 Wipro Ltd
- 11.1.5.1. Company Overview
- 11.1.5.2. Products
- 11.1.5.3. Company Financials
- 11.1.5.4. SWOT Analysis
- 11.1.6 Capgemini Technology Services India Limited
- 11.1.6.1. Company Overview
- 11.1.6.2. Products
- 11.1.6.3. Company Financials
- 11.1.6.4. SWOT Analysis
- 11.1.7 Globallogic Inc
- 11.1.7.1. Company Overview
- 11.1.7.2. Products
- 11.1.7.3. Company Financials
- 11.1.7.4. SWOT Analysis
- 11.1.8 Accenture
- 11.1.8.1. Company Overview
- 11.1.8.2. Products
- 11.1.8.3. Company Financials
- 11.1.8.4. SWOT Analysis
- 11.1.9 RLE International Inc
- 11.1.9.1. Company Overview
- 11.1.9.2. Products
- 11.1.9.3. Company Financials
- 11.1.9.4. SWOT Analysis
- 11.1.10 ASAP Holding GmbH
- 11.1.10.1. Company Overview
- 11.1.10.2. Products
- 11.1.10.3. Company Financials
- 11.1.10.4. SWOT Analysis
- 11.1.11 Tata Technologies**List Not Exhaustive
- 11.1.11.1. Company Overview
- 11.1.11.2. Products
- 11.1.11.3. Company Financials
- 11.1.11.4. SWOT Analysis
- 11.1.1 Tech Mahindra Limited
- 11.2. Market Entropy
- 11.2.1 Company's Key Areas Served
- 11.2.2 Recent Developments
- 11.3. Company Market Share Analysis 2025
- 11.3.1 Top 5 Companies Market Share Analysis
- 11.3.2 Top 3 Companies Market Share Analysis
- 11.4. List of Potential Customers
- 12. Research Methodology
List of Figures
- Figure 1: Global Engineering Services Outsourcing Industry Revenue Breakdown (Million, %) by Region 2025 & 2033
- Figure 2: Global Engineering Services Outsourcing Industry Volume Breakdown (Trillion, %) by Region 2025 & 2033
- Figure 3: North America Engineering Services Outsourcing Industry Revenue (Million), by Services 2025 & 2033
- Figure 4: North America Engineering Services Outsourcing Industry Volume (Trillion), by Services 2025 & 2033
- Figure 5: North America Engineering Services Outsourcing Industry Revenue Share (%), by Services 2025 & 2033
- Figure 6: North America Engineering Services Outsourcing Industry Volume Share (%), by Services 2025 & 2033
- Figure 7: North America Engineering Services Outsourcing Industry Revenue (Million), by End User 2025 & 2033
- Figure 8: North America Engineering Services Outsourcing Industry Volume (Trillion), by End User 2025 & 2033
- Figure 9: North America Engineering Services Outsourcing Industry Revenue Share (%), by End User 2025 & 2033
- Figure 10: North America Engineering Services Outsourcing Industry Volume Share (%), by End User 2025 & 2033
- Figure 11: North America Engineering Services Outsourcing Industry Revenue (Million), by Country 2025 & 2033
- Figure 12: North America Engineering Services Outsourcing Industry Volume (Trillion), by Country 2025 & 2033
- Figure 13: North America Engineering Services Outsourcing Industry Revenue Share (%), by Country 2025 & 2033
- Figure 14: North America Engineering Services Outsourcing Industry Volume Share (%), by Country 2025 & 2033
- Figure 15: Europe Engineering Services Outsourcing Industry Revenue (Million), by Services 2025 & 2033
- Figure 16: Europe Engineering Services Outsourcing Industry Volume (Trillion), by Services 2025 & 2033
- Figure 17: Europe Engineering Services Outsourcing Industry Revenue Share (%), by Services 2025 & 2033
- Figure 18: Europe Engineering Services Outsourcing Industry Volume Share (%), by Services 2025 & 2033
- Figure 19: Europe Engineering Services Outsourcing Industry Revenue (Million), by End User 2025 & 2033
- Figure 20: Europe Engineering Services Outsourcing Industry Volume (Trillion), by End User 2025 & 2033
- Figure 21: Europe Engineering Services Outsourcing Industry Revenue Share (%), by End User 2025 & 2033
- Figure 22: Europe Engineering Services Outsourcing Industry Volume Share (%), by End User 2025 & 2033
- Figure 23: Europe Engineering Services Outsourcing Industry Revenue (Million), by Country 2025 & 2033
- Figure 24: Europe Engineering Services Outsourcing Industry Volume (Trillion), by Country 2025 & 2033
- Figure 25: Europe Engineering Services Outsourcing Industry Revenue Share (%), by Country 2025 & 2033
- Figure 26: Europe Engineering Services Outsourcing Industry Volume Share (%), by Country 2025 & 2033
- Figure 27: Asia Pacific Engineering Services Outsourcing Industry Revenue (Million), by Services 2025 & 2033
- Figure 28: Asia Pacific Engineering Services Outsourcing Industry Volume (Trillion), by Services 2025 & 2033
- Figure 29: Asia Pacific Engineering Services Outsourcing Industry Revenue Share (%), by Services 2025 & 2033
- Figure 30: Asia Pacific Engineering Services Outsourcing Industry Volume Share (%), by Services 2025 & 2033
- Figure 31: Asia Pacific Engineering Services Outsourcing Industry Revenue (Million), by End User 2025 & 2033
- Figure 32: Asia Pacific Engineering Services Outsourcing Industry Volume (Trillion), by End User 2025 & 2033
- Figure 33: Asia Pacific Engineering Services Outsourcing Industry Revenue Share (%), by End User 2025 & 2033
- Figure 34: Asia Pacific Engineering Services Outsourcing Industry Volume Share (%), by End User 2025 & 2033
- Figure 35: Asia Pacific Engineering Services Outsourcing Industry Revenue (Million), by Country 2025 & 2033
- Figure 36: Asia Pacific Engineering Services Outsourcing Industry Volume (Trillion), by Country 2025 & 2033
- Figure 37: Asia Pacific Engineering Services Outsourcing Industry Revenue Share (%), by Country 2025 & 2033
- Figure 38: Asia Pacific Engineering Services Outsourcing Industry Volume Share (%), by Country 2025 & 2033
- Figure 39: Rest of the World Engineering Services Outsourcing Industry Revenue (Million), by Services 2025 & 2033
- Figure 40: Rest of the World Engineering Services Outsourcing Industry Volume (Trillion), by Services 2025 & 2033
- Figure 41: Rest of the World Engineering Services Outsourcing Industry Revenue Share (%), by Services 2025 & 2033
- Figure 42: Rest of the World Engineering Services Outsourcing Industry Volume Share (%), by Services 2025 & 2033
- Figure 43: Rest of the World Engineering Services Outsourcing Industry Revenue (Million), by End User 2025 & 2033
- Figure 44: Rest of the World Engineering Services Outsourcing Industry Volume (Trillion), by End User 2025 & 2033
- Figure 45: Rest of the World Engineering Services Outsourcing Industry Revenue Share (%), by End User 2025 & 2033
- Figure 46: Rest of the World Engineering Services Outsourcing Industry Volume Share (%), by End User 2025 & 2033
- Figure 47: Rest of the World Engineering Services Outsourcing Industry Revenue (Million), by Country 2025 & 2033
- Figure 48: Rest of the World Engineering Services Outsourcing Industry Volume (Trillion), by Country 2025 & 2033
- Figure 49: Rest of the World Engineering Services Outsourcing Industry Revenue Share (%), by Country 2025 & 2033
- Figure 50: Rest of the World Engineering Services Outsourcing Industry Volume Share (%), by Country 2025 & 2033
List of Tables
- Table 1: Global Engineering Services Outsourcing Industry Revenue Million Forecast, by Services 2020 & 2033
- Table 2: Global Engineering Services Outsourcing Industry Volume Trillion Forecast, by Services 2020 & 2033
- Table 3: Global Engineering Services Outsourcing Industry Revenue Million Forecast, by End User 2020 & 2033
- Table 4: Global Engineering Services Outsourcing Industry Volume Trillion Forecast, by End User 2020 & 2033
- Table 5: Global Engineering Services Outsourcing Industry Revenue Million Forecast, by Region 2020 & 2033
- Table 6: Global Engineering Services Outsourcing Industry Volume Trillion Forecast, by Region 2020 & 2033
- Table 7: Global Engineering Services Outsourcing Industry Revenue Million Forecast, by Services 2020 & 2033
- Table 8: Global Engineering Services Outsourcing Industry Volume Trillion Forecast, by Services 2020 & 2033
- Table 9: Global Engineering Services Outsourcing Industry Revenue Million Forecast, by End User 2020 & 2033
- Table 10: Global Engineering Services Outsourcing Industry Volume Trillion Forecast, by End User 2020 & 2033
- Table 11: Global Engineering Services Outsourcing Industry Revenue Million Forecast, by Country 2020 & 2033
- Table 12: Global Engineering Services Outsourcing Industry Volume Trillion Forecast, by Country 2020 & 2033
- Table 13: United States Engineering Services Outsourcing Industry Revenue (Million) Forecast, by Application 2020 & 2033
- Table 14: United States Engineering Services Outsourcing Industry Volume (Trillion) Forecast, by Application 2020 & 2033
- Table 15: Canada Engineering Services Outsourcing Industry Revenue (Million) Forecast, by Application 2020 & 2033
- Table 16: Canada Engineering Services Outsourcing Industry Volume (Trillion) Forecast, by Application 2020 & 2033
- Table 17: Mexico Engineering Services Outsourcing Industry Revenue (Million) Forecast, by Application 2020 & 2033
- Table 18: Mexico Engineering Services Outsourcing Industry Volume (Trillion) Forecast, by Application 2020 & 2033
- Table 19: Global Engineering Services Outsourcing Industry Revenue Million Forecast, by Services 2020 & 2033
- Table 20: Global Engineering Services Outsourcing Industry Volume Trillion Forecast, by Services 2020 & 2033
- Table 21: Global Engineering Services Outsourcing Industry Revenue Million Forecast, by End User 2020 & 2033
- Table 22: Global Engineering Services Outsourcing Industry Volume Trillion Forecast, by End User 2020 & 2033
- Table 23: Global Engineering Services Outsourcing Industry Revenue Million Forecast, by Country 2020 & 2033
- Table 24: Global Engineering Services Outsourcing Industry Volume Trillion Forecast, by Country 2020 & 2033
- Table 25: United Kingdom Engineering Services Outsourcing Industry Revenue (Million) Forecast, by Application 2020 & 2033
- Table 26: United Kingdom Engineering Services Outsourcing Industry Volume (Trillion) Forecast, by Application 2020 & 2033
- Table 27: Germany Engineering Services Outsourcing Industry Revenue (Million) Forecast, by Application 2020 & 2033
- Table 28: Germany Engineering Services Outsourcing Industry Volume (Trillion) Forecast, by Application 2020 & 2033
- Table 29: France Engineering Services Outsourcing Industry Revenue (Million) Forecast, by Application 2020 & 2033
- Table 30: France Engineering Services Outsourcing Industry Volume (Trillion) Forecast, by Application 2020 & 2033
- Table 31: Italy Engineering Services Outsourcing Industry Revenue (Million) Forecast, by Application 2020 & 2033
- Table 32: Italy Engineering Services Outsourcing Industry Volume (Trillion) Forecast, by Application 2020 & 2033
- Table 33: Spain Engineering Services Outsourcing Industry Revenue (Million) Forecast, by Application 2020 & 2033
- Table 34: Spain Engineering Services Outsourcing Industry Volume (Trillion) Forecast, by Application 2020 & 2033
- Table 35: Rest of Europe Engineering Services Outsourcing Industry Revenue (Million) Forecast, by Application 2020 & 2033
- Table 36: Rest of Europe Engineering Services Outsourcing Industry Volume (Trillion) Forecast, by Application 2020 & 2033
- Table 37: Global Engineering Services Outsourcing Industry Revenue Million Forecast, by Services 2020 & 2033
- Table 38: Global Engineering Services Outsourcing Industry Volume Trillion Forecast, by Services 2020 & 2033
- Table 39: Global Engineering Services Outsourcing Industry Revenue Million Forecast, by End User 2020 & 2033
- Table 40: Global Engineering Services Outsourcing Industry Volume Trillion Forecast, by End User 2020 & 2033
- Table 41: Global Engineering Services Outsourcing Industry Revenue Million Forecast, by Country 2020 & 2033
- Table 42: Global Engineering Services Outsourcing Industry Volume Trillion Forecast, by Country 2020 & 2033
- Table 43: China Engineering Services Outsourcing Industry Revenue (Million) Forecast, by Application 2020 & 2033
- Table 44: China Engineering Services Outsourcing Industry Volume (Trillion) Forecast, by Application 2020 & 2033
- Table 45: India Engineering Services Outsourcing Industry Revenue (Million) Forecast, by Application 2020 & 2033
- Table 46: India Engineering Services Outsourcing Industry Volume (Trillion) Forecast, by Application 2020 & 2033
- Table 47: Japan Engineering Services Outsourcing Industry Revenue (Million) Forecast, by Application 2020 & 2033
- Table 48: Japan Engineering Services Outsourcing Industry Volume (Trillion) Forecast, by Application 2020 & 2033
- Table 49: South Korea Engineering Services Outsourcing Industry Revenue (Million) Forecast, by Application 2020 & 2033
- Table 50: South Korea Engineering Services Outsourcing Industry Volume (Trillion) Forecast, by Application 2020 & 2033
- Table 51: Thailand Engineering Services Outsourcing Industry Revenue (Million) Forecast, by Application 2020 & 2033
- Table 52: Thailand Engineering Services Outsourcing Industry Volume (Trillion) Forecast, by Application 2020 & 2033
- Table 53: Indonesia Engineering Services Outsourcing Industry Revenue (Million) Forecast, by Application 2020 & 2033
- Table 54: Indonesia Engineering Services Outsourcing Industry Volume (Trillion) Forecast, by Application 2020 & 2033
- Table 55: Rest of Asia pacific Engineering Services Outsourcing Industry Revenue (Million) Forecast, by Application 2020 & 2033
- Table 56: Rest of Asia pacific Engineering Services Outsourcing Industry Volume (Trillion) Forecast, by Application 2020 & 2033
- Table 57: Global Engineering Services Outsourcing Industry Revenue Million Forecast, by Services 2020 & 2033
- Table 58: Global Engineering Services Outsourcing Industry Volume Trillion Forecast, by Services 2020 & 2033
- Table 59: Global Engineering Services Outsourcing Industry Revenue Million Forecast, by End User 2020 & 2033
- Table 60: Global Engineering Services Outsourcing Industry Volume Trillion Forecast, by End User 2020 & 2033
- Table 61: Global Engineering Services Outsourcing Industry Revenue Million Forecast, by Country 2020 & 2033
- Table 62: Global Engineering Services Outsourcing Industry Volume Trillion Forecast, by Country 2020 & 2033
Frequently Asked Questions
1. What is the projected Compound Annual Growth Rate (CAGR) of the Engineering Services Outsourcing Industry?
The projected CAGR is approximately 12.89%.
2. Which companies are prominent players in the Engineering Services Outsourcing Industry?
Key companies in the market include Tech Mahindra Limited, Tata Consultancy Services Limited, Infosys Limited, HCL Technologies Limited, Wipro Ltd, Capgemini Technology Services India Limited, Globallogic Inc, Accenture, RLE International Inc, ASAP Holding GmbH, Tata Technologies**List Not Exhaustive.
3. What are the main segments of the Engineering Services Outsourcing Industry?
The market segments include Services, End User.
4. Can you provide details about the market size?
The market size is estimated to be USD 2.91 Million as of 2022.
5. What are some drivers contributing to market growth?
N/A
6. What are the notable trends driving market growth?
Rising Adoption of Integrated Solutions Driving the Growth of the Market.
7. Are there any restraints impacting market growth?
N/A
8. Can you provide examples of recent developments in the market?
April 2023: The relationship between Marks and Spencer PLC (M&S) and Tata Consultancy Services (TCS) has been extended to change M&S's core technology stack, increase innovation speed and resilience, and promote sustainable growth. The modernization program will enhance speed to market, lower technological debt, and boost operating model efficiency and effectiveness for M&S. M&S' strategic aims of providing better customer experience, driving online growth, leading in omnichannel and sustainability, modernizing its supply chain, increasing its worldwide reach will be expedited by the transformation into a simple, agile, data-led business.
9. What pricing options are available for accessing the report?
Pricing options include single-user, multi-user, and enterprise licenses priced at USD 4750, USD 5250, and USD 8750 respectively.
10. Is the market size provided in terms of value or volume?
The market size is provided in terms of value, measured in Million and volume, measured in Trillion.
11. Are there any specific market keywords associated with the report?
Yes, the market keyword associated with the report is "Engineering Services Outsourcing Industry," which aids in identifying and referencing the specific market segment covered.
12. How do I determine which pricing option suits my needs best?
The pricing options vary based on user requirements and access needs. Individual users may opt for single-user licenses, while businesses requiring broader access may choose multi-user or enterprise licenses for cost-effective access to the report.
13. Are there any additional resources or data provided in the Engineering Services Outsourcing Industry report?
While the report offers comprehensive insights, it's advisable to review the specific contents or supplementary materials provided to ascertain if additional resources or data are available.
14. How can I stay updated on further developments or reports in the Engineering Services Outsourcing Industry?
To stay informed about further developments, trends, and reports in the Engineering Services Outsourcing Industry, consider subscribing to industry newsletters, following relevant companies and organizations, or regularly checking reputable industry news sources and publications.
Methodology
Step 1 - Identification of Relevant Samples Size from Population Database


Step 2 - Approaches for Defining Global Market Size (Value, Volume* & Price*)

Note*: In applicable scenarios
Step 3 - Data Sources
Primary Research
- Web Analytics
- Survey Reports
- Research Institute
- Latest Research Reports
- Opinion Leaders
Secondary Research
- Annual Reports
- White Paper
- Latest Press Release
- Industry Association
- Paid Database
- Investor Presentations

Step 4 - Data Triangulation
Involves using different sources of information in order to increase the validity of a study
These sources are likely to be stakeholders in a program - participants, other researchers, program staff, other community members, and so on.
Then we put all data in single framework & apply various statistical tools to find out the dynamic on the market.
During the analysis stage, feedback from the stakeholder groups would be compared to determine areas of agreement as well as areas of divergence