
Key Insights
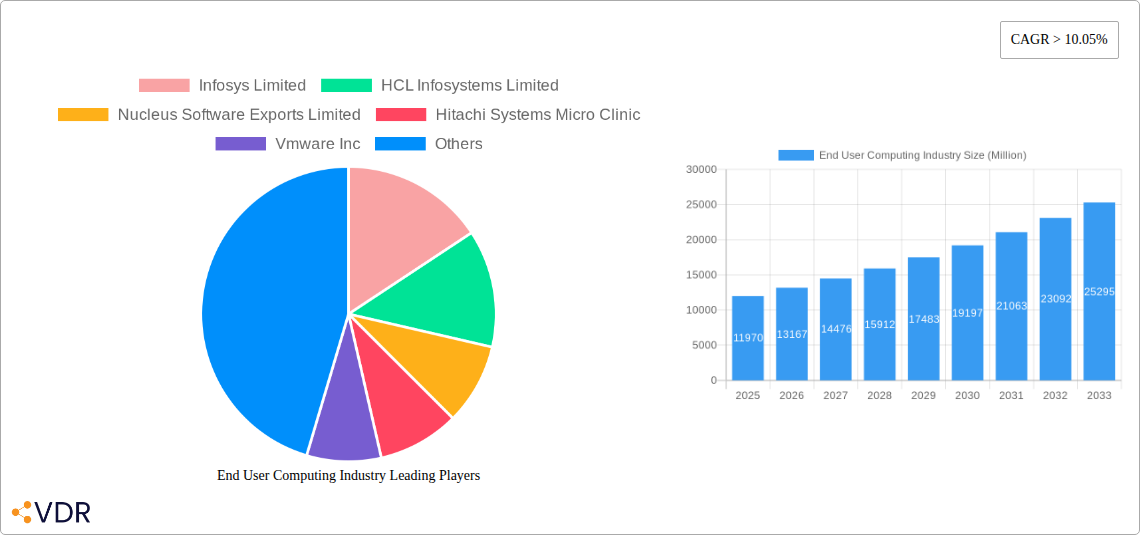
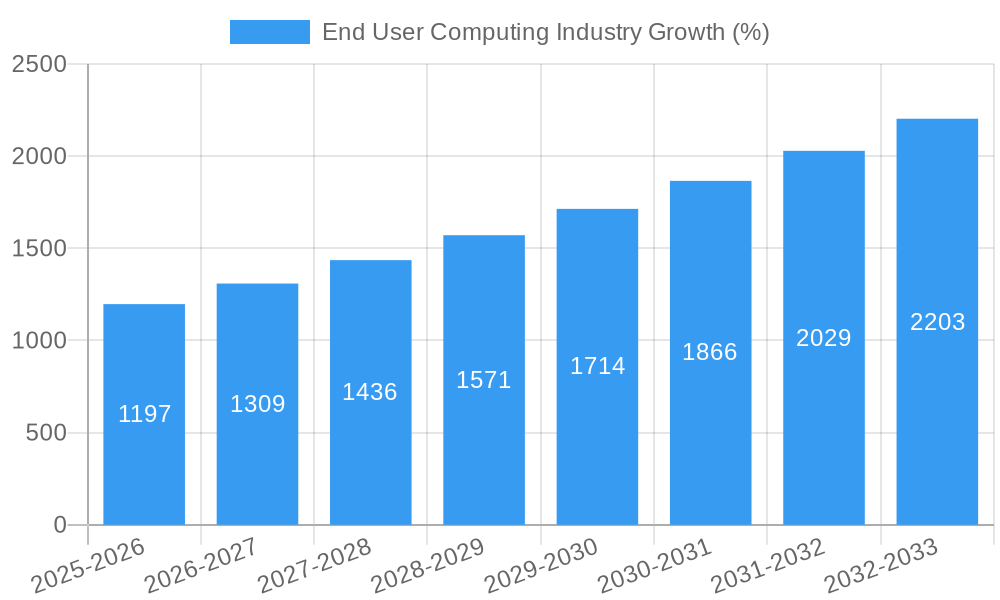
The End User Computing (EUC) market, valued at $11.97 billion in 2025, is experiencing robust growth, projected to expand at a Compound Annual Growth Rate (CAGR) exceeding 10.05% from 2025 to 2033. This growth is fueled by several key drivers. The increasing adoption of cloud-based solutions, driven by enhanced scalability, flexibility, and cost-effectiveness, is a significant contributor. Furthermore, the rising demand for improved security and streamlined management of endpoint devices across diverse organizational structures is boosting market expansion. The shift towards hybrid work models, necessitating seamless access to corporate resources from various locations, further accelerates EUC market adoption. Large enterprises are leading the charge, investing heavily in sophisticated EUC solutions to optimize productivity and enhance employee experience. However, challenges remain, including concerns about data security and the complexity of managing diverse EUC environments across different platforms and deployment models. The market is segmented by solution type (Unified Communication, Software Asset Management, other solutions and services), organization size (large enterprises and SMEs), deployment mode (on-premise and cloud), and end-user industry (IT and Telecom, Banking, Financial Services and Insurance, Healthcare, Retail, and others like Media & Entertainment, Government, Education, and Transportation and Logistics). The competitive landscape is populated by a mix of established players like Infosys, HCL, VMware, and Fujitsu, and emerging technology companies like Nutanix and NetApp, indicating a dynamic and rapidly evolving market.
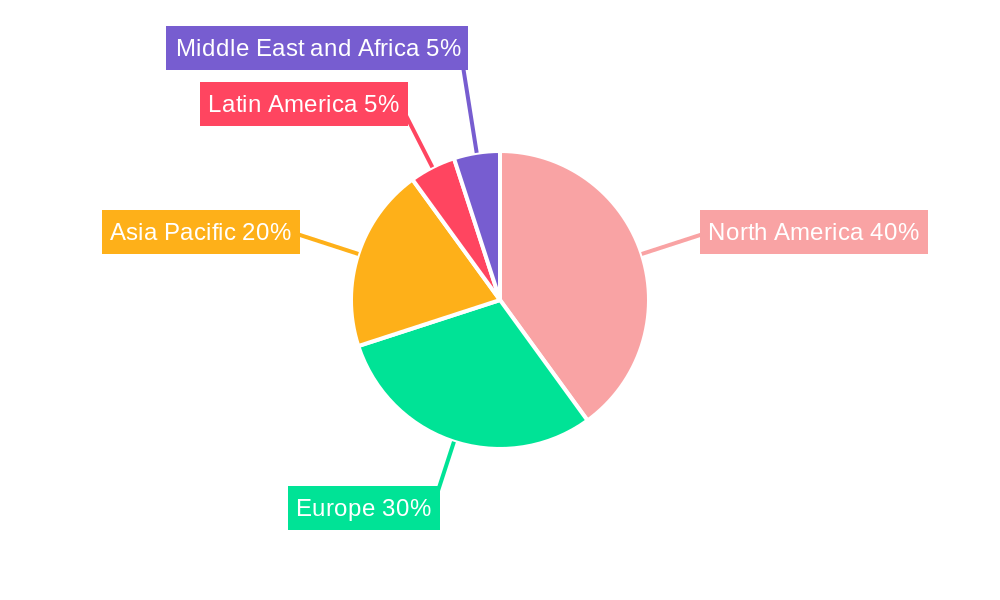
The significant growth in the EUC market is anticipated across all geographical regions, with North America and Europe likely holding substantial market shares due to early adoption of advanced technologies and robust IT infrastructure. However, the Asia-Pacific region is projected to exhibit the fastest growth rate, driven by increasing digitalization and expanding IT budgets in developing economies. The industry is witnessing a surge in the adoption of innovative technologies such as artificial intelligence (AI) and machine learning (ML) to improve user experience and enhance security. The integration of these technologies is expected to further drive market growth and create new opportunities for vendors specializing in EUC solutions. Furthermore, the increasing focus on employee empowerment and digital workplace transformation will continue to fuel the demand for advanced EUC solutions and services in the coming years.
End User Computing (EUC) Industry Market Report: 2019-2033
This comprehensive report provides a detailed analysis of the End User Computing (EUC) industry, encompassing market dynamics, growth trends, key players, and future outlook. The study period covers 2019-2033, with 2025 as the base and estimated year. The report segments the market by type (Solution, Other Solutions – including Unified Communication and Software Asset Management), services, organization size (Large Enterprises, Small & Medium Enterprises), deployment mode (On-Premise, Cloud), and end-user industry (IT & Telecom, Banking, Financial Services & Insurance (BFSI), Healthcare, Retail, and Other End-user Industries – including Media & Entertainment, Government, Education, and Transportation & Logistics). The report is valued at xx Million units.
End User Computing Industry Market Dynamics & Structure
The End User Computing market is characterized by a moderately consolidated landscape, with several large players and numerous smaller niche players. Market share is dynamic, influenced by technological advancements, strategic partnerships, and mergers & acquisitions (M&A). The market is experiencing significant innovation driven by the increasing demand for cloud-based solutions, enhanced security, and improved user experience. Regulatory frameworks, particularly concerning data privacy and security, play a crucial role in shaping market dynamics. Competitive product substitutes, such as open-source solutions, also impact the market. End-user demographics, including the growing adoption of mobile and remote working, are reshaping demand. The M&A activity is relatively high, with an estimated xx deals in the last five years, primarily focused on acquiring companies with specialized technologies or expanding geographical reach.
- Market Concentration: Moderately consolidated, with top 5 players holding approximately xx% market share in 2024.
- Technological Innovation Drivers: Cloud computing, AI, automation, enhanced security features.
- Regulatory Frameworks: GDPR, CCPA, and other data privacy regulations influence vendor strategies.
- Competitive Product Substitutes: Open-source solutions, alternative collaboration platforms.
- End-User Demographics: Increasing mobile and remote workforce driving demand for flexible solutions.
- M&A Trends: xx M&A deals in the last five years, focused on technology acquisition and market expansion.
End User Computing Industry Growth Trends & Insights
The global End User Computing market is experiencing robust growth, driven by the increasing adoption of cloud-based solutions, the proliferation of mobile devices, and the rising demand for improved user productivity and collaboration tools. The market size is projected to reach xx million units by 2033, exhibiting a Compound Annual Growth Rate (CAGR) of xx% during the forecast period (2025-2033). Market penetration of cloud-based EUC solutions is expected to increase significantly, reaching xx% by 2033. Technological disruptions, such as the emergence of artificial intelligence (AI) and machine learning (ML) in EUC, are reshaping the market landscape. Consumer behavior shifts, including preference for user-friendly interfaces and seamless integration with other applications, are impacting product development and market strategy.
Dominant Regions, Countries, or Segments in End User Computing Industry
North America currently dominates the End User Computing market, driven by high technological adoption, robust IT infrastructure, and the presence of major technology companies. However, the Asia-Pacific region is projected to experience the fastest growth, driven by increasing digitalization, rising disposable incomes, and expanding IT infrastructure. Within segments, the Cloud deployment mode and Large Enterprises are the largest contributors to overall market revenue. The BFSI sector shows the highest demand for EUC solutions due to stringent security and regulatory requirements.
Key Drivers:
- North America: High technological adoption, robust IT infrastructure.
- Asia-Pacific: Increasing digitalization, rising disposable incomes.
- BFSI: Stringent security & regulatory requirements.
- Cloud Deployment: Cost efficiency, scalability, and accessibility.
- Large Enterprises: Higher budgets and complex IT needs.
Dominance Factors: Market share, growth potential, technological maturity, regulatory environment.
End User Computing Industry Product Landscape
The End User Computing market offers a wide range of solutions, including virtual desktops, unified communication platforms, and software asset management tools. Recent product innovations focus on enhanced security, improved user experience, and seamless integration with other enterprise applications. Key performance metrics include user satisfaction, application performance, and security breaches. Unique selling propositions often center around ease of use, cost-effectiveness, and scalability. Technological advancements are concentrated on AI-powered automation, advanced analytics, and enhanced security protocols.
Key Drivers, Barriers & Challenges in End User Computing Industry
Key Drivers: The increasing adoption of cloud computing, the growing need for secure remote access, and the rising demand for enhanced productivity and collaboration tools are primary drivers. The shift towards digital transformation initiatives further fuels demand for robust EUC solutions.
Challenges & Restraints: The complexity of integrating EUC solutions with existing IT infrastructure poses a significant challenge. Security concerns, including data breaches and cyberattacks, are major restraints. The high initial investment cost and the need for specialized expertise also act as barriers to wider adoption. Supply chain disruptions impacting hardware availability can cause delays and cost increases. Stringent regulatory requirements add compliance complexity. Intense competition from established players and new entrants creates pricing pressure.
Emerging Opportunities in End User Computing Industry
Emerging opportunities include the expanding use of AI and ML to enhance user experience and improve security. The growing adoption of IoT devices creates a demand for integrated EUC solutions. The untapped potential in emerging markets and the increasing need for secure remote work solutions present promising avenues for growth. The development of user-friendly, intuitive interfaces is critical for market expansion.
Growth Accelerators in the End User Computing Industry
Technological breakthroughs in areas like AI, virtualization, and security are driving significant growth. Strategic partnerships between technology vendors and service providers are enabling the creation of comprehensive EUC solutions. Expansion into emerging markets and the development of tailored solutions for specific industries are key growth strategies.
Key Players Shaping the End User Computing Industry Market
- Infosys Limited
- HCL Infosystems Limited
- Nucleus Software Exports Limited
- Hitachi Systems Micro Clinic
- Vmware Inc
- Fujitsu Ltd
- Genpact
- Nutanix Inc
- NetApp Inc
- IGEL Technology
- Mindtree Limited
- Tech Mahindra Limited
- Amazon Web Service
- Citrix Systems Inc
- Dell Technologies
Notable Milestones in End User Computing Industry Sector
- November 2023: Fujitsu Ltd. launched a new technology for optimizing CPU and GPU resource allocation, addressing the global GPU shortage.
- August 2022: IBM and VMware partnered to deliver co-engineered hybrid cloud solutions for various industries.
- February 2022: CRISIL and Apparity LLC partnered to offer comprehensive EUC and model-risk solutions for financial institutions.
In-Depth End User Computing Industry Market Outlook
The future of the End User Computing market is bright, driven by sustained technological advancements, increasing digitalization across industries, and the growing demand for secure and efficient remote work solutions. Strategic opportunities lie in leveraging AI and ML to personalize user experiences, focusing on developing robust security measures, and expanding into untapped markets. The continued growth of cloud computing will remain a major catalyst, while the ongoing focus on user experience will drive innovation and competition.
End User Computing Industry Segmentation
-
1. Type
-
1.1. Solution
- 1.1.1. Virtual Desktop Infrastructure
- 1.1.2. Device Management
- 1.1.3. Other So
- 1.2. Services
-
1.1. Solution
-
2. Organization Size
- 2.1. Large Enterprises
- 2.2. Small & Medium Enterprises
-
3. Deployment Mode
- 3.1. On Premise
- 3.2. Cloud
-
4. End user Industry
- 4.1. IT and Telecom
- 4.2. Banking, Financial Services, and Insurance
- 4.3. Healthcare
- 4.4. Retail
- 4.5. Other E
End User Computing Industry Segmentation By Geography
- 1. North America
- 2. Europe
- 3. Asia Pacific
- 4. Latin America
- 5. Middle East and Africa
End User Computing Industry REPORT HIGHLIGHTS
| Aspects | Details |
|---|---|
| Study Period | 2019-2033 |
| Base Year | 2024 |
| Estimated Year | 2025 |
| Forecast Period | 2025-2033 |
| Historical Period | 2019-2024 |
| Growth Rate | CAGR of > 10.05% from 2019-2033 |
| Segmentation |
|
Table of Contents
- 1. Introduction
- 1.1. Research Scope
- 1.2. Market Segmentation
- 1.3. Research Methodology
- 1.4. Definitions and Assumptions
- 2. Executive Summary
- 2.1. Introduction
- 3. Market Dynamics
- 3.1. Introduction
- 3.2. Market Drivers
- 3.2.1. Drive to Increase the Productivity of Employees with Technology; Increasing Use of Cloud
- 3.3. Market Restrains
- 3.3.1. Issues Associated with Transformation and Integration of Processes By Organizations
- 3.4. Market Trends
- 3.4.1. Increasing Use of Cloud is Expected to Drive the End User Computing Market Growth
- 4. Market Factor Analysis
- 4.1. Porters Five Forces
- 4.2. Supply/Value Chain
- 4.3. PESTEL analysis
- 4.4. Market Entropy
- 4.5. Patent/Trademark Analysis
- 5. Global End User Computing Industry Analysis, Insights and Forecast, 2019-2031
- 5.1. Market Analysis, Insights and Forecast - by Type
- 5.1.1. Solution
- 5.1.1.1. Virtual Desktop Infrastructure
- 5.1.1.2. Device Management
- 5.1.1.3. Other So
- 5.1.2. Services
- 5.1.1. Solution
- 5.2. Market Analysis, Insights and Forecast - by Organization Size
- 5.2.1. Large Enterprises
- 5.2.2. Small & Medium Enterprises
- 5.3. Market Analysis, Insights and Forecast - by Deployment Mode
- 5.3.1. On Premise
- 5.3.2. Cloud
- 5.4. Market Analysis, Insights and Forecast - by End user Industry
- 5.4.1. IT and Telecom
- 5.4.2. Banking, Financial Services, and Insurance
- 5.4.3. Healthcare
- 5.4.4. Retail
- 5.4.5. Other E
- 5.5. Market Analysis, Insights and Forecast - by Region
- 5.5.1. North America
- 5.5.2. Europe
- 5.5.3. Asia Pacific
- 5.5.4. Latin America
- 5.5.5. Middle East and Africa
- 5.1. Market Analysis, Insights and Forecast - by Type
- 6. North America End User Computing Industry Analysis, Insights and Forecast, 2019-2031
- 6.1. Market Analysis, Insights and Forecast - by Type
- 6.1.1. Solution
- 6.1.1.1. Virtual Desktop Infrastructure
- 6.1.1.2. Device Management
- 6.1.1.3. Other So
- 6.1.2. Services
- 6.1.1. Solution
- 6.2. Market Analysis, Insights and Forecast - by Organization Size
- 6.2.1. Large Enterprises
- 6.2.2. Small & Medium Enterprises
- 6.3. Market Analysis, Insights and Forecast - by Deployment Mode
- 6.3.1. On Premise
- 6.3.2. Cloud
- 6.4. Market Analysis, Insights and Forecast - by End user Industry
- 6.4.1. IT and Telecom
- 6.4.2. Banking, Financial Services, and Insurance
- 6.4.3. Healthcare
- 6.4.4. Retail
- 6.4.5. Other E
- 6.1. Market Analysis, Insights and Forecast - by Type
- 7. Europe End User Computing Industry Analysis, Insights and Forecast, 2019-2031
- 7.1. Market Analysis, Insights and Forecast - by Type
- 7.1.1. Solution
- 7.1.1.1. Virtual Desktop Infrastructure
- 7.1.1.2. Device Management
- 7.1.1.3. Other So
- 7.1.2. Services
- 7.1.1. Solution
- 7.2. Market Analysis, Insights and Forecast - by Organization Size
- 7.2.1. Large Enterprises
- 7.2.2. Small & Medium Enterprises
- 7.3. Market Analysis, Insights and Forecast - by Deployment Mode
- 7.3.1. On Premise
- 7.3.2. Cloud
- 7.4. Market Analysis, Insights and Forecast - by End user Industry
- 7.4.1. IT and Telecom
- 7.4.2. Banking, Financial Services, and Insurance
- 7.4.3. Healthcare
- 7.4.4. Retail
- 7.4.5. Other E
- 7.1. Market Analysis, Insights and Forecast - by Type
- 8. Asia Pacific End User Computing Industry Analysis, Insights and Forecast, 2019-2031
- 8.1. Market Analysis, Insights and Forecast - by Type
- 8.1.1. Solution
- 8.1.1.1. Virtual Desktop Infrastructure
- 8.1.1.2. Device Management
- 8.1.1.3. Other So
- 8.1.2. Services
- 8.1.1. Solution
- 8.2. Market Analysis, Insights and Forecast - by Organization Size
- 8.2.1. Large Enterprises
- 8.2.2. Small & Medium Enterprises
- 8.3. Market Analysis, Insights and Forecast - by Deployment Mode
- 8.3.1. On Premise
- 8.3.2. Cloud
- 8.4. Market Analysis, Insights and Forecast - by End user Industry
- 8.4.1. IT and Telecom
- 8.4.2. Banking, Financial Services, and Insurance
- 8.4.3. Healthcare
- 8.4.4. Retail
- 8.4.5. Other E
- 8.1. Market Analysis, Insights and Forecast - by Type
- 9. Latin America End User Computing Industry Analysis, Insights and Forecast, 2019-2031
- 9.1. Market Analysis, Insights and Forecast - by Type
- 9.1.1. Solution
- 9.1.1.1. Virtual Desktop Infrastructure
- 9.1.1.2. Device Management
- 9.1.1.3. Other So
- 9.1.2. Services
- 9.1.1. Solution
- 9.2. Market Analysis, Insights and Forecast - by Organization Size
- 9.2.1. Large Enterprises
- 9.2.2. Small & Medium Enterprises
- 9.3. Market Analysis, Insights and Forecast - by Deployment Mode
- 9.3.1. On Premise
- 9.3.2. Cloud
- 9.4. Market Analysis, Insights and Forecast - by End user Industry
- 9.4.1. IT and Telecom
- 9.4.2. Banking, Financial Services, and Insurance
- 9.4.3. Healthcare
- 9.4.4. Retail
- 9.4.5. Other E
- 9.1. Market Analysis, Insights and Forecast - by Type
- 10. Middle East and Africa End User Computing Industry Analysis, Insights and Forecast, 2019-2031
- 10.1. Market Analysis, Insights and Forecast - by Type
- 10.1.1. Solution
- 10.1.1.1. Virtual Desktop Infrastructure
- 10.1.1.2. Device Management
- 10.1.1.3. Other So
- 10.1.2. Services
- 10.1.1. Solution
- 10.2. Market Analysis, Insights and Forecast - by Organization Size
- 10.2.1. Large Enterprises
- 10.2.2. Small & Medium Enterprises
- 10.3. Market Analysis, Insights and Forecast - by Deployment Mode
- 10.3.1. On Premise
- 10.3.2. Cloud
- 10.4. Market Analysis, Insights and Forecast - by End user Industry
- 10.4.1. IT and Telecom
- 10.4.2. Banking, Financial Services, and Insurance
- 10.4.3. Healthcare
- 10.4.4. Retail
- 10.4.5. Other E
- 10.1. Market Analysis, Insights and Forecast - by Type
- 11. North America End User Computing Industry Analysis, Insights and Forecast, 2019-2031
- 11.1. Market Analysis, Insights and Forecast - By Country/Sub-region
- 11.1.1.
- 12. Europe End User Computing Industry Analysis, Insights and Forecast, 2019-2031
- 12.1. Market Analysis, Insights and Forecast - By Country/Sub-region
- 12.1.1.
- 13. Asia Pacific End User Computing Industry Analysis, Insights and Forecast, 2019-2031
- 13.1. Market Analysis, Insights and Forecast - By Country/Sub-region
- 13.1.1.
- 14. Latin America End User Computing Industry Analysis, Insights and Forecast, 2019-2031
- 14.1. Market Analysis, Insights and Forecast - By Country/Sub-region
- 14.1.1.
- 15. Middle East and Africa End User Computing Industry Analysis, Insights and Forecast, 2019-2031
- 15.1. Market Analysis, Insights and Forecast - By Country/Sub-region
- 15.1.1.
- 16. Competitive Analysis
- 16.1. Global Market Share Analysis 2024
- 16.2. Company Profiles
- 16.2.1 Infosys Limited
- 16.2.1.1. Overview
- 16.2.1.2. Products
- 16.2.1.3. SWOT Analysis
- 16.2.1.4. Recent Developments
- 16.2.1.5. Financials (Based on Availability)
- 16.2.2 HCL Infosystems Limited
- 16.2.2.1. Overview
- 16.2.2.2. Products
- 16.2.2.3. SWOT Analysis
- 16.2.2.4. Recent Developments
- 16.2.2.5. Financials (Based on Availability)
- 16.2.3 Nucleus Software Exports Limited
- 16.2.3.1. Overview
- 16.2.3.2. Products
- 16.2.3.3. SWOT Analysis
- 16.2.3.4. Recent Developments
- 16.2.3.5. Financials (Based on Availability)
- 16.2.4 Hitachi Systems Micro Clinic
- 16.2.4.1. Overview
- 16.2.4.2. Products
- 16.2.4.3. SWOT Analysis
- 16.2.4.4. Recent Developments
- 16.2.4.5. Financials (Based on Availability)
- 16.2.5 Vmware Inc
- 16.2.5.1. Overview
- 16.2.5.2. Products
- 16.2.5.3. SWOT Analysis
- 16.2.5.4. Recent Developments
- 16.2.5.5. Financials (Based on Availability)
- 16.2.6 Fujitsu Ltd
- 16.2.6.1. Overview
- 16.2.6.2. Products
- 16.2.6.3. SWOT Analysis
- 16.2.6.4. Recent Developments
- 16.2.6.5. Financials (Based on Availability)
- 16.2.7 Genpact
- 16.2.7.1. Overview
- 16.2.7.2. Products
- 16.2.7.3. SWOT Analysis
- 16.2.7.4. Recent Developments
- 16.2.7.5. Financials (Based on Availability)
- 16.2.8 Nutanix Inc
- 16.2.8.1. Overview
- 16.2.8.2. Products
- 16.2.8.3. SWOT Analysis
- 16.2.8.4. Recent Developments
- 16.2.8.5. Financials (Based on Availability)
- 16.2.9 NetApp Inc
- 16.2.9.1. Overview
- 16.2.9.2. Products
- 16.2.9.3. SWOT Analysis
- 16.2.9.4. Recent Developments
- 16.2.9.5. Financials (Based on Availability)
- 16.2.10 IGEL Technology
- 16.2.10.1. Overview
- 16.2.10.2. Products
- 16.2.10.3. SWOT Analysis
- 16.2.10.4. Recent Developments
- 16.2.10.5. Financials (Based on Availability)
- 16.2.11 Mindtree Limited
- 16.2.11.1. Overview
- 16.2.11.2. Products
- 16.2.11.3. SWOT Analysis
- 16.2.11.4. Recent Developments
- 16.2.11.5. Financials (Based on Availability)
- 16.2.12 Tech Mahindra Limited
- 16.2.12.1. Overview
- 16.2.12.2. Products
- 16.2.12.3. SWOT Analysis
- 16.2.12.4. Recent Developments
- 16.2.12.5. Financials (Based on Availability)
- 16.2.13 Amazon Web Service
- 16.2.13.1. Overview
- 16.2.13.2. Products
- 16.2.13.3. SWOT Analysis
- 16.2.13.4. Recent Developments
- 16.2.13.5. Financials (Based on Availability)
- 16.2.14 Citrix Systems Inc
- 16.2.14.1. Overview
- 16.2.14.2. Products
- 16.2.14.3. SWOT Analysis
- 16.2.14.4. Recent Developments
- 16.2.14.5. Financials (Based on Availability)
- 16.2.15 Dell Technologies
- 16.2.15.1. Overview
- 16.2.15.2. Products
- 16.2.15.3. SWOT Analysis
- 16.2.15.4. Recent Developments
- 16.2.15.5. Financials (Based on Availability)
- 16.2.1 Infosys Limited
List of Figures
- Figure 1: Global End User Computing Industry Revenue Breakdown (Million, %) by Region 2024 & 2032
- Figure 2: North America End User Computing Industry Revenue (Million), by Country 2024 & 2032
- Figure 3: North America End User Computing Industry Revenue Share (%), by Country 2024 & 2032
- Figure 4: Europe End User Computing Industry Revenue (Million), by Country 2024 & 2032
- Figure 5: Europe End User Computing Industry Revenue Share (%), by Country 2024 & 2032
- Figure 6: Asia Pacific End User Computing Industry Revenue (Million), by Country 2024 & 2032
- Figure 7: Asia Pacific End User Computing Industry Revenue Share (%), by Country 2024 & 2032
- Figure 8: Latin America End User Computing Industry Revenue (Million), by Country 2024 & 2032
- Figure 9: Latin America End User Computing Industry Revenue Share (%), by Country 2024 & 2032
- Figure 10: Middle East and Africa End User Computing Industry Revenue (Million), by Country 2024 & 2032
- Figure 11: Middle East and Africa End User Computing Industry Revenue Share (%), by Country 2024 & 2032
- Figure 12: North America End User Computing Industry Revenue (Million), by Type 2024 & 2032
- Figure 13: North America End User Computing Industry Revenue Share (%), by Type 2024 & 2032
- Figure 14: North America End User Computing Industry Revenue (Million), by Organization Size 2024 & 2032
- Figure 15: North America End User Computing Industry Revenue Share (%), by Organization Size 2024 & 2032
- Figure 16: North America End User Computing Industry Revenue (Million), by Deployment Mode 2024 & 2032
- Figure 17: North America End User Computing Industry Revenue Share (%), by Deployment Mode 2024 & 2032
- Figure 18: North America End User Computing Industry Revenue (Million), by End user Industry 2024 & 2032
- Figure 19: North America End User Computing Industry Revenue Share (%), by End user Industry 2024 & 2032
- Figure 20: North America End User Computing Industry Revenue (Million), by Country 2024 & 2032
- Figure 21: North America End User Computing Industry Revenue Share (%), by Country 2024 & 2032
- Figure 22: Europe End User Computing Industry Revenue (Million), by Type 2024 & 2032
- Figure 23: Europe End User Computing Industry Revenue Share (%), by Type 2024 & 2032
- Figure 24: Europe End User Computing Industry Revenue (Million), by Organization Size 2024 & 2032
- Figure 25: Europe End User Computing Industry Revenue Share (%), by Organization Size 2024 & 2032
- Figure 26: Europe End User Computing Industry Revenue (Million), by Deployment Mode 2024 & 2032
- Figure 27: Europe End User Computing Industry Revenue Share (%), by Deployment Mode 2024 & 2032
- Figure 28: Europe End User Computing Industry Revenue (Million), by End user Industry 2024 & 2032
- Figure 29: Europe End User Computing Industry Revenue Share (%), by End user Industry 2024 & 2032
- Figure 30: Europe End User Computing Industry Revenue (Million), by Country 2024 & 2032
- Figure 31: Europe End User Computing Industry Revenue Share (%), by Country 2024 & 2032
- Figure 32: Asia Pacific End User Computing Industry Revenue (Million), by Type 2024 & 2032
- Figure 33: Asia Pacific End User Computing Industry Revenue Share (%), by Type 2024 & 2032
- Figure 34: Asia Pacific End User Computing Industry Revenue (Million), by Organization Size 2024 & 2032
- Figure 35: Asia Pacific End User Computing Industry Revenue Share (%), by Organization Size 2024 & 2032
- Figure 36: Asia Pacific End User Computing Industry Revenue (Million), by Deployment Mode 2024 & 2032
- Figure 37: Asia Pacific End User Computing Industry Revenue Share (%), by Deployment Mode 2024 & 2032
- Figure 38: Asia Pacific End User Computing Industry Revenue (Million), by End user Industry 2024 & 2032
- Figure 39: Asia Pacific End User Computing Industry Revenue Share (%), by End user Industry 2024 & 2032
- Figure 40: Asia Pacific End User Computing Industry Revenue (Million), by Country 2024 & 2032
- Figure 41: Asia Pacific End User Computing Industry Revenue Share (%), by Country 2024 & 2032
- Figure 42: Latin America End User Computing Industry Revenue (Million), by Type 2024 & 2032
- Figure 43: Latin America End User Computing Industry Revenue Share (%), by Type 2024 & 2032
- Figure 44: Latin America End User Computing Industry Revenue (Million), by Organization Size 2024 & 2032
- Figure 45: Latin America End User Computing Industry Revenue Share (%), by Organization Size 2024 & 2032
- Figure 46: Latin America End User Computing Industry Revenue (Million), by Deployment Mode 2024 & 2032
- Figure 47: Latin America End User Computing Industry Revenue Share (%), by Deployment Mode 2024 & 2032
- Figure 48: Latin America End User Computing Industry Revenue (Million), by End user Industry 2024 & 2032
- Figure 49: Latin America End User Computing Industry Revenue Share (%), by End user Industry 2024 & 2032
- Figure 50: Latin America End User Computing Industry Revenue (Million), by Country 2024 & 2032
- Figure 51: Latin America End User Computing Industry Revenue Share (%), by Country 2024 & 2032
- Figure 52: Middle East and Africa End User Computing Industry Revenue (Million), by Type 2024 & 2032
- Figure 53: Middle East and Africa End User Computing Industry Revenue Share (%), by Type 2024 & 2032
- Figure 54: Middle East and Africa End User Computing Industry Revenue (Million), by Organization Size 2024 & 2032
- Figure 55: Middle East and Africa End User Computing Industry Revenue Share (%), by Organization Size 2024 & 2032
- Figure 56: Middle East and Africa End User Computing Industry Revenue (Million), by Deployment Mode 2024 & 2032
- Figure 57: Middle East and Africa End User Computing Industry Revenue Share (%), by Deployment Mode 2024 & 2032
- Figure 58: Middle East and Africa End User Computing Industry Revenue (Million), by End user Industry 2024 & 2032
- Figure 59: Middle East and Africa End User Computing Industry Revenue Share (%), by End user Industry 2024 & 2032
- Figure 60: Middle East and Africa End User Computing Industry Revenue (Million), by Country 2024 & 2032
- Figure 61: Middle East and Africa End User Computing Industry Revenue Share (%), by Country 2024 & 2032
List of Tables
- Table 1: Global End User Computing Industry Revenue Million Forecast, by Region 2019 & 2032
- Table 2: Global End User Computing Industry Revenue Million Forecast, by Type 2019 & 2032
- Table 3: Global End User Computing Industry Revenue Million Forecast, by Organization Size 2019 & 2032
- Table 4: Global End User Computing Industry Revenue Million Forecast, by Deployment Mode 2019 & 2032
- Table 5: Global End User Computing Industry Revenue Million Forecast, by End user Industry 2019 & 2032
- Table 6: Global End User Computing Industry Revenue Million Forecast, by Region 2019 & 2032
- Table 7: Global End User Computing Industry Revenue Million Forecast, by Country 2019 & 2032
- Table 8: End User Computing Industry Revenue (Million) Forecast, by Application 2019 & 2032
- Table 9: Global End User Computing Industry Revenue Million Forecast, by Country 2019 & 2032
- Table 10: End User Computing Industry Revenue (Million) Forecast, by Application 2019 & 2032
- Table 11: Global End User Computing Industry Revenue Million Forecast, by Country 2019 & 2032
- Table 12: End User Computing Industry Revenue (Million) Forecast, by Application 2019 & 2032
- Table 13: Global End User Computing Industry Revenue Million Forecast, by Country 2019 & 2032
- Table 14: End User Computing Industry Revenue (Million) Forecast, by Application 2019 & 2032
- Table 15: Global End User Computing Industry Revenue Million Forecast, by Country 2019 & 2032
- Table 16: End User Computing Industry Revenue (Million) Forecast, by Application 2019 & 2032
- Table 17: Global End User Computing Industry Revenue Million Forecast, by Type 2019 & 2032
- Table 18: Global End User Computing Industry Revenue Million Forecast, by Organization Size 2019 & 2032
- Table 19: Global End User Computing Industry Revenue Million Forecast, by Deployment Mode 2019 & 2032
- Table 20: Global End User Computing Industry Revenue Million Forecast, by End user Industry 2019 & 2032
- Table 21: Global End User Computing Industry Revenue Million Forecast, by Country 2019 & 2032
- Table 22: Global End User Computing Industry Revenue Million Forecast, by Type 2019 & 2032
- Table 23: Global End User Computing Industry Revenue Million Forecast, by Organization Size 2019 & 2032
- Table 24: Global End User Computing Industry Revenue Million Forecast, by Deployment Mode 2019 & 2032
- Table 25: Global End User Computing Industry Revenue Million Forecast, by End user Industry 2019 & 2032
- Table 26: Global End User Computing Industry Revenue Million Forecast, by Country 2019 & 2032
- Table 27: Global End User Computing Industry Revenue Million Forecast, by Type 2019 & 2032
- Table 28: Global End User Computing Industry Revenue Million Forecast, by Organization Size 2019 & 2032
- Table 29: Global End User Computing Industry Revenue Million Forecast, by Deployment Mode 2019 & 2032
- Table 30: Global End User Computing Industry Revenue Million Forecast, by End user Industry 2019 & 2032
- Table 31: Global End User Computing Industry Revenue Million Forecast, by Country 2019 & 2032
- Table 32: Global End User Computing Industry Revenue Million Forecast, by Type 2019 & 2032
- Table 33: Global End User Computing Industry Revenue Million Forecast, by Organization Size 2019 & 2032
- Table 34: Global End User Computing Industry Revenue Million Forecast, by Deployment Mode 2019 & 2032
- Table 35: Global End User Computing Industry Revenue Million Forecast, by End user Industry 2019 & 2032
- Table 36: Global End User Computing Industry Revenue Million Forecast, by Country 2019 & 2032
- Table 37: Global End User Computing Industry Revenue Million Forecast, by Type 2019 & 2032
- Table 38: Global End User Computing Industry Revenue Million Forecast, by Organization Size 2019 & 2032
- Table 39: Global End User Computing Industry Revenue Million Forecast, by Deployment Mode 2019 & 2032
- Table 40: Global End User Computing Industry Revenue Million Forecast, by End user Industry 2019 & 2032
- Table 41: Global End User Computing Industry Revenue Million Forecast, by Country 2019 & 2032
Frequently Asked Questions
1. What is the projected Compound Annual Growth Rate (CAGR) of the End User Computing Industry?
The projected CAGR is approximately > 10.05%.
2. Which companies are prominent players in the End User Computing Industry?
Key companies in the market include Infosys Limited, HCL Infosystems Limited, Nucleus Software Exports Limited, Hitachi Systems Micro Clinic, Vmware Inc, Fujitsu Ltd, Genpact, Nutanix Inc, NetApp Inc, IGEL Technology, Mindtree Limited, Tech Mahindra Limited, Amazon Web Service, Citrix Systems Inc, Dell Technologies.
3. What are the main segments of the End User Computing Industry?
The market segments include Type, Organization Size, Deployment Mode, End user Industry.
4. Can you provide details about the market size?
The market size is estimated to be USD 11.97 Million as of 2022.
5. What are some drivers contributing to market growth?
Drive to Increase the Productivity of Employees with Technology; Increasing Use of Cloud.
6. What are the notable trends driving market growth?
Increasing Use of Cloud is Expected to Drive the End User Computing Market Growth.
7. Are there any restraints impacting market growth?
Issues Associated with Transformation and Integration of Processes By Organizations.
8. Can you provide examples of recent developments in the market?
November 2023 - Fujitsu Ltd Technology for the optimization of the use of CPUs and GPUs by allocating resources on a real-time basis to prioritize processes with high performance prioritise processes with high performance, even when running programs using GPUs. For the worldwide shortage of GPUs, which has been triggered by a growing demand for intelligent Artificial Intelligence, Deep Learning, and more applications, Fujitsu developed a new technology that optimizes user computing resources.
9. What pricing options are available for accessing the report?
Pricing options include single-user, multi-user, and enterprise licenses priced at USD 4750, USD 5250, and USD 8750 respectively.
10. Is the market size provided in terms of value or volume?
The market size is provided in terms of value, measured in Million.
11. Are there any specific market keywords associated with the report?
Yes, the market keyword associated with the report is "End User Computing Industry," which aids in identifying and referencing the specific market segment covered.
12. How do I determine which pricing option suits my needs best?
The pricing options vary based on user requirements and access needs. Individual users may opt for single-user licenses, while businesses requiring broader access may choose multi-user or enterprise licenses for cost-effective access to the report.
13. Are there any additional resources or data provided in the End User Computing Industry report?
While the report offers comprehensive insights, it's advisable to review the specific contents or supplementary materials provided to ascertain if additional resources or data are available.
14. How can I stay updated on further developments or reports in the End User Computing Industry?
To stay informed about further developments, trends, and reports in the End User Computing Industry, consider subscribing to industry newsletters, following relevant companies and organizations, or regularly checking reputable industry news sources and publications.
Methodology
Step 1 - Identification of Relevant Samples Size from Population Database


Step 2 - Approaches for Defining Global Market Size (Value, Volume* & Price*)

Note*: In applicable scenarios
Step 3 - Data Sources
Primary Research
- Web Analytics
- Survey Reports
- Research Institute
- Latest Research Reports
- Opinion Leaders
Secondary Research
- Annual Reports
- White Paper
- Latest Press Release
- Industry Association
- Paid Database
- Investor Presentations

Step 4 - Data Triangulation
Involves using different sources of information in order to increase the validity of a study
These sources are likely to be stakeholders in a program - participants, other researchers, program staff, other community members, and so on.
Then we put all data in single framework & apply various statistical tools to find out the dynamic on the market.
During the analysis stage, feedback from the stakeholder groups would be compared to determine areas of agreement as well as areas of divergence


