
Key Insights
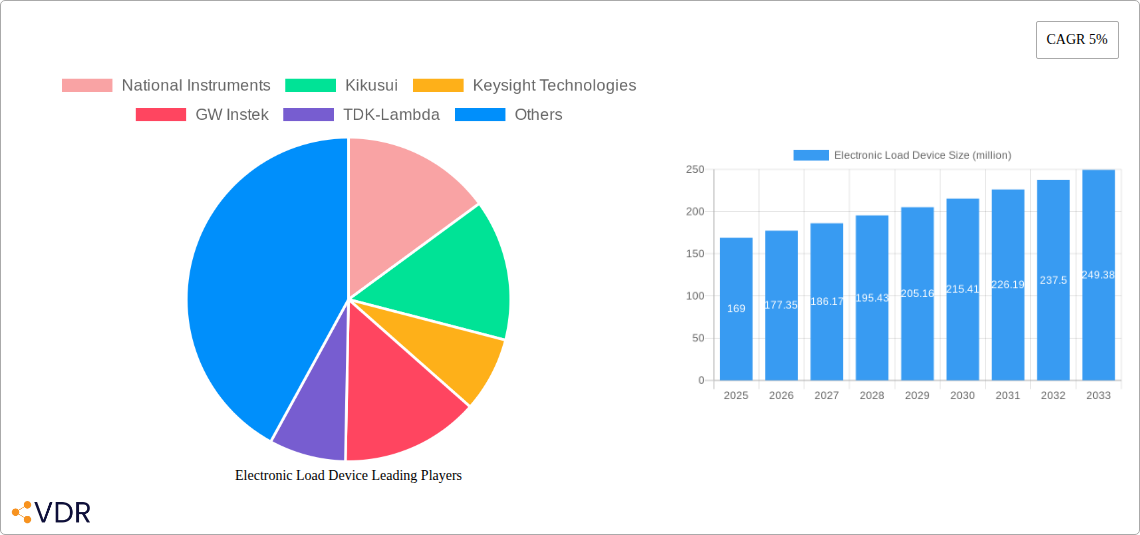
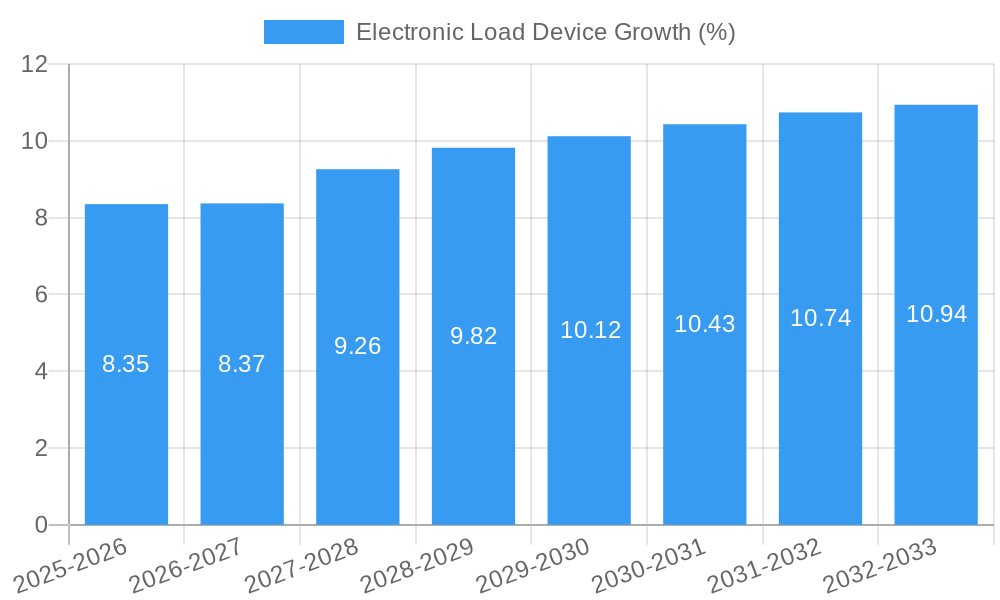
The Electronic Load Device market, valued at $169 million in 2025, is projected to experience robust growth, driven by the increasing demand for efficient power testing solutions across various industries. The Compound Annual Growth Rate (CAGR) of 5% from 2025 to 2033 indicates a steady expansion, fueled by factors like the proliferation of electric vehicles (EVs), renewable energy adoption, and the growing need for advanced power electronics in consumer electronics and industrial automation. The market's growth is further bolstered by technological advancements leading to more compact, efficient, and precise electronic load devices, along with increasing automation in manufacturing and testing processes. Key players like National Instruments, Keysight Technologies, and TDK-Lambda are driving innovation and expanding their market share through strategic partnerships and product diversification. The market is segmented based on power capacity, type (programmable, non-programmable), application (automotive, industrial, consumer electronics), and geography. While precise regional data is unavailable, a logical assumption based on global market trends suggests significant growth in Asia-Pacific, driven by increasing manufacturing activity in countries like China and India. The competitive landscape is characterized by both established players and emerging companies, fostering innovation and driving down prices, making electronic load devices more accessible to a wider range of industries.
The continued growth of the electronic load device market hinges on the continued expansion of industries mentioned above. Factors such as stringent regulatory requirements for power efficiency and the adoption of Industry 4.0 principles will further accelerate market growth. Potential restraints include the relatively high cost of advanced electronic load devices and the availability of skilled technicians to operate and maintain these systems. However, these challenges are likely to be mitigated by continuous technological advancements and the increasing availability of training and support services. Over the forecast period, the market is expected to witness increased consolidation through mergers and acquisitions, leading to a more concentrated landscape dominated by a handful of major players.
Electronic Load Device Market Report: 2019-2033
This comprehensive report provides a detailed analysis of the Electronic Load Device market, encompassing market dynamics, growth trends, regional dominance, product landscape, key players, and future outlook. The study period covers 2019-2033, with 2025 as the base and estimated year, and a forecast period of 2025-2033. The historical period analyzed is 2019-2024. This report is crucial for industry professionals, investors, and market entrants seeking a deep understanding of this dynamic sector. The global electronic load device market is projected to reach xx million units by 2033.
Electronic Load Device Market Dynamics & Structure
The Electronic Load Device market exhibits a moderately concentrated structure, with key players like Keysight Technologies, National Instruments, and TDK-Lambda holding significant market share. Technological innovation, particularly in areas like higher power handling, precision, and programmability, is a major driver. Stringent regulatory frameworks concerning energy efficiency and safety standards influence product development and adoption. The market faces competition from alternative testing solutions, but the increasing complexity of electronic devices sustains demand for sophisticated electronic load devices. End-user demographics are expanding across various industries, including automotive, aerospace, renewable energy, and telecommunications. M&A activity in the sector has been moderate, with a focus on enhancing technological capabilities and expanding market reach. In 2024, approximately xx M&A deals were recorded within the parent market of electronic testing equipment, contributing to market consolidation.
- Market Concentration: Moderately concentrated, with top 5 players holding xx% market share (2024).
- Innovation Drivers: Higher power handling, improved precision, programmable features, and smaller form factors.
- Regulatory Landscape: Compliance with safety and energy efficiency standards (e.g., IEC, UL).
- Competitive Substitutes: Software-based simulation tools, simpler load banks.
- End-User Demographics: Automotive, aerospace, renewable energy, telecommunications, consumer electronics.
- M&A Trends: Strategic acquisitions to expand product portfolios and geographical reach. xx deals predicted for 2025-2033.
Electronic Load Device Growth Trends & Insights
The global Electronic Load Device market has experienced consistent growth over the past five years, driven by increased demand from the expanding electronics industry. The market size witnessed a CAGR of xx% during the historical period (2019-2024), reaching xx million units in 2024. This growth is fueled by the rising adoption of electronic devices across various sectors, coupled with advancements in electronic load device technology. The increasing complexity of electronic systems and the need for rigorous testing procedures further contribute to market expansion. Technological disruptions, such as the integration of digital control and advanced communication interfaces, are transforming the landscape. Consumer behavior shifts towards higher performance, smaller footprint, and enhanced features drive innovation within the industry. The market penetration rate is expected to reach xx% by 2033. This growth is further accelerated by the growing demand for higher power handling capacities and increased precision in electronic load devices, primarily driven by the expanding electric vehicle and renewable energy sectors.
Dominant Regions, Countries, or Segments in Electronic Load Device
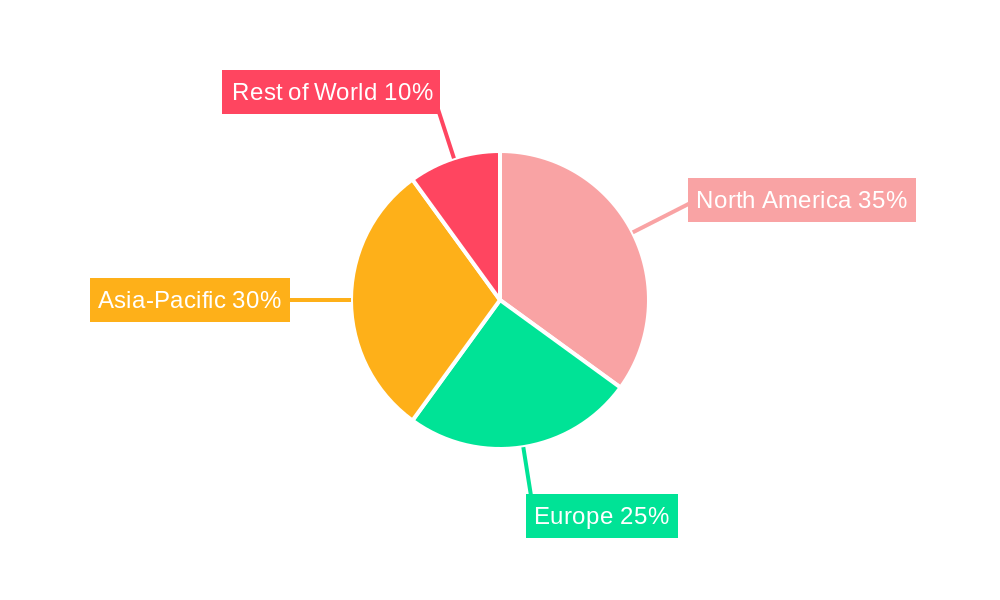
North America currently holds the largest market share in Electronic Load Devices, driven by a robust electronics manufacturing base and strong R&D investments. Asia-Pacific, particularly China and Japan, is experiencing rapid growth, fueled by burgeoning domestic electronics manufacturing and increasing demand for advanced testing equipment. Europe shows steady growth, driven by the automotive and renewable energy sectors.
- North America: Strong R&D investments, established electronics industry, high adoption rates.
- Asia-Pacific (China, Japan): Rapid growth, large manufacturing base, increasing domestic demand.
- Europe: Steady growth, driven by automotive and renewable energy sectors.
- Key Growth Drivers: Stringent quality control regulations, expanding electronics manufacturing, increasing demand for higher power devices and precision.
Electronic Load Device Product Landscape
The Electronic Load Device market offers a range of products catering to diverse applications and performance requirements. Products vary based on power handling capacity, voltage ranges, accuracy levels, and communication interfaces. Recent innovations include the integration of advanced digital control, enabling precise load simulation and automated testing procedures. These advancements improve efficiency, accuracy, and ease of use, enhancing the overall testing process. Unique selling propositions often include features like programmable load profiles, remote control capabilities, and integrated data logging functions.
Key Drivers, Barriers & Challenges in Electronic Load Device
Key Drivers: The increasing complexity of electronic devices, stricter quality control requirements in various industries (automotive, aerospace, renewable energy), and the rise of automation in testing processes are key market drivers. Advancements in semiconductor technology also contribute to the demand for more sophisticated electronic load devices.
Key Challenges: Supply chain disruptions, particularly regarding specialized components, can impact production and delivery timelines. The high cost of advanced electronic load devices can restrict adoption, especially in smaller companies. Intense competition and the emergence of alternative testing methods pose significant challenges. The impact of supply chain disruptions was estimated to reduce market growth by approximately xx% in 2022.
Emerging Opportunities in Electronic Load Device
Emerging opportunities lie in the integration of Artificial Intelligence (AI) and machine learning for advanced test automation. The expanding adoption of electric vehicles and renewable energy systems creates significant demand for high-power electronic load devices. Development of miniaturized and low-cost devices for consumer electronics presents another promising area.
Growth Accelerators in the Electronic Load Device Industry
Technological breakthroughs in power semiconductor devices and advanced control algorithms will drive long-term market growth. Strategic partnerships between electronic load device manufacturers and test equipment providers are expected to expand market penetration and accelerate innovation. Expansion into emerging markets and the development of tailored solutions for specific applications will further fuel market growth.
Key Players Shaping the Electronic Load Device Market
- National Instruments
- Kikusui
- Keysight Technologies
- GW Instek
- TDK-Lambda
- ITECH
- Shenzhen Maynuo Electronic
- Nanjing Maynuo Electronics
- Goodwill Electronics
- Changzhou Dingchen Electronics
- Feistech Technology
- Beijing Beixin Keyuan Instruments
- Boji Electronics Co., Ltd.
Notable Milestones in Electronic Load Device Sector
- 2020: Keysight Technologies launched a new series of high-power electronic load devices.
- 2021: National Instruments integrated AI capabilities into its electronic load device software.
- 2022: A significant merger between two mid-sized electronic load device manufacturers expanded market consolidation.
- 2023: Introduction of a new generation of miniaturized and highly precise electronic load devices.
In-Depth Electronic Load Device Market Outlook
The Electronic Load Device market is poised for robust growth in the coming years. The confluence of technological advancements, increasing demand from various industries, and expansion into new markets will drive significant market expansion. Strategic investments in R&D, fostering collaborations, and focusing on customized solutions will be crucial for success in this dynamic sector. The market is expected to witness a significant increase in the adoption rate of advanced features and functionalities, further boosting market growth and enhancing overall industry value.
Electronic Load Device Segmentation
-
1. Application
- 1.1. Electronic Manufacturing Industry
- 1.2. New Energy Field
- 1.3. Communication Industry
- 1.4. Other
-
2. Type
- 2.1. DC
- 2.2. AC
Electronic Load Device Segmentation By Geography
-
1. North America
- 1.1. United States
- 1.2. Canada
- 1.3. Mexico
-
2. South America
- 2.1. Brazil
- 2.2. Argentina
- 2.3. Rest of South America
-
3. Europe
- 3.1. United Kingdom
- 3.2. Germany
- 3.3. France
- 3.4. Italy
- 3.5. Spain
- 3.6. Russia
- 3.7. Benelux
- 3.8. Nordics
- 3.9. Rest of Europe
-
4. Middle East & Africa
- 4.1. Turkey
- 4.2. Israel
- 4.3. GCC
- 4.4. North Africa
- 4.5. South Africa
- 4.6. Rest of Middle East & Africa
-
5. Asia Pacific
- 5.1. China
- 5.2. India
- 5.3. Japan
- 5.4. South Korea
- 5.5. ASEAN
- 5.6. Oceania
- 5.7. Rest of Asia Pacific
Electronic Load Device REPORT HIGHLIGHTS
| Aspects | Details |
|---|---|
| Study Period | 2019-2033 |
| Base Year | 2024 |
| Estimated Year | 2025 |
| Forecast Period | 2025-2033 |
| Historical Period | 2019-2024 |
| Growth Rate | CAGR of 5% from 2019-2033 |
| Segmentation |
|
Table of Contents
- 1. Introduction
- 1.1. Research Scope
- 1.2. Market Segmentation
- 1.3. Research Methodology
- 1.4. Definitions and Assumptions
- 2. Executive Summary
- 2.1. Introduction
- 3. Market Dynamics
- 3.1. Introduction
- 3.2. Market Drivers
- 3.3. Market Restrains
- 3.4. Market Trends
- 4. Market Factor Analysis
- 4.1. Porters Five Forces
- 4.2. Supply/Value Chain
- 4.3. PESTEL analysis
- 4.4. Market Entropy
- 4.5. Patent/Trademark Analysis
- 5. Global Electronic Load Device Analysis, Insights and Forecast, 2019-2031
- 5.1. Market Analysis, Insights and Forecast - by Application
- 5.1.1. Electronic Manufacturing Industry
- 5.1.2. New Energy Field
- 5.1.3. Communication Industry
- 5.1.4. Other
- 5.2. Market Analysis, Insights and Forecast - by Type
- 5.2.1. DC
- 5.2.2. AC
- 5.3. Market Analysis, Insights and Forecast - by Region
- 5.3.1. North America
- 5.3.2. South America
- 5.3.3. Europe
- 5.3.4. Middle East & Africa
- 5.3.5. Asia Pacific
- 5.1. Market Analysis, Insights and Forecast - by Application
- 6. North America Electronic Load Device Analysis, Insights and Forecast, 2019-2031
- 6.1. Market Analysis, Insights and Forecast - by Application
- 6.1.1. Electronic Manufacturing Industry
- 6.1.2. New Energy Field
- 6.1.3. Communication Industry
- 6.1.4. Other
- 6.2. Market Analysis, Insights and Forecast - by Type
- 6.2.1. DC
- 6.2.2. AC
- 6.1. Market Analysis, Insights and Forecast - by Application
- 7. South America Electronic Load Device Analysis, Insights and Forecast, 2019-2031
- 7.1. Market Analysis, Insights and Forecast - by Application
- 7.1.1. Electronic Manufacturing Industry
- 7.1.2. New Energy Field
- 7.1.3. Communication Industry
- 7.1.4. Other
- 7.2. Market Analysis, Insights and Forecast - by Type
- 7.2.1. DC
- 7.2.2. AC
- 7.1. Market Analysis, Insights and Forecast - by Application
- 8. Europe Electronic Load Device Analysis, Insights and Forecast, 2019-2031
- 8.1. Market Analysis, Insights and Forecast - by Application
- 8.1.1. Electronic Manufacturing Industry
- 8.1.2. New Energy Field
- 8.1.3. Communication Industry
- 8.1.4. Other
- 8.2. Market Analysis, Insights and Forecast - by Type
- 8.2.1. DC
- 8.2.2. AC
- 8.1. Market Analysis, Insights and Forecast - by Application
- 9. Middle East & Africa Electronic Load Device Analysis, Insights and Forecast, 2019-2031
- 9.1. Market Analysis, Insights and Forecast - by Application
- 9.1.1. Electronic Manufacturing Industry
- 9.1.2. New Energy Field
- 9.1.3. Communication Industry
- 9.1.4. Other
- 9.2. Market Analysis, Insights and Forecast - by Type
- 9.2.1. DC
- 9.2.2. AC
- 9.1. Market Analysis, Insights and Forecast - by Application
- 10. Asia Pacific Electronic Load Device Analysis, Insights and Forecast, 2019-2031
- 10.1. Market Analysis, Insights and Forecast - by Application
- 10.1.1. Electronic Manufacturing Industry
- 10.1.2. New Energy Field
- 10.1.3. Communication Industry
- 10.1.4. Other
- 10.2. Market Analysis, Insights and Forecast - by Type
- 10.2.1. DC
- 10.2.2. AC
- 10.1. Market Analysis, Insights and Forecast - by Application
- 11. Competitive Analysis
- 11.1. Global Market Share Analysis 2024
- 11.2. Company Profiles
- 11.2.1 National Instruments
- 11.2.1.1. Overview
- 11.2.1.2. Products
- 11.2.1.3. SWOT Analysis
- 11.2.1.4. Recent Developments
- 11.2.1.5. Financials (Based on Availability)
- 11.2.2 Kikusui
- 11.2.2.1. Overview
- 11.2.2.2. Products
- 11.2.2.3. SWOT Analysis
- 11.2.2.4. Recent Developments
- 11.2.2.5. Financials (Based on Availability)
- 11.2.3 Keysight Technologies
- 11.2.3.1. Overview
- 11.2.3.2. Products
- 11.2.3.3. SWOT Analysis
- 11.2.3.4. Recent Developments
- 11.2.3.5. Financials (Based on Availability)
- 11.2.4 GW Instek
- 11.2.4.1. Overview
- 11.2.4.2. Products
- 11.2.4.3. SWOT Analysis
- 11.2.4.4. Recent Developments
- 11.2.4.5. Financials (Based on Availability)
- 11.2.5 TDK-Lambda
- 11.2.5.1. Overview
- 11.2.5.2. Products
- 11.2.5.3. SWOT Analysis
- 11.2.5.4. Recent Developments
- 11.2.5.5. Financials (Based on Availability)
- 11.2.6 ITECH
- 11.2.6.1. Overview
- 11.2.6.2. Products
- 11.2.6.3. SWOT Analysis
- 11.2.6.4. Recent Developments
- 11.2.6.5. Financials (Based on Availability)
- 11.2.7 Shenzhen Maynuo Electronic
- 11.2.7.1. Overview
- 11.2.7.2. Products
- 11.2.7.3. SWOT Analysis
- 11.2.7.4. Recent Developments
- 11.2.7.5. Financials (Based on Availability)
- 11.2.8 Nanjing Maynuo Electronics
- 11.2.8.1. Overview
- 11.2.8.2. Products
- 11.2.8.3. SWOT Analysis
- 11.2.8.4. Recent Developments
- 11.2.8.5. Financials (Based on Availability)
- 11.2.9 Goodwill Electronics
- 11.2.9.1. Overview
- 11.2.9.2. Products
- 11.2.9.3. SWOT Analysis
- 11.2.9.4. Recent Developments
- 11.2.9.5. Financials (Based on Availability)
- 11.2.10 Changzhou Dingchen Electronics
- 11.2.10.1. Overview
- 11.2.10.2. Products
- 11.2.10.3. SWOT Analysis
- 11.2.10.4. Recent Developments
- 11.2.10.5. Financials (Based on Availability)
- 11.2.11 Feistech Technology
- 11.2.11.1. Overview
- 11.2.11.2. Products
- 11.2.11.3. SWOT Analysis
- 11.2.11.4. Recent Developments
- 11.2.11.5. Financials (Based on Availability)
- 11.2.12 Beijing Beixin Keyuan Instruments
- 11.2.12.1. Overview
- 11.2.12.2. Products
- 11.2.12.3. SWOT Analysis
- 11.2.12.4. Recent Developments
- 11.2.12.5. Financials (Based on Availability)
- 11.2.13 Boji Electronics Co. Ltd.
- 11.2.13.1. Overview
- 11.2.13.2. Products
- 11.2.13.3. SWOT Analysis
- 11.2.13.4. Recent Developments
- 11.2.13.5. Financials (Based on Availability)
- 11.2.1 National Instruments
List of Figures
- Figure 1: Global Electronic Load Device Revenue Breakdown (million, %) by Region 2024 & 2032
- Figure 2: North America Electronic Load Device Revenue (million), by Application 2024 & 2032
- Figure 3: North America Electronic Load Device Revenue Share (%), by Application 2024 & 2032
- Figure 4: North America Electronic Load Device Revenue (million), by Type 2024 & 2032
- Figure 5: North America Electronic Load Device Revenue Share (%), by Type 2024 & 2032
- Figure 6: North America Electronic Load Device Revenue (million), by Country 2024 & 2032
- Figure 7: North America Electronic Load Device Revenue Share (%), by Country 2024 & 2032
- Figure 8: South America Electronic Load Device Revenue (million), by Application 2024 & 2032
- Figure 9: South America Electronic Load Device Revenue Share (%), by Application 2024 & 2032
- Figure 10: South America Electronic Load Device Revenue (million), by Type 2024 & 2032
- Figure 11: South America Electronic Load Device Revenue Share (%), by Type 2024 & 2032
- Figure 12: South America Electronic Load Device Revenue (million), by Country 2024 & 2032
- Figure 13: South America Electronic Load Device Revenue Share (%), by Country 2024 & 2032
- Figure 14: Europe Electronic Load Device Revenue (million), by Application 2024 & 2032
- Figure 15: Europe Electronic Load Device Revenue Share (%), by Application 2024 & 2032
- Figure 16: Europe Electronic Load Device Revenue (million), by Type 2024 & 2032
- Figure 17: Europe Electronic Load Device Revenue Share (%), by Type 2024 & 2032
- Figure 18: Europe Electronic Load Device Revenue (million), by Country 2024 & 2032
- Figure 19: Europe Electronic Load Device Revenue Share (%), by Country 2024 & 2032
- Figure 20: Middle East & Africa Electronic Load Device Revenue (million), by Application 2024 & 2032
- Figure 21: Middle East & Africa Electronic Load Device Revenue Share (%), by Application 2024 & 2032
- Figure 22: Middle East & Africa Electronic Load Device Revenue (million), by Type 2024 & 2032
- Figure 23: Middle East & Africa Electronic Load Device Revenue Share (%), by Type 2024 & 2032
- Figure 24: Middle East & Africa Electronic Load Device Revenue (million), by Country 2024 & 2032
- Figure 25: Middle East & Africa Electronic Load Device Revenue Share (%), by Country 2024 & 2032
- Figure 26: Asia Pacific Electronic Load Device Revenue (million), by Application 2024 & 2032
- Figure 27: Asia Pacific Electronic Load Device Revenue Share (%), by Application 2024 & 2032
- Figure 28: Asia Pacific Electronic Load Device Revenue (million), by Type 2024 & 2032
- Figure 29: Asia Pacific Electronic Load Device Revenue Share (%), by Type 2024 & 2032
- Figure 30: Asia Pacific Electronic Load Device Revenue (million), by Country 2024 & 2032
- Figure 31: Asia Pacific Electronic Load Device Revenue Share (%), by Country 2024 & 2032
List of Tables
- Table 1: Global Electronic Load Device Revenue million Forecast, by Region 2019 & 2032
- Table 2: Global Electronic Load Device Revenue million Forecast, by Application 2019 & 2032
- Table 3: Global Electronic Load Device Revenue million Forecast, by Type 2019 & 2032
- Table 4: Global Electronic Load Device Revenue million Forecast, by Region 2019 & 2032
- Table 5: Global Electronic Load Device Revenue million Forecast, by Application 2019 & 2032
- Table 6: Global Electronic Load Device Revenue million Forecast, by Type 2019 & 2032
- Table 7: Global Electronic Load Device Revenue million Forecast, by Country 2019 & 2032
- Table 8: United States Electronic Load Device Revenue (million) Forecast, by Application 2019 & 2032
- Table 9: Canada Electronic Load Device Revenue (million) Forecast, by Application 2019 & 2032
- Table 10: Mexico Electronic Load Device Revenue (million) Forecast, by Application 2019 & 2032
- Table 11: Global Electronic Load Device Revenue million Forecast, by Application 2019 & 2032
- Table 12: Global Electronic Load Device Revenue million Forecast, by Type 2019 & 2032
- Table 13: Global Electronic Load Device Revenue million Forecast, by Country 2019 & 2032
- Table 14: Brazil Electronic Load Device Revenue (million) Forecast, by Application 2019 & 2032
- Table 15: Argentina Electronic Load Device Revenue (million) Forecast, by Application 2019 & 2032
- Table 16: Rest of South America Electronic Load Device Revenue (million) Forecast, by Application 2019 & 2032
- Table 17: Global Electronic Load Device Revenue million Forecast, by Application 2019 & 2032
- Table 18: Global Electronic Load Device Revenue million Forecast, by Type 2019 & 2032
- Table 19: Global Electronic Load Device Revenue million Forecast, by Country 2019 & 2032
- Table 20: United Kingdom Electronic Load Device Revenue (million) Forecast, by Application 2019 & 2032
- Table 21: Germany Electronic Load Device Revenue (million) Forecast, by Application 2019 & 2032
- Table 22: France Electronic Load Device Revenue (million) Forecast, by Application 2019 & 2032
- Table 23: Italy Electronic Load Device Revenue (million) Forecast, by Application 2019 & 2032
- Table 24: Spain Electronic Load Device Revenue (million) Forecast, by Application 2019 & 2032
- Table 25: Russia Electronic Load Device Revenue (million) Forecast, by Application 2019 & 2032
- Table 26: Benelux Electronic Load Device Revenue (million) Forecast, by Application 2019 & 2032
- Table 27: Nordics Electronic Load Device Revenue (million) Forecast, by Application 2019 & 2032
- Table 28: Rest of Europe Electronic Load Device Revenue (million) Forecast, by Application 2019 & 2032
- Table 29: Global Electronic Load Device Revenue million Forecast, by Application 2019 & 2032
- Table 30: Global Electronic Load Device Revenue million Forecast, by Type 2019 & 2032
- Table 31: Global Electronic Load Device Revenue million Forecast, by Country 2019 & 2032
- Table 32: Turkey Electronic Load Device Revenue (million) Forecast, by Application 2019 & 2032
- Table 33: Israel Electronic Load Device Revenue (million) Forecast, by Application 2019 & 2032
- Table 34: GCC Electronic Load Device Revenue (million) Forecast, by Application 2019 & 2032
- Table 35: North Africa Electronic Load Device Revenue (million) Forecast, by Application 2019 & 2032
- Table 36: South Africa Electronic Load Device Revenue (million) Forecast, by Application 2019 & 2032
- Table 37: Rest of Middle East & Africa Electronic Load Device Revenue (million) Forecast, by Application 2019 & 2032
- Table 38: Global Electronic Load Device Revenue million Forecast, by Application 2019 & 2032
- Table 39: Global Electronic Load Device Revenue million Forecast, by Type 2019 & 2032
- Table 40: Global Electronic Load Device Revenue million Forecast, by Country 2019 & 2032
- Table 41: China Electronic Load Device Revenue (million) Forecast, by Application 2019 & 2032
- Table 42: India Electronic Load Device Revenue (million) Forecast, by Application 2019 & 2032
- Table 43: Japan Electronic Load Device Revenue (million) Forecast, by Application 2019 & 2032
- Table 44: South Korea Electronic Load Device Revenue (million) Forecast, by Application 2019 & 2032
- Table 45: ASEAN Electronic Load Device Revenue (million) Forecast, by Application 2019 & 2032
- Table 46: Oceania Electronic Load Device Revenue (million) Forecast, by Application 2019 & 2032
- Table 47: Rest of Asia Pacific Electronic Load Device Revenue (million) Forecast, by Application 2019 & 2032
Frequently Asked Questions
1. What is the projected Compound Annual Growth Rate (CAGR) of the Electronic Load Device?
The projected CAGR is approximately 5%.
2. Which companies are prominent players in the Electronic Load Device?
Key companies in the market include National Instruments, Kikusui, Keysight Technologies, GW Instek, TDK-Lambda, ITECH, Shenzhen Maynuo Electronic, Nanjing Maynuo Electronics, Goodwill Electronics, Changzhou Dingchen Electronics, Feistech Technology, Beijing Beixin Keyuan Instruments, Boji Electronics Co., Ltd..
3. What are the main segments of the Electronic Load Device?
The market segments include Application, Type.
4. Can you provide details about the market size?
The market size is estimated to be USD 169 million as of 2022.
5. What are some drivers contributing to market growth?
N/A
6. What are the notable trends driving market growth?
N/A
7. Are there any restraints impacting market growth?
N/A
8. Can you provide examples of recent developments in the market?
N/A
9. What pricing options are available for accessing the report?
Pricing options include single-user, multi-user, and enterprise licenses priced at USD 2900.00, USD 4350.00, and USD 5800.00 respectively.
10. Is the market size provided in terms of value or volume?
The market size is provided in terms of value, measured in million.
11. Are there any specific market keywords associated with the report?
Yes, the market keyword associated with the report is "Electronic Load Device," which aids in identifying and referencing the specific market segment covered.
12. How do I determine which pricing option suits my needs best?
The pricing options vary based on user requirements and access needs. Individual users may opt for single-user licenses, while businesses requiring broader access may choose multi-user or enterprise licenses for cost-effective access to the report.
13. Are there any additional resources or data provided in the Electronic Load Device report?
While the report offers comprehensive insights, it's advisable to review the specific contents or supplementary materials provided to ascertain if additional resources or data are available.
14. How can I stay updated on further developments or reports in the Electronic Load Device?
To stay informed about further developments, trends, and reports in the Electronic Load Device, consider subscribing to industry newsletters, following relevant companies and organizations, or regularly checking reputable industry news sources and publications.
Methodology
Step 1 - Identification of Relevant Samples Size from Population Database


Step 2 - Approaches for Defining Global Market Size (Value, Volume* & Price*)

Note*: In applicable scenarios
Step 3 - Data Sources
Primary Research
- Web Analytics
- Survey Reports
- Research Institute
- Latest Research Reports
- Opinion Leaders
Secondary Research
- Annual Reports
- White Paper
- Latest Press Release
- Industry Association
- Paid Database
- Investor Presentations

Step 4 - Data Triangulation
Involves using different sources of information in order to increase the validity of a study
These sources are likely to be stakeholders in a program - participants, other researchers, program staff, other community members, and so on.
Then we put all data in single framework & apply various statistical tools to find out the dynamic on the market.
During the analysis stage, feedback from the stakeholder groups would be compared to determine areas of agreement as well as areas of divergence


