
Key Insights
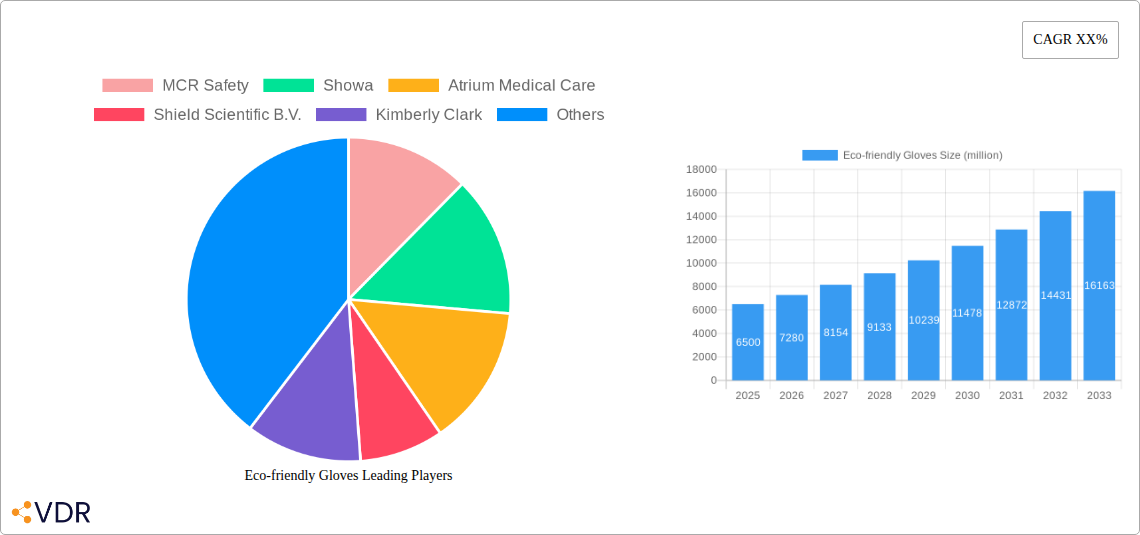
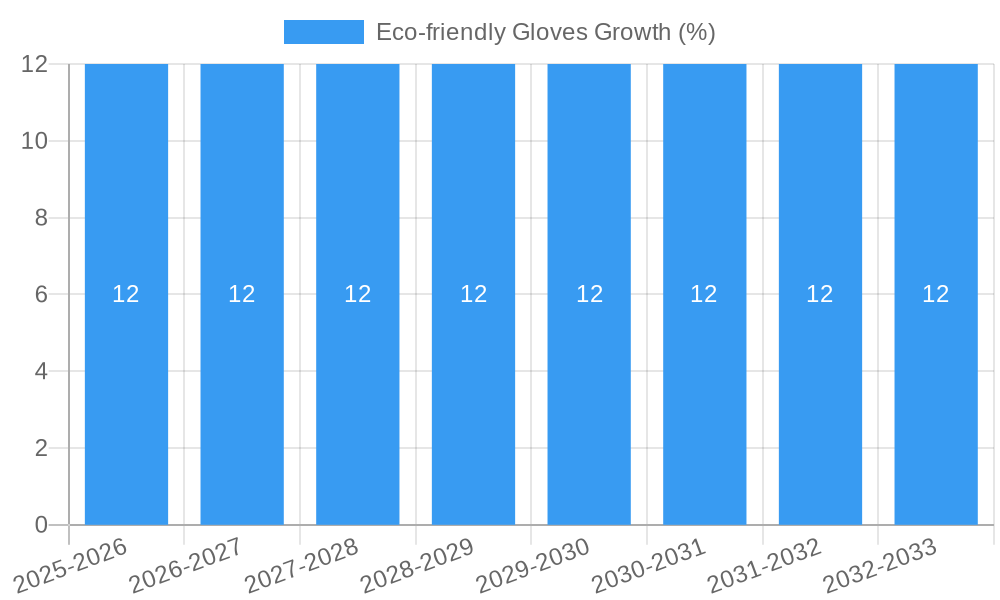
The global Eco-friendly Gloves market is poised for significant expansion, projected to reach approximately $6,500 million by 2025 and demonstrating a robust Compound Annual Growth Rate (CAGR) of 12% through 2033. This burgeoning market is fueled by an escalating global consciousness surrounding environmental sustainability, directly impacting consumer preferences and regulatory landscapes. The increasing demand for biodegradable and recyclable alternatives to traditional disposable gloves across various industries is a primary driver. Key applications such as the Food and Beverage sector, driven by hygiene mandates and a desire for reduced environmental footprint, alongside the Pharmaceutical industry's stringent quality and safety requirements, are pivotal to this growth. Furthermore, the Chemical Industry is actively seeking sustainable material solutions to minimize hazardous waste. The automotive sector is also contributing, with a growing emphasis on eco-friendly manufacturing processes and components. This upward trajectory underscores a fundamental shift towards greener supply chains and responsible consumption.
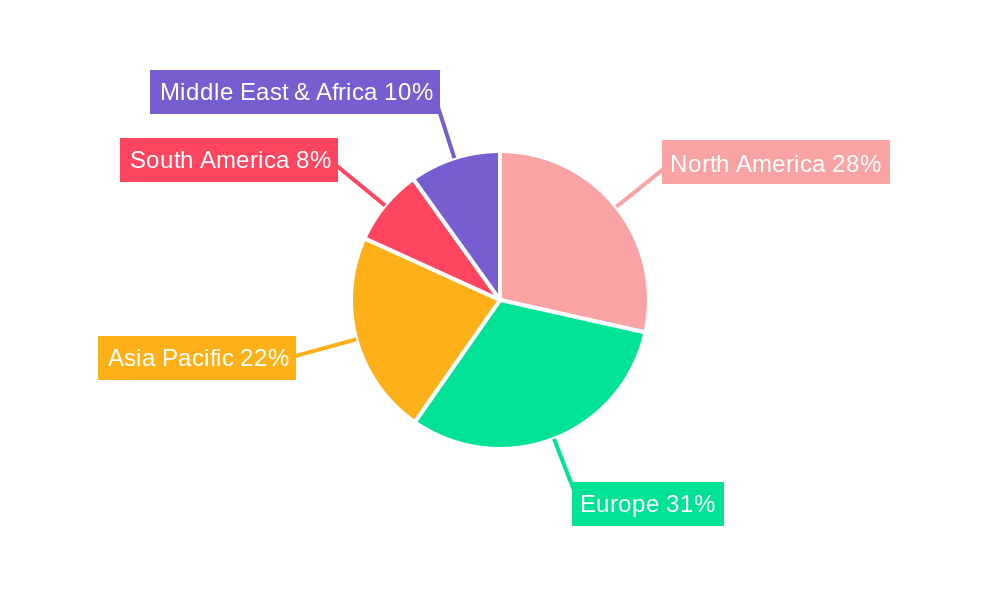
Several key trends are shaping the eco-friendly gloves market. The innovation in material science, leading to the development of advanced degradable and recyclable glove types, is a significant factor. Companies are investing heavily in research and development to offer gloves with comparable or superior performance to conventional options, while minimizing environmental impact. The increasing adoption of stringent government regulations and international standards promoting sustainable practices further incentivizes the use of eco-friendly gloves. However, certain restraints exist, including the initial higher cost of some eco-friendly materials compared to conventional plastics and the need for widespread consumer and industry education regarding proper disposal and recycling methods to maximize their environmental benefits. Despite these challenges, the overarching commitment to environmental stewardship and the continuous pursuit of sustainable solutions are expected to propel the market forward, with North America and Europe currently leading in adoption due to well-established environmental policies and consumer awareness.
Comprehensive Report: Eco-friendly Gloves Market Analysis & Forecast 2019-2033
This in-depth report provides a critical analysis of the global eco-friendly gloves market, offering strategic insights for industry professionals and stakeholders. Spanning from 2019 to 2033, with a base year of 2025, this research leverages extensive data to forecast market evolution, identify growth drivers, and pinpoint emerging opportunities. We meticulously examine market dynamics, product innovations, regional dominance, and key competitive landscapes, equipping you with the knowledge to navigate this rapidly expanding sector. This report is designed for immediate use without modification, ensuring clarity and actionable intelligence.
Eco-friendly Gloves Market Dynamics & Structure
The global eco-friendly gloves market is characterized by a moderate to high concentration, with key players like Top Glove Corporation Bhd, Hartalega Holdings Berhad, and Ansell Healthcare holding significant market shares. Technological innovation is a primary driver, with advancements in biodegradable polymers and sustainable manufacturing processes continuously reshaping the product landscape. Regulatory frameworks, particularly concerning waste management and chemical safety in industries such as pharmaceuticals and chemical industries, are increasingly mandating the adoption of eco-friendly alternatives. Competitive product substitutes are evolving, with traditional non-eco-friendly gloves facing growing pressure from consumers and businesses seeking sustainable options. End-user demographics are shifting towards environmentally conscious consumers and corporations, driving demand across various applications, including food and beverage, automobile, and medical care. Mergers and acquisitions (M&A) trends are also evident as larger companies seek to consolidate their positions and expand their sustainable product portfolios. For instance, recent M&A activities in the past three years indicate a growing trend of integration, with an estimated volume of 5-7 significant deals focused on acquiring specialized eco-friendly glove manufacturers. Innovation barriers include the higher upfront costs of sustainable materials and the need for scalability in production to meet global demand.
- Market Concentration: Moderate to High, driven by major players and increasing consolidation.
- Technological Drivers: Innovations in biodegradable and recyclable materials, enhanced durability, and improved barrier properties.
- Regulatory Frameworks: Stringent environmental regulations, waste reduction mandates, and worker safety standards.
- Competitive Substitutes: Increasing availability and performance of eco-friendly options challenging conventional gloves.
- End-User Demographics: Growing demand from environmentally conscious consumers, corporations with ESG commitments, and specialized industries.
- M&A Trends: Strategic acquisitions to enhance product offerings, expand market reach, and gain technological expertise.
- Innovation Barriers: Material costs, production scalability, and achieving performance parity with conventional materials.
Eco-friendly Gloves Growth Trends & Insights
The global eco-friendly gloves market is poised for substantial expansion, driven by a confluence of environmental consciousness, stringent regulations, and technological advancements. Market size is projected to grow significantly, with an estimated CAGR of approximately 9.5% during the forecast period of 2025–2033. This growth trajectory is supported by increasing adoption rates of sustainable alternatives across diverse industries. The base year of 2025 is expected to see a market valuation of US $10.5 billion, with a projected reach of US $22.8 billion by 2033. Technological disruptions are playing a pivotal role, with the development of novel biodegradable polymers derived from renewable resources and advanced recycling techniques for glove materials. Consumer behavior shifts are accelerating this trend, as individuals and businesses prioritize products with a lower environmental impact. This is evident in the rising demand for degradable eco-friendly gloves, which are increasingly preferred for single-use applications in sectors like food and beverage and healthcare. Market penetration is steadily increasing, moving beyond niche applications to become mainstream across various industrial and consumer segments. The historical period from 2019–2024 witnessed an initial surge in awareness and early adoption, laying the groundwork for the robust growth anticipated in the coming years. This period saw the market size grow from an estimated US $7.2 billion in 2019 to US $9.8 billion in 2024, indicating a strong foundational growth before the intensified forecast period. The growing emphasis on circular economy principles and corporate social responsibility (CSR) initiatives further bolsters the adoption of eco-friendly gloves, as companies aim to reduce their environmental footprint and enhance their brand image. The evolving landscape of personal protective equipment (PPE) is also a significant factor, with a growing demand for gloves that offer comparable or superior protection without compromising on environmental sustainability. This push for dual benefits is a key driver of innovation and market expansion.
Dominant Regions, Countries, or Segments in Eco-friendly Gloves
The Food and Beverage segment is emerging as a dominant force in the global eco-friendly gloves market, showcasing significant market share and robust growth potential. This dominance is driven by stringent food safety regulations, increasing consumer demand for sustainably sourced and packaged food, and the widespread use of disposable gloves in handling and preparation processes. The base year of 2025 is estimated to see the Food and Beverage application accounting for approximately 30% of the total market value. The Asia Pacific region, particularly countries like China, India, and Southeast Asian nations, is also a key driver of this growth, owing to its large population, burgeoning food processing industry, and increasing adoption of environmental best practices. Within the Types of eco-friendly gloves, Degradable Eco-friendly Gloves are currently leading the market due to their widespread application in single-use scenarios where disposal is a primary concern. The pharmaceutical industry's demand for sterile and disposable gloves also contributes significantly to this segment. However, Recyclable Eco-friendly Gloves are gaining traction, especially in industrial settings with established recycling infrastructure, presenting a strong growth opportunity for the future.
- Dominant Application Segment: Food and Beverage (estimated 30% market share in 2025).
- Key Drivers: Stringent food safety standards, consumer preference for sustainable products, high consumption of disposable gloves.
- Market Share & Growth Potential: Significant existing market share with substantial room for expansion due to increasing disposable income and urbanization.
- Dominant Region: Asia Pacific.
- Key Drivers: Large consumer base, expanding food and beverage industry, government initiatives promoting sustainability, growing awareness of environmental issues.
- Market Share & Growth Potential: Expected to contribute over 35% to the global market by 2033, driven by both domestic consumption and export potential.
- Leading Glove Type: Degradable Eco-friendly Gloves.
- Key Drivers: Suitability for single-use applications, increasing awareness of plastic waste, and availability of compostable alternatives.
- Market Share & Growth Potential: Dominates current market share but faces increasing competition from advanced recyclable options.
- Emerging Segment: Pharmaceutical applications are witnessing a steady rise in demand for advanced biodegradable and sterile eco-friendly gloves.
- Other Significant Segments: Chemical Industry and Automobile sectors are also contributing to market growth, driven by regulatory compliance and corporate sustainability goals.
Eco-friendly Gloves Product Landscape
The eco-friendly gloves market is characterized by a dynamic product landscape focused on innovation and sustainability. Key product developments revolve around advanced material science, leading to the creation of biodegradable gloves made from plant-based starches, corn, and other renewable resources, as well as recyclable gloves engineered for multiple use cycles. Performance metrics are being consistently enhanced, with a focus on achieving comparable or superior dexterity, tactile sensitivity, chemical resistance, and puncture resistance compared to traditional nitrile or latex gloves. Companies like Vegware are pioneering compostable solutions for the food service industry, while Showa and Shield Scientific B.V. are developing advanced biodegradable materials for industrial applications. The unique selling propositions often lie in the combination of environmental benefits with high-performance safety features. For instance, certain degradable gloves offer full compostability within a specified timeframe, while recyclable options are designed to withstand rigorous cleaning and sterilization processes, reducing overall waste and cost.
Key Drivers, Barriers & Challenges in Eco-friendly Gloves
Key Drivers: The surge in environmental consciousness among consumers and corporations is a primary catalyst for the eco-friendly gloves market. Increasingly stringent government regulations worldwide, particularly concerning plastic waste and chemical safety in industries like pharmaceuticals and chemical industry, are also propelling demand. Technological advancements in biodegradable and recyclable materials are making these alternatives more viable and cost-effective. Furthermore, corporate sustainability initiatives and the growing trend of ethical consumerism are encouraging businesses to adopt greener products. The Food and Beverage sector, in particular, is a significant driver due to its high volume of disposable glove usage and its commitment to reducing its environmental footprint.
Barriers & Challenges: One of the foremost challenges is the higher initial production cost of eco-friendly materials compared to conventional plastics. Achieving scalability in manufacturing to meet global demand while maintaining cost-effectiveness remains a hurdle. Supply chain complexities for sourcing sustainable raw materials can also pose issues. Regulatory hurdles, while driving adoption, can also create complexity in certification and compliance for different regions and applications. Competitive pressures from established, lower-cost traditional glove manufacturers persist. Moreover, ensuring comparable performance metrics such as durability and chemical resistance can be challenging for certain eco-friendly materials, requiring continuous innovation. The market is also susceptible to fluctuations in the availability and cost of raw materials, impacting overall pricing.
Emerging Opportunities in Eco-friendly Gloves
Emerging opportunities in the eco-friendly gloves sector lie in the development of advanced biodegradable and compostable materials that offer enhanced barrier protection and durability, catering to sectors with stringent safety requirements like healthcare and specialized chemical handling. The untapped potential in automotive manufacturing for sustainable assembly line gloves presents a significant growth avenue. Furthermore, the development of innovative recycling technologies and closed-loop systems for glove end-of-life management can unlock new market segments and business models. Evolving consumer preferences for personalized and sustainably sourced products also create opportunities for niche brands and customized solutions. The growing focus on the circular economy is driving demand for gloves that are not only biodegradable but also contribute to nutrient cycling in industrial composting facilities.
Growth Accelerators in the Eco-friendly Gloves Industry
Technological breakthroughs in biopolymer research and development are continuously enhancing the performance and cost-effectiveness of eco-friendly glove materials, acting as a major growth accelerator. Strategic partnerships between material suppliers, glove manufacturers like Kimberly Clark and Medline Industries, and end-user industries are crucial for co-developing tailored solutions and accelerating market adoption. Expansion into emerging economies with growing environmental awareness and increasing industrialization presents a substantial opportunity for market penetration. The development of robust recycling infrastructure and incentive programs for adopting sustainable PPE will further catalyze long-term growth. Initiatives by organizations and governments promoting sustainable procurement practices also play a significant role in driving the widespread adoption of eco-friendly gloves.
Key Players Shaping the Eco-friendly Gloves Market
- MCR Safety
- Showa
- Atrium Medical Care
- Shield Scientific B.V.
- Kimberly Clark
- Hartalega Holdings Berhad
- Top Glove Corporation Bhd
- SHIELD Scientific
- Ansell Healthcare
- Medline Industries
- 3M
- Supermax Healthcare Limited
- Vegware
Notable Milestones in Eco-friendly Gloves Sector
- 2019: Increased regulatory focus on single-use plastic reduction globally, spurring investment in biodegradable materials.
- 2020: Heightened demand for disposable gloves due to the global pandemic, leading to a surge in production and a renewed focus on sustainable sourcing.
- 2021: Launch of innovative plant-based biodegradable glove formulations by several key players, improving compostability.
- 2022: Significant R&D investment in advanced recycling technologies for contaminated PPE, including gloves.
- 2023: Expansion of partnerships between eco-friendly glove manufacturers and major food & beverage companies to meet sustainability goals.
- 2024: Introduction of certified compostable gloves meeting industrial composting standards in multiple key markets.
In-Depth Eco-friendly Gloves Market Outlook
The future of the eco-friendly gloves market appears exceptionally promising, driven by a sustained global push towards environmental responsibility. Growth accelerators, including advanced material science and collaborative industry efforts, are poised to significantly expand market reach and application diversity. Strategic opportunities lie in leveraging untapped markets in developing nations and innovating for specialized industrial needs, particularly within the chemical and pharmaceutical sectors, where stringent safety and sustainability requirements align perfectly with advanced eco-friendly solutions. The continued evolution of biodegradable and recyclable technologies, coupled with supportive regulatory landscapes, will ensure that eco-friendly gloves transition from a niche product to a mainstream necessity, driving substantial long-term market potential and creating a more sustainable future for personal protective equipment.
Eco-friendly Gloves Segmentation
-
1. Application
- 1.1. Food and Beverage
- 1.2. Chemical Industry
- 1.3. Pharmaceutical
- 1.4. Automobile
- 1.5. Others
-
2. Types
- 2.1. Degradable Eco-friendly Gloves
- 2.2. Recyclable Eco-friendly Gloves
Eco-friendly Gloves Segmentation By Geography
-
1. North America
- 1.1. United States
- 1.2. Canada
- 1.3. Mexico
-
2. South America
- 2.1. Brazil
- 2.2. Argentina
- 2.3. Rest of South America
-
3. Europe
- 3.1. United Kingdom
- 3.2. Germany
- 3.3. France
- 3.4. Italy
- 3.5. Spain
- 3.6. Russia
- 3.7. Benelux
- 3.8. Nordics
- 3.9. Rest of Europe
-
4. Middle East & Africa
- 4.1. Turkey
- 4.2. Israel
- 4.3. GCC
- 4.4. North Africa
- 4.5. South Africa
- 4.6. Rest of Middle East & Africa
-
5. Asia Pacific
- 5.1. China
- 5.2. India
- 5.3. Japan
- 5.4. South Korea
- 5.5. ASEAN
- 5.6. Oceania
- 5.7. Rest of Asia Pacific
Eco-friendly Gloves REPORT HIGHLIGHTS
| Aspects | Details |
|---|---|
| Study Period | 2019-2033 |
| Base Year | 2024 |
| Estimated Year | 2025 |
| Forecast Period | 2025-2033 |
| Historical Period | 2019-2024 |
| Growth Rate | CAGR of XX% from 2019-2033 |
| Segmentation |
|
Table of Contents
- 1. Introduction
- 1.1. Research Scope
- 1.2. Market Segmentation
- 1.3. Research Methodology
- 1.4. Definitions and Assumptions
- 2. Executive Summary
- 2.1. Introduction
- 3. Market Dynamics
- 3.1. Introduction
- 3.2. Market Drivers
- 3.3. Market Restrains
- 3.4. Market Trends
- 4. Market Factor Analysis
- 4.1. Porters Five Forces
- 4.2. Supply/Value Chain
- 4.3. PESTEL analysis
- 4.4. Market Entropy
- 4.5. Patent/Trademark Analysis
- 5. Global Eco-friendly Gloves Analysis, Insights and Forecast, 2019-2031
- 5.1. Market Analysis, Insights and Forecast - by Application
- 5.1.1. Food and Beverage
- 5.1.2. Chemical Industry
- 5.1.3. Pharmaceutical
- 5.1.4. Automobile
- 5.1.5. Others
- 5.2. Market Analysis, Insights and Forecast - by Types
- 5.2.1. Degradable Eco-friendly Gloves
- 5.2.2. Recyclable Eco-friendly Gloves
- 5.3. Market Analysis, Insights and Forecast - by Region
- 5.3.1. North America
- 5.3.2. South America
- 5.3.3. Europe
- 5.3.4. Middle East & Africa
- 5.3.5. Asia Pacific
- 5.1. Market Analysis, Insights and Forecast - by Application
- 6. North America Eco-friendly Gloves Analysis, Insights and Forecast, 2019-2031
- 6.1. Market Analysis, Insights and Forecast - by Application
- 6.1.1. Food and Beverage
- 6.1.2. Chemical Industry
- 6.1.3. Pharmaceutical
- 6.1.4. Automobile
- 6.1.5. Others
- 6.2. Market Analysis, Insights and Forecast - by Types
- 6.2.1. Degradable Eco-friendly Gloves
- 6.2.2. Recyclable Eco-friendly Gloves
- 6.1. Market Analysis, Insights and Forecast - by Application
- 7. South America Eco-friendly Gloves Analysis, Insights and Forecast, 2019-2031
- 7.1. Market Analysis, Insights and Forecast - by Application
- 7.1.1. Food and Beverage
- 7.1.2. Chemical Industry
- 7.1.3. Pharmaceutical
- 7.1.4. Automobile
- 7.1.5. Others
- 7.2. Market Analysis, Insights and Forecast - by Types
- 7.2.1. Degradable Eco-friendly Gloves
- 7.2.2. Recyclable Eco-friendly Gloves
- 7.1. Market Analysis, Insights and Forecast - by Application
- 8. Europe Eco-friendly Gloves Analysis, Insights and Forecast, 2019-2031
- 8.1. Market Analysis, Insights and Forecast - by Application
- 8.1.1. Food and Beverage
- 8.1.2. Chemical Industry
- 8.1.3. Pharmaceutical
- 8.1.4. Automobile
- 8.1.5. Others
- 8.2. Market Analysis, Insights and Forecast - by Types
- 8.2.1. Degradable Eco-friendly Gloves
- 8.2.2. Recyclable Eco-friendly Gloves
- 8.1. Market Analysis, Insights and Forecast - by Application
- 9. Middle East & Africa Eco-friendly Gloves Analysis, Insights and Forecast, 2019-2031
- 9.1. Market Analysis, Insights and Forecast - by Application
- 9.1.1. Food and Beverage
- 9.1.2. Chemical Industry
- 9.1.3. Pharmaceutical
- 9.1.4. Automobile
- 9.1.5. Others
- 9.2. Market Analysis, Insights and Forecast - by Types
- 9.2.1. Degradable Eco-friendly Gloves
- 9.2.2. Recyclable Eco-friendly Gloves
- 9.1. Market Analysis, Insights and Forecast - by Application
- 10. Asia Pacific Eco-friendly Gloves Analysis, Insights and Forecast, 2019-2031
- 10.1. Market Analysis, Insights and Forecast - by Application
- 10.1.1. Food and Beverage
- 10.1.2. Chemical Industry
- 10.1.3. Pharmaceutical
- 10.1.4. Automobile
- 10.1.5. Others
- 10.2. Market Analysis, Insights and Forecast - by Types
- 10.2.1. Degradable Eco-friendly Gloves
- 10.2.2. Recyclable Eco-friendly Gloves
- 10.1. Market Analysis, Insights and Forecast - by Application
- 11. Competitive Analysis
- 11.1. Global Market Share Analysis 2024
- 11.2. Company Profiles
- 11.2.1 MCR Safety
- 11.2.1.1. Overview
- 11.2.1.2. Products
- 11.2.1.3. SWOT Analysis
- 11.2.1.4. Recent Developments
- 11.2.1.5. Financials (Based on Availability)
- 11.2.2 Showa
- 11.2.2.1. Overview
- 11.2.2.2. Products
- 11.2.2.3. SWOT Analysis
- 11.2.2.4. Recent Developments
- 11.2.2.5. Financials (Based on Availability)
- 11.2.3 Atrium Medical Care
- 11.2.3.1. Overview
- 11.2.3.2. Products
- 11.2.3.3. SWOT Analysis
- 11.2.3.4. Recent Developments
- 11.2.3.5. Financials (Based on Availability)
- 11.2.4 Shield Scientific B.V.
- 11.2.4.1. Overview
- 11.2.4.2. Products
- 11.2.4.3. SWOT Analysis
- 11.2.4.4. Recent Developments
- 11.2.4.5. Financials (Based on Availability)
- 11.2.5 Kimberly Clark
- 11.2.5.1. Overview
- 11.2.5.2. Products
- 11.2.5.3. SWOT Analysis
- 11.2.5.4. Recent Developments
- 11.2.5.5. Financials (Based on Availability)
- 11.2.6 Hartalega Holdings Berhad
- 11.2.6.1. Overview
- 11.2.6.2. Products
- 11.2.6.3. SWOT Analysis
- 11.2.6.4. Recent Developments
- 11.2.6.5. Financials (Based on Availability)
- 11.2.7 Top Glove Corporation Bhd
- 11.2.7.1. Overview
- 11.2.7.2. Products
- 11.2.7.3. SWOT Analysis
- 11.2.7.4. Recent Developments
- 11.2.7.5. Financials (Based on Availability)
- 11.2.8 SHIELD Scientific
- 11.2.8.1. Overview
- 11.2.8.2. Products
- 11.2.8.3. SWOT Analysis
- 11.2.8.4. Recent Developments
- 11.2.8.5. Financials (Based on Availability)
- 11.2.9 Ansell Healthcare
- 11.2.9.1. Overview
- 11.2.9.2. Products
- 11.2.9.3. SWOT Analysis
- 11.2.9.4. Recent Developments
- 11.2.9.5. Financials (Based on Availability)
- 11.2.10 Medline Industries
- 11.2.10.1. Overview
- 11.2.10.2. Products
- 11.2.10.3. SWOT Analysis
- 11.2.10.4. Recent Developments
- 11.2.10.5. Financials (Based on Availability)
- 11.2.11 3M
- 11.2.11.1. Overview
- 11.2.11.2. Products
- 11.2.11.3. SWOT Analysis
- 11.2.11.4. Recent Developments
- 11.2.11.5. Financials (Based on Availability)
- 11.2.12 Supermax Healthcare Limited
- 11.2.12.1. Overview
- 11.2.12.2. Products
- 11.2.12.3. SWOT Analysis
- 11.2.12.4. Recent Developments
- 11.2.12.5. Financials (Based on Availability)
- 11.2.13 Vegware
- 11.2.13.1. Overview
- 11.2.13.2. Products
- 11.2.13.3. SWOT Analysis
- 11.2.13.4. Recent Developments
- 11.2.13.5. Financials (Based on Availability)
- 11.2.1 MCR Safety
List of Figures
- Figure 1: Global Eco-friendly Gloves Revenue Breakdown (million, %) by Region 2024 & 2032
- Figure 2: Global Eco-friendly Gloves Volume Breakdown (K, %) by Region 2024 & 2032
- Figure 3: North America Eco-friendly Gloves Revenue (million), by Application 2024 & 2032
- Figure 4: North America Eco-friendly Gloves Volume (K), by Application 2024 & 2032
- Figure 5: North America Eco-friendly Gloves Revenue Share (%), by Application 2024 & 2032
- Figure 6: North America Eco-friendly Gloves Volume Share (%), by Application 2024 & 2032
- Figure 7: North America Eco-friendly Gloves Revenue (million), by Types 2024 & 2032
- Figure 8: North America Eco-friendly Gloves Volume (K), by Types 2024 & 2032
- Figure 9: North America Eco-friendly Gloves Revenue Share (%), by Types 2024 & 2032
- Figure 10: North America Eco-friendly Gloves Volume Share (%), by Types 2024 & 2032
- Figure 11: North America Eco-friendly Gloves Revenue (million), by Country 2024 & 2032
- Figure 12: North America Eco-friendly Gloves Volume (K), by Country 2024 & 2032
- Figure 13: North America Eco-friendly Gloves Revenue Share (%), by Country 2024 & 2032
- Figure 14: North America Eco-friendly Gloves Volume Share (%), by Country 2024 & 2032
- Figure 15: South America Eco-friendly Gloves Revenue (million), by Application 2024 & 2032
- Figure 16: South America Eco-friendly Gloves Volume (K), by Application 2024 & 2032
- Figure 17: South America Eco-friendly Gloves Revenue Share (%), by Application 2024 & 2032
- Figure 18: South America Eco-friendly Gloves Volume Share (%), by Application 2024 & 2032
- Figure 19: South America Eco-friendly Gloves Revenue (million), by Types 2024 & 2032
- Figure 20: South America Eco-friendly Gloves Volume (K), by Types 2024 & 2032
- Figure 21: South America Eco-friendly Gloves Revenue Share (%), by Types 2024 & 2032
- Figure 22: South America Eco-friendly Gloves Volume Share (%), by Types 2024 & 2032
- Figure 23: South America Eco-friendly Gloves Revenue (million), by Country 2024 & 2032
- Figure 24: South America Eco-friendly Gloves Volume (K), by Country 2024 & 2032
- Figure 25: South America Eco-friendly Gloves Revenue Share (%), by Country 2024 & 2032
- Figure 26: South America Eco-friendly Gloves Volume Share (%), by Country 2024 & 2032
- Figure 27: Europe Eco-friendly Gloves Revenue (million), by Application 2024 & 2032
- Figure 28: Europe Eco-friendly Gloves Volume (K), by Application 2024 & 2032
- Figure 29: Europe Eco-friendly Gloves Revenue Share (%), by Application 2024 & 2032
- Figure 30: Europe Eco-friendly Gloves Volume Share (%), by Application 2024 & 2032
- Figure 31: Europe Eco-friendly Gloves Revenue (million), by Types 2024 & 2032
- Figure 32: Europe Eco-friendly Gloves Volume (K), by Types 2024 & 2032
- Figure 33: Europe Eco-friendly Gloves Revenue Share (%), by Types 2024 & 2032
- Figure 34: Europe Eco-friendly Gloves Volume Share (%), by Types 2024 & 2032
- Figure 35: Europe Eco-friendly Gloves Revenue (million), by Country 2024 & 2032
- Figure 36: Europe Eco-friendly Gloves Volume (K), by Country 2024 & 2032
- Figure 37: Europe Eco-friendly Gloves Revenue Share (%), by Country 2024 & 2032
- Figure 38: Europe Eco-friendly Gloves Volume Share (%), by Country 2024 & 2032
- Figure 39: Middle East & Africa Eco-friendly Gloves Revenue (million), by Application 2024 & 2032
- Figure 40: Middle East & Africa Eco-friendly Gloves Volume (K), by Application 2024 & 2032
- Figure 41: Middle East & Africa Eco-friendly Gloves Revenue Share (%), by Application 2024 & 2032
- Figure 42: Middle East & Africa Eco-friendly Gloves Volume Share (%), by Application 2024 & 2032
- Figure 43: Middle East & Africa Eco-friendly Gloves Revenue (million), by Types 2024 & 2032
- Figure 44: Middle East & Africa Eco-friendly Gloves Volume (K), by Types 2024 & 2032
- Figure 45: Middle East & Africa Eco-friendly Gloves Revenue Share (%), by Types 2024 & 2032
- Figure 46: Middle East & Africa Eco-friendly Gloves Volume Share (%), by Types 2024 & 2032
- Figure 47: Middle East & Africa Eco-friendly Gloves Revenue (million), by Country 2024 & 2032
- Figure 48: Middle East & Africa Eco-friendly Gloves Volume (K), by Country 2024 & 2032
- Figure 49: Middle East & Africa Eco-friendly Gloves Revenue Share (%), by Country 2024 & 2032
- Figure 50: Middle East & Africa Eco-friendly Gloves Volume Share (%), by Country 2024 & 2032
- Figure 51: Asia Pacific Eco-friendly Gloves Revenue (million), by Application 2024 & 2032
- Figure 52: Asia Pacific Eco-friendly Gloves Volume (K), by Application 2024 & 2032
- Figure 53: Asia Pacific Eco-friendly Gloves Revenue Share (%), by Application 2024 & 2032
- Figure 54: Asia Pacific Eco-friendly Gloves Volume Share (%), by Application 2024 & 2032
- Figure 55: Asia Pacific Eco-friendly Gloves Revenue (million), by Types 2024 & 2032
- Figure 56: Asia Pacific Eco-friendly Gloves Volume (K), by Types 2024 & 2032
- Figure 57: Asia Pacific Eco-friendly Gloves Revenue Share (%), by Types 2024 & 2032
- Figure 58: Asia Pacific Eco-friendly Gloves Volume Share (%), by Types 2024 & 2032
- Figure 59: Asia Pacific Eco-friendly Gloves Revenue (million), by Country 2024 & 2032
- Figure 60: Asia Pacific Eco-friendly Gloves Volume (K), by Country 2024 & 2032
- Figure 61: Asia Pacific Eco-friendly Gloves Revenue Share (%), by Country 2024 & 2032
- Figure 62: Asia Pacific Eco-friendly Gloves Volume Share (%), by Country 2024 & 2032
List of Tables
- Table 1: Global Eco-friendly Gloves Revenue million Forecast, by Region 2019 & 2032
- Table 2: Global Eco-friendly Gloves Volume K Forecast, by Region 2019 & 2032
- Table 3: Global Eco-friendly Gloves Revenue million Forecast, by Application 2019 & 2032
- Table 4: Global Eco-friendly Gloves Volume K Forecast, by Application 2019 & 2032
- Table 5: Global Eco-friendly Gloves Revenue million Forecast, by Types 2019 & 2032
- Table 6: Global Eco-friendly Gloves Volume K Forecast, by Types 2019 & 2032
- Table 7: Global Eco-friendly Gloves Revenue million Forecast, by Region 2019 & 2032
- Table 8: Global Eco-friendly Gloves Volume K Forecast, by Region 2019 & 2032
- Table 9: Global Eco-friendly Gloves Revenue million Forecast, by Application 2019 & 2032
- Table 10: Global Eco-friendly Gloves Volume K Forecast, by Application 2019 & 2032
- Table 11: Global Eco-friendly Gloves Revenue million Forecast, by Types 2019 & 2032
- Table 12: Global Eco-friendly Gloves Volume K Forecast, by Types 2019 & 2032
- Table 13: Global Eco-friendly Gloves Revenue million Forecast, by Country 2019 & 2032
- Table 14: Global Eco-friendly Gloves Volume K Forecast, by Country 2019 & 2032
- Table 15: United States Eco-friendly Gloves Revenue (million) Forecast, by Application 2019 & 2032
- Table 16: United States Eco-friendly Gloves Volume (K) Forecast, by Application 2019 & 2032
- Table 17: Canada Eco-friendly Gloves Revenue (million) Forecast, by Application 2019 & 2032
- Table 18: Canada Eco-friendly Gloves Volume (K) Forecast, by Application 2019 & 2032
- Table 19: Mexico Eco-friendly Gloves Revenue (million) Forecast, by Application 2019 & 2032
- Table 20: Mexico Eco-friendly Gloves Volume (K) Forecast, by Application 2019 & 2032
- Table 21: Global Eco-friendly Gloves Revenue million Forecast, by Application 2019 & 2032
- Table 22: Global Eco-friendly Gloves Volume K Forecast, by Application 2019 & 2032
- Table 23: Global Eco-friendly Gloves Revenue million Forecast, by Types 2019 & 2032
- Table 24: Global Eco-friendly Gloves Volume K Forecast, by Types 2019 & 2032
- Table 25: Global Eco-friendly Gloves Revenue million Forecast, by Country 2019 & 2032
- Table 26: Global Eco-friendly Gloves Volume K Forecast, by Country 2019 & 2032
- Table 27: Brazil Eco-friendly Gloves Revenue (million) Forecast, by Application 2019 & 2032
- Table 28: Brazil Eco-friendly Gloves Volume (K) Forecast, by Application 2019 & 2032
- Table 29: Argentina Eco-friendly Gloves Revenue (million) Forecast, by Application 2019 & 2032
- Table 30: Argentina Eco-friendly Gloves Volume (K) Forecast, by Application 2019 & 2032
- Table 31: Rest of South America Eco-friendly Gloves Revenue (million) Forecast, by Application 2019 & 2032
- Table 32: Rest of South America Eco-friendly Gloves Volume (K) Forecast, by Application 2019 & 2032
- Table 33: Global Eco-friendly Gloves Revenue million Forecast, by Application 2019 & 2032
- Table 34: Global Eco-friendly Gloves Volume K Forecast, by Application 2019 & 2032
- Table 35: Global Eco-friendly Gloves Revenue million Forecast, by Types 2019 & 2032
- Table 36: Global Eco-friendly Gloves Volume K Forecast, by Types 2019 & 2032
- Table 37: Global Eco-friendly Gloves Revenue million Forecast, by Country 2019 & 2032
- Table 38: Global Eco-friendly Gloves Volume K Forecast, by Country 2019 & 2032
- Table 39: United Kingdom Eco-friendly Gloves Revenue (million) Forecast, by Application 2019 & 2032
- Table 40: United Kingdom Eco-friendly Gloves Volume (K) Forecast, by Application 2019 & 2032
- Table 41: Germany Eco-friendly Gloves Revenue (million) Forecast, by Application 2019 & 2032
- Table 42: Germany Eco-friendly Gloves Volume (K) Forecast, by Application 2019 & 2032
- Table 43: France Eco-friendly Gloves Revenue (million) Forecast, by Application 2019 & 2032
- Table 44: France Eco-friendly Gloves Volume (K) Forecast, by Application 2019 & 2032
- Table 45: Italy Eco-friendly Gloves Revenue (million) Forecast, by Application 2019 & 2032
- Table 46: Italy Eco-friendly Gloves Volume (K) Forecast, by Application 2019 & 2032
- Table 47: Spain Eco-friendly Gloves Revenue (million) Forecast, by Application 2019 & 2032
- Table 48: Spain Eco-friendly Gloves Volume (K) Forecast, by Application 2019 & 2032
- Table 49: Russia Eco-friendly Gloves Revenue (million) Forecast, by Application 2019 & 2032
- Table 50: Russia Eco-friendly Gloves Volume (K) Forecast, by Application 2019 & 2032
- Table 51: Benelux Eco-friendly Gloves Revenue (million) Forecast, by Application 2019 & 2032
- Table 52: Benelux Eco-friendly Gloves Volume (K) Forecast, by Application 2019 & 2032
- Table 53: Nordics Eco-friendly Gloves Revenue (million) Forecast, by Application 2019 & 2032
- Table 54: Nordics Eco-friendly Gloves Volume (K) Forecast, by Application 2019 & 2032
- Table 55: Rest of Europe Eco-friendly Gloves Revenue (million) Forecast, by Application 2019 & 2032
- Table 56: Rest of Europe Eco-friendly Gloves Volume (K) Forecast, by Application 2019 & 2032
- Table 57: Global Eco-friendly Gloves Revenue million Forecast, by Application 2019 & 2032
- Table 58: Global Eco-friendly Gloves Volume K Forecast, by Application 2019 & 2032
- Table 59: Global Eco-friendly Gloves Revenue million Forecast, by Types 2019 & 2032
- Table 60: Global Eco-friendly Gloves Volume K Forecast, by Types 2019 & 2032
- Table 61: Global Eco-friendly Gloves Revenue million Forecast, by Country 2019 & 2032
- Table 62: Global Eco-friendly Gloves Volume K Forecast, by Country 2019 & 2032
- Table 63: Turkey Eco-friendly Gloves Revenue (million) Forecast, by Application 2019 & 2032
- Table 64: Turkey Eco-friendly Gloves Volume (K) Forecast, by Application 2019 & 2032
- Table 65: Israel Eco-friendly Gloves Revenue (million) Forecast, by Application 2019 & 2032
- Table 66: Israel Eco-friendly Gloves Volume (K) Forecast, by Application 2019 & 2032
- Table 67: GCC Eco-friendly Gloves Revenue (million) Forecast, by Application 2019 & 2032
- Table 68: GCC Eco-friendly Gloves Volume (K) Forecast, by Application 2019 & 2032
- Table 69: North Africa Eco-friendly Gloves Revenue (million) Forecast, by Application 2019 & 2032
- Table 70: North Africa Eco-friendly Gloves Volume (K) Forecast, by Application 2019 & 2032
- Table 71: South Africa Eco-friendly Gloves Revenue (million) Forecast, by Application 2019 & 2032
- Table 72: South Africa Eco-friendly Gloves Volume (K) Forecast, by Application 2019 & 2032
- Table 73: Rest of Middle East & Africa Eco-friendly Gloves Revenue (million) Forecast, by Application 2019 & 2032
- Table 74: Rest of Middle East & Africa Eco-friendly Gloves Volume (K) Forecast, by Application 2019 & 2032
- Table 75: Global Eco-friendly Gloves Revenue million Forecast, by Application 2019 & 2032
- Table 76: Global Eco-friendly Gloves Volume K Forecast, by Application 2019 & 2032
- Table 77: Global Eco-friendly Gloves Revenue million Forecast, by Types 2019 & 2032
- Table 78: Global Eco-friendly Gloves Volume K Forecast, by Types 2019 & 2032
- Table 79: Global Eco-friendly Gloves Revenue million Forecast, by Country 2019 & 2032
- Table 80: Global Eco-friendly Gloves Volume K Forecast, by Country 2019 & 2032
- Table 81: China Eco-friendly Gloves Revenue (million) Forecast, by Application 2019 & 2032
- Table 82: China Eco-friendly Gloves Volume (K) Forecast, by Application 2019 & 2032
- Table 83: India Eco-friendly Gloves Revenue (million) Forecast, by Application 2019 & 2032
- Table 84: India Eco-friendly Gloves Volume (K) Forecast, by Application 2019 & 2032
- Table 85: Japan Eco-friendly Gloves Revenue (million) Forecast, by Application 2019 & 2032
- Table 86: Japan Eco-friendly Gloves Volume (K) Forecast, by Application 2019 & 2032
- Table 87: South Korea Eco-friendly Gloves Revenue (million) Forecast, by Application 2019 & 2032
- Table 88: South Korea Eco-friendly Gloves Volume (K) Forecast, by Application 2019 & 2032
- Table 89: ASEAN Eco-friendly Gloves Revenue (million) Forecast, by Application 2019 & 2032
- Table 90: ASEAN Eco-friendly Gloves Volume (K) Forecast, by Application 2019 & 2032
- Table 91: Oceania Eco-friendly Gloves Revenue (million) Forecast, by Application 2019 & 2032
- Table 92: Oceania Eco-friendly Gloves Volume (K) Forecast, by Application 2019 & 2032
- Table 93: Rest of Asia Pacific Eco-friendly Gloves Revenue (million) Forecast, by Application 2019 & 2032
- Table 94: Rest of Asia Pacific Eco-friendly Gloves Volume (K) Forecast, by Application 2019 & 2032
Frequently Asked Questions
1. What is the projected Compound Annual Growth Rate (CAGR) of the Eco-friendly Gloves?
The projected CAGR is approximately XX%.
2. Which companies are prominent players in the Eco-friendly Gloves?
Key companies in the market include MCR Safety, Showa, Atrium Medical Care, Shield Scientific B.V., Kimberly Clark, Hartalega Holdings Berhad, Top Glove Corporation Bhd, SHIELD Scientific, Ansell Healthcare, Medline Industries, 3M, Supermax Healthcare Limited, Vegware.
3. What are the main segments of the Eco-friendly Gloves?
The market segments include Application, Types.
4. Can you provide details about the market size?
The market size is estimated to be USD XXX million as of 2022.
5. What are some drivers contributing to market growth?
N/A
6. What are the notable trends driving market growth?
N/A
7. Are there any restraints impacting market growth?
N/A
8. Can you provide examples of recent developments in the market?
N/A
9. What pricing options are available for accessing the report?
Pricing options include single-user, multi-user, and enterprise licenses priced at USD 3350.00, USD 5025.00, and USD 6700.00 respectively.
10. Is the market size provided in terms of value or volume?
The market size is provided in terms of value, measured in million and volume, measured in K.
11. Are there any specific market keywords associated with the report?
Yes, the market keyword associated with the report is "Eco-friendly Gloves," which aids in identifying and referencing the specific market segment covered.
12. How do I determine which pricing option suits my needs best?
The pricing options vary based on user requirements and access needs. Individual users may opt for single-user licenses, while businesses requiring broader access may choose multi-user or enterprise licenses for cost-effective access to the report.
13. Are there any additional resources or data provided in the Eco-friendly Gloves report?
While the report offers comprehensive insights, it's advisable to review the specific contents or supplementary materials provided to ascertain if additional resources or data are available.
14. How can I stay updated on further developments or reports in the Eco-friendly Gloves?
To stay informed about further developments, trends, and reports in the Eco-friendly Gloves, consider subscribing to industry newsletters, following relevant companies and organizations, or regularly checking reputable industry news sources and publications.
Methodology
Step 1 - Identification of Relevant Samples Size from Population Database


Step 2 - Approaches for Defining Global Market Size (Value, Volume* & Price*)

Note*: In applicable scenarios
Step 3 - Data Sources
Primary Research
- Web Analytics
- Survey Reports
- Research Institute
- Latest Research Reports
- Opinion Leaders
Secondary Research
- Annual Reports
- White Paper
- Latest Press Release
- Industry Association
- Paid Database
- Investor Presentations

Step 4 - Data Triangulation
Involves using different sources of information in order to increase the validity of a study
These sources are likely to be stakeholders in a program - participants, other researchers, program staff, other community members, and so on.
Then we put all data in single framework & apply various statistical tools to find out the dynamic on the market.
During the analysis stage, feedback from the stakeholder groups would be compared to determine areas of agreement as well as areas of divergence


