
Key Insights
The Electronic Article Surveillance (EAS) anti-theft antenna market is experiencing robust growth, driven by the increasing adoption of loss prevention strategies across retail sectors globally. The rising incidence of shoplifting and the need to protect high-value merchandise are key factors fueling market expansion. Technological advancements, such as the integration of RFID and advanced sensor technologies within EAS antennas, are enhancing detection accuracy and efficiency, further stimulating market growth. The market is segmented by antenna type (acousto-magnetic, radio frequency), technology (RFID, AM), and application (retail, libraries, museums). While the retail sector dominates, expanding applications in other sectors present significant opportunities. Major players like Checkpoint Systems, Sensormatic, and Nedap are driving innovation and market consolidation through strategic partnerships and product diversification. The competitive landscape is characterized by both established players and emerging companies focusing on cost-effective solutions. The market's growth trajectory is expected to remain positive over the forecast period, albeit at a moderate CAGR, influenced by factors like economic fluctuations and evolving consumer behavior.
Geographic expansion, particularly in developing economies with a burgeoning retail sector, is anticipated to drive significant market growth. However, challenges remain, including the need for ongoing technological improvements to address sophisticated theft techniques and the increasing costs associated with implementing and maintaining EAS systems. Furthermore, the emergence of alternative loss prevention technologies, such as advanced video surveillance systems, presents a competitive challenge. Despite these restraints, the overall market outlook remains positive, driven by consistent demand for robust loss prevention measures in an environment where retail theft remains a significant concern. The ongoing focus on enhancing retail operational efficiency and reducing shrink will continue to support the growth of the EAS anti-theft antenna market.
EAS Anti-theft Antenna Market Report: 2019-2033
This comprehensive report provides an in-depth analysis of the global EAS Anti-theft Antenna market, covering the period from 2019 to 2033. It delves into market dynamics, growth trends, regional dominance, product landscapes, and key players, offering valuable insights for industry professionals, investors, and strategic decision-makers. The report utilizes data from the historical period (2019-2024), with the base year set at 2025 and a forecast period extending to 2033. The global market size is projected to reach xx million units by 2033.
EAS Anti-theft Antenna Market Dynamics & Structure
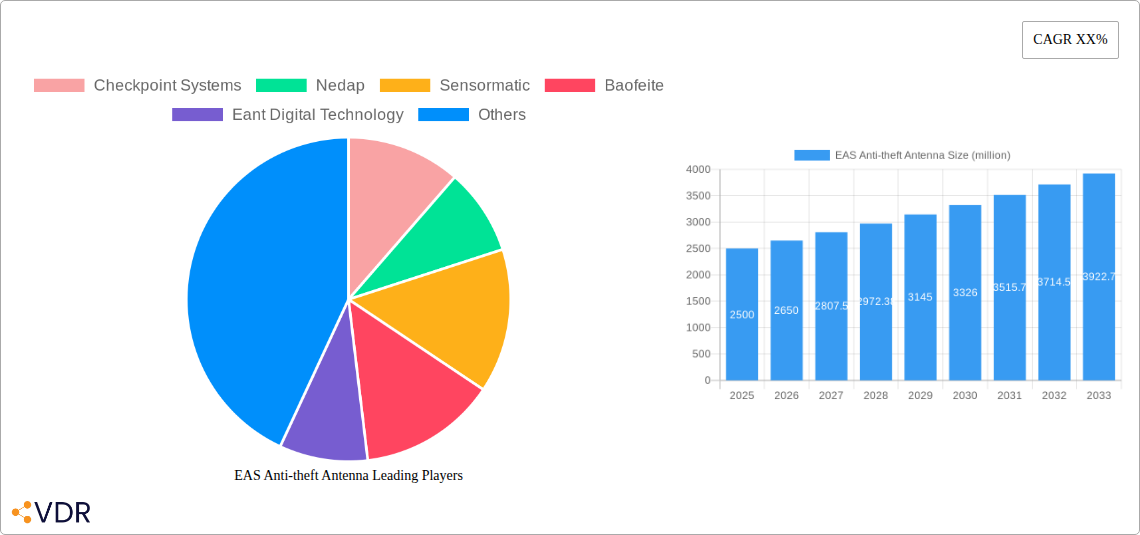
The EAS Anti-theft Antenna market is characterized by moderate concentration, with key players such as Checkpoint Systems, Nedap, and Sensormatic holding significant market share. The market is driven by technological innovation, particularly in RFID and AM/RF technologies, alongside increasing retail theft concerns. Regulatory frameworks impacting retail security also play a crucial role. Competition from alternative security solutions, such as CCTV and improved security personnel practices, presents a challenge. The market is segmented by technology (RFID, AM/RF, etc.), application (apparel retail, grocery, pharmacy, etc.), and geography.
- Market Concentration: Checkpoint Systems, Nedap, and Sensormatic collectively hold approximately xx% of the market share in 2025.
- Technological Innovation: The shift towards RFID technology is a key driver, offering improved accuracy and inventory management capabilities.
- Regulatory Landscape: Government regulations regarding retail theft and loss prevention influence the adoption of EAS systems.
- Competitive Substitutes: CCTV surveillance and improved loss prevention practices are key competitive substitutes.
- M&A Activity: The last 5 years have seen xx M&A deals in the EAS anti-theft antenna market, primarily focused on expanding product portfolios and geographic reach. This activity is expected to increase in the coming years due to ongoing consolidation in the sector.
- End-user Demographics: The primary end-users are retail businesses of all sizes, with larger retailers driving the majority of market demand.
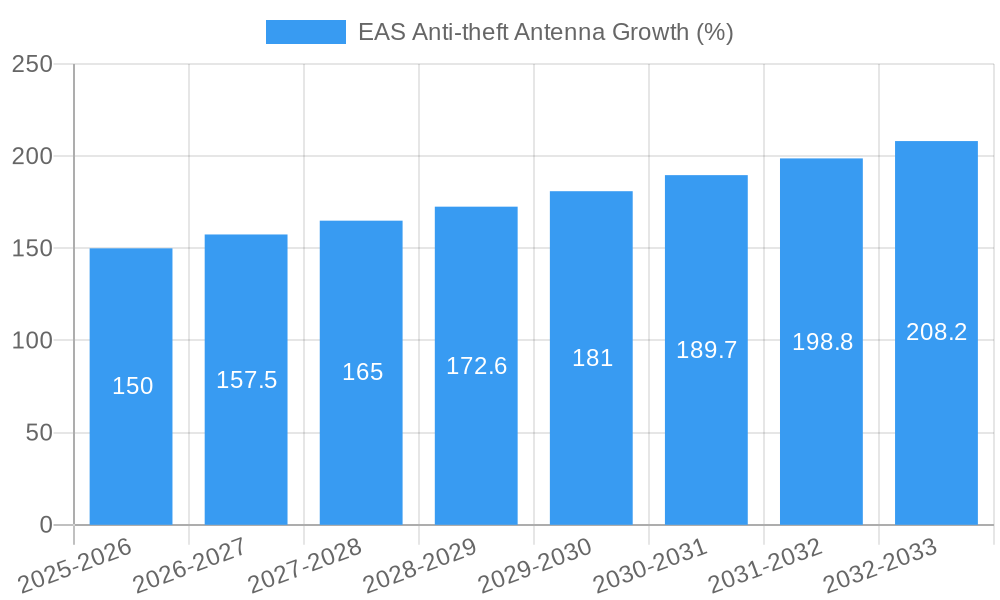
EAS Anti-theft Antenna Growth Trends & Insights
The global EAS Anti-theft Antenna market experienced steady growth during the historical period (2019-2024), with a CAGR of xx%. This growth is attributed to rising retail theft rates, increasing awareness of loss prevention strategies, and the adoption of advanced technologies. The market is expected to maintain a healthy growth trajectory during the forecast period (2025-2033), with a projected CAGR of xx%, driven by factors such as technological advancements (miniaturization, improved sensitivity), rising e-commerce activity (requiring enhanced supply chain security), and increasing adoption in emerging markets. Consumer behavior shifts towards self-checkout and omnichannel retail are also contributing to growth. Market penetration is expected to reach xx% by 2033.
Dominant Regions, Countries, or Segments in EAS Anti-theft Antenna
North America currently dominates the EAS Anti-theft Antenna market, followed by Europe and Asia-Pacific. This dominance is attributed to factors such as high retail density, advanced retail infrastructure, and early adoption of technologically advanced EAS systems. However, the Asia-Pacific region is anticipated to experience the highest growth rate during the forecast period, driven by rapid economic expansion, increasing retail sector growth, and rising consumer spending.
- North America: High retail density and advanced retail infrastructure are key drivers.
- Europe: Strong regulatory frameworks and established retail security practices contribute to market growth.
- Asia-Pacific: Rapid economic growth and expanding retail sector fuel market expansion.
- Specific Countries: The US and China are the largest markets, followed by the UK and Japan.
EAS Anti-theft Antenna Product Landscape
The EAS anti-theft antenna market offers a range of products, including AM/RF and RFID antennas, varying in size, frequency, and detection capabilities. Recent innovations focus on miniaturization for discreet placement, improved sensitivity to detect a wider range of tags, and integration with advanced inventory management systems. Unique selling propositions include enhanced accuracy, reduced false alarms, and ease of installation. Technological advancements are improving detection range and reducing power consumption.
Key Drivers, Barriers & Challenges in EAS Anti-theft Antenna
Key Drivers:
- Increasing retail theft rates globally.
- Growing demand for improved inventory management.
- Technological advancements in RFID and AM/RF technologies.
- Stringent regulatory compliance requirements.
Key Challenges and Restraints:
- High initial investment costs for implementing EAS systems.
- Technological limitations of existing systems (e.g., detection of smaller items).
- Competition from alternative security solutions.
- Supply chain disruptions impacting the availability of components.
Emerging Opportunities in EAS Anti-theft Antenna
- Expansion into emerging markets with a growing retail sector.
- Development of integrated security solutions combining EAS with other technologies (e.g., video analytics).
- Growing demand for cloud-based EAS management systems.
- Increased focus on eco-friendly and energy-efficient antennas.
Growth Accelerators in the EAS Anti-theft Antenna Industry
Technological breakthroughs in RFID technology, such as the development of more sensitive and reliable tags and antennas, are a major growth catalyst. Strategic partnerships between EAS manufacturers and retail technology providers are facilitating the integration of EAS systems into wider retail management solutions. Expansion into new markets, particularly in developing economies with a rapidly growing retail sector, will further accelerate growth.
Key Players Shaping the EAS Anti-theft Antenna Market
- Checkpoint Systems
- Nedap
- Sensormatic
- Baofeite
- Eant Digital Technology
- Lifangmi
- Promatic
- ONTIME
- Century
Notable Milestones in EAS Anti-theft Antenna Sector
- 2020: Checkpoint Systems launched a new generation of RFID antennas with improved detection accuracy.
- 2022: Nedap introduced a smaller, more discreet AM/RF antenna designed for high-traffic retail environments.
- 2023: Sensormatic acquired a smaller EAS technology provider, expanding its product portfolio. (Further details of acquisitions are unavailable for other companies and hence not included)
In-Depth EAS Anti-theft Antenna Market Outlook
The future of the EAS Anti-theft Antenna market looks promising, driven by continued technological advancements, increasing retail security concerns, and expansion into new markets. The market is poised for significant growth, fueled by innovation, strategic partnerships, and a rising demand for efficient and reliable loss prevention solutions. Strategic opportunities exist for companies that can develop innovative products, offer comprehensive solutions, and adapt to the changing needs of the retail industry. The market is expected to continue its steady growth, presenting a significant opportunity for existing players and new entrants alike.
EAS Anti-theft Antenna Segmentation
-
1. Application
- 1.1. Supermarket
- 1.2. Clothing Store
- 1.3. Pharmacy
- 1.4. Other
-
2. Types
- 2.1. Radio Frequency
- 2.2. Acoustomagnetic
- 2.3. Electromagnetic Waves
EAS Anti-theft Antenna Segmentation By Geography
-
1. North America
- 1.1. United States
- 1.2. Canada
- 1.3. Mexico
-
2. South America
- 2.1. Brazil
- 2.2. Argentina
- 2.3. Rest of South America
-
3. Europe
- 3.1. United Kingdom
- 3.2. Germany
- 3.3. France
- 3.4. Italy
- 3.5. Spain
- 3.6. Russia
- 3.7. Benelux
- 3.8. Nordics
- 3.9. Rest of Europe
-
4. Middle East & Africa
- 4.1. Turkey
- 4.2. Israel
- 4.3. GCC
- 4.4. North Africa
- 4.5. South Africa
- 4.6. Rest of Middle East & Africa
-
5. Asia Pacific
- 5.1. China
- 5.2. India
- 5.3. Japan
- 5.4. South Korea
- 5.5. ASEAN
- 5.6. Oceania
- 5.7. Rest of Asia Pacific

EAS Anti-theft Antenna REPORT HIGHLIGHTS
| Aspects | Details |
|---|---|
| Study Period | 2019-2033 |
| Base Year | 2024 |
| Estimated Year | 2025 |
| Forecast Period | 2025-2033 |
| Historical Period | 2019-2024 |
| Growth Rate | CAGR of XX% from 2019-2033 |
| Segmentation |
|
Table of Contents
- 1. Introduction
- 1.1. Research Scope
- 1.2. Market Segmentation
- 1.3. Research Methodology
- 1.4. Definitions and Assumptions
- 2. Executive Summary
- 2.1. Introduction
- 3. Market Dynamics
- 3.1. Introduction
- 3.2. Market Drivers
- 3.3. Market Restrains
- 3.4. Market Trends
- 4. Market Factor Analysis
- 4.1. Porters Five Forces
- 4.2. Supply/Value Chain
- 4.3. PESTEL analysis
- 4.4. Market Entropy
- 4.5. Patent/Trademark Analysis
- 5. Global EAS Anti-theft Antenna Analysis, Insights and Forecast, 2019-2031
- 5.1. Market Analysis, Insights and Forecast - by Application
- 5.1.1. Supermarket
- 5.1.2. Clothing Store
- 5.1.3. Pharmacy
- 5.1.4. Other
- 5.2. Market Analysis, Insights and Forecast - by Types
- 5.2.1. Radio Frequency
- 5.2.2. Acoustomagnetic
- 5.2.3. Electromagnetic Waves
- 5.3. Market Analysis, Insights and Forecast - by Region
- 5.3.1. North America
- 5.3.2. South America
- 5.3.3. Europe
- 5.3.4. Middle East & Africa
- 5.3.5. Asia Pacific
- 5.1. Market Analysis, Insights and Forecast - by Application
- 6. North America EAS Anti-theft Antenna Analysis, Insights and Forecast, 2019-2031
- 6.1. Market Analysis, Insights and Forecast - by Application
- 6.1.1. Supermarket
- 6.1.2. Clothing Store
- 6.1.3. Pharmacy
- 6.1.4. Other
- 6.2. Market Analysis, Insights and Forecast - by Types
- 6.2.1. Radio Frequency
- 6.2.2. Acoustomagnetic
- 6.2.3. Electromagnetic Waves
- 6.1. Market Analysis, Insights and Forecast - by Application
- 7. South America EAS Anti-theft Antenna Analysis, Insights and Forecast, 2019-2031
- 7.1. Market Analysis, Insights and Forecast - by Application
- 7.1.1. Supermarket
- 7.1.2. Clothing Store
- 7.1.3. Pharmacy
- 7.1.4. Other
- 7.2. Market Analysis, Insights and Forecast - by Types
- 7.2.1. Radio Frequency
- 7.2.2. Acoustomagnetic
- 7.2.3. Electromagnetic Waves
- 7.1. Market Analysis, Insights and Forecast - by Application
- 8. Europe EAS Anti-theft Antenna Analysis, Insights and Forecast, 2019-2031
- 8.1. Market Analysis, Insights and Forecast - by Application
- 8.1.1. Supermarket
- 8.1.2. Clothing Store
- 8.1.3. Pharmacy
- 8.1.4. Other
- 8.2. Market Analysis, Insights and Forecast - by Types
- 8.2.1. Radio Frequency
- 8.2.2. Acoustomagnetic
- 8.2.3. Electromagnetic Waves
- 8.1. Market Analysis, Insights and Forecast - by Application
- 9. Middle East & Africa EAS Anti-theft Antenna Analysis, Insights and Forecast, 2019-2031
- 9.1. Market Analysis, Insights and Forecast - by Application
- 9.1.1. Supermarket
- 9.1.2. Clothing Store
- 9.1.3. Pharmacy
- 9.1.4. Other
- 9.2. Market Analysis, Insights and Forecast - by Types
- 9.2.1. Radio Frequency
- 9.2.2. Acoustomagnetic
- 9.2.3. Electromagnetic Waves
- 9.1. Market Analysis, Insights and Forecast - by Application
- 10. Asia Pacific EAS Anti-theft Antenna Analysis, Insights and Forecast, 2019-2031
- 10.1. Market Analysis, Insights and Forecast - by Application
- 10.1.1. Supermarket
- 10.1.2. Clothing Store
- 10.1.3. Pharmacy
- 10.1.4. Other
- 10.2. Market Analysis, Insights and Forecast - by Types
- 10.2.1. Radio Frequency
- 10.2.2. Acoustomagnetic
- 10.2.3. Electromagnetic Waves
- 10.1. Market Analysis, Insights and Forecast - by Application
- 11. Competitive Analysis
- 11.1. Global Market Share Analysis 2024
- 11.2. Company Profiles
- 11.2.1 Checkpoint Systems
- 11.2.1.1. Overview
- 11.2.1.2. Products
- 11.2.1.3. SWOT Analysis
- 11.2.1.4. Recent Developments
- 11.2.1.5. Financials (Based on Availability)
- 11.2.2 Nedap
- 11.2.2.1. Overview
- 11.2.2.2. Products
- 11.2.2.3. SWOT Analysis
- 11.2.2.4. Recent Developments
- 11.2.2.5. Financials (Based on Availability)
- 11.2.3 Sensormatic
- 11.2.3.1. Overview
- 11.2.3.2. Products
- 11.2.3.3. SWOT Analysis
- 11.2.3.4. Recent Developments
- 11.2.3.5. Financials (Based on Availability)
- 11.2.4 Baofeite
- 11.2.4.1. Overview
- 11.2.4.2. Products
- 11.2.4.3. SWOT Analysis
- 11.2.4.4. Recent Developments
- 11.2.4.5. Financials (Based on Availability)
- 11.2.5 Eant Digital Technology
- 11.2.5.1. Overview
- 11.2.5.2. Products
- 11.2.5.3. SWOT Analysis
- 11.2.5.4. Recent Developments
- 11.2.5.5. Financials (Based on Availability)
- 11.2.6 Lifangmi
- 11.2.6.1. Overview
- 11.2.6.2. Products
- 11.2.6.3. SWOT Analysis
- 11.2.6.4. Recent Developments
- 11.2.6.5. Financials (Based on Availability)
- 11.2.7 Promatic
- 11.2.7.1. Overview
- 11.2.7.2. Products
- 11.2.7.3. SWOT Analysis
- 11.2.7.4. Recent Developments
- 11.2.7.5. Financials (Based on Availability)
- 11.2.8 ONTIME
- 11.2.8.1. Overview
- 11.2.8.2. Products
- 11.2.8.3. SWOT Analysis
- 11.2.8.4. Recent Developments
- 11.2.8.5. Financials (Based on Availability)
- 11.2.9 Century
- 11.2.9.1. Overview
- 11.2.9.2. Products
- 11.2.9.3. SWOT Analysis
- 11.2.9.4. Recent Developments
- 11.2.9.5. Financials (Based on Availability)
- 11.2.1 Checkpoint Systems
List of Figures
- Figure 1: Global EAS Anti-theft Antenna Revenue Breakdown (million, %) by Region 2024 & 2032
- Figure 2: North America EAS Anti-theft Antenna Revenue (million), by Application 2024 & 2032
- Figure 3: North America EAS Anti-theft Antenna Revenue Share (%), by Application 2024 & 2032
- Figure 4: North America EAS Anti-theft Antenna Revenue (million), by Types 2024 & 2032
- Figure 5: North America EAS Anti-theft Antenna Revenue Share (%), by Types 2024 & 2032
- Figure 6: North America EAS Anti-theft Antenna Revenue (million), by Country 2024 & 2032
- Figure 7: North America EAS Anti-theft Antenna Revenue Share (%), by Country 2024 & 2032
- Figure 8: South America EAS Anti-theft Antenna Revenue (million), by Application 2024 & 2032
- Figure 9: South America EAS Anti-theft Antenna Revenue Share (%), by Application 2024 & 2032
- Figure 10: South America EAS Anti-theft Antenna Revenue (million), by Types 2024 & 2032
- Figure 11: South America EAS Anti-theft Antenna Revenue Share (%), by Types 2024 & 2032
- Figure 12: South America EAS Anti-theft Antenna Revenue (million), by Country 2024 & 2032
- Figure 13: South America EAS Anti-theft Antenna Revenue Share (%), by Country 2024 & 2032
- Figure 14: Europe EAS Anti-theft Antenna Revenue (million), by Application 2024 & 2032
- Figure 15: Europe EAS Anti-theft Antenna Revenue Share (%), by Application 2024 & 2032
- Figure 16: Europe EAS Anti-theft Antenna Revenue (million), by Types 2024 & 2032
- Figure 17: Europe EAS Anti-theft Antenna Revenue Share (%), by Types 2024 & 2032
- Figure 18: Europe EAS Anti-theft Antenna Revenue (million), by Country 2024 & 2032
- Figure 19: Europe EAS Anti-theft Antenna Revenue Share (%), by Country 2024 & 2032
- Figure 20: Middle East & Africa EAS Anti-theft Antenna Revenue (million), by Application 2024 & 2032
- Figure 21: Middle East & Africa EAS Anti-theft Antenna Revenue Share (%), by Application 2024 & 2032
- Figure 22: Middle East & Africa EAS Anti-theft Antenna Revenue (million), by Types 2024 & 2032
- Figure 23: Middle East & Africa EAS Anti-theft Antenna Revenue Share (%), by Types 2024 & 2032
- Figure 24: Middle East & Africa EAS Anti-theft Antenna Revenue (million), by Country 2024 & 2032
- Figure 25: Middle East & Africa EAS Anti-theft Antenna Revenue Share (%), by Country 2024 & 2032
- Figure 26: Asia Pacific EAS Anti-theft Antenna Revenue (million), by Application 2024 & 2032
- Figure 27: Asia Pacific EAS Anti-theft Antenna Revenue Share (%), by Application 2024 & 2032
- Figure 28: Asia Pacific EAS Anti-theft Antenna Revenue (million), by Types 2024 & 2032
- Figure 29: Asia Pacific EAS Anti-theft Antenna Revenue Share (%), by Types 2024 & 2032
- Figure 30: Asia Pacific EAS Anti-theft Antenna Revenue (million), by Country 2024 & 2032
- Figure 31: Asia Pacific EAS Anti-theft Antenna Revenue Share (%), by Country 2024 & 2032
List of Tables
- Table 1: Global EAS Anti-theft Antenna Revenue million Forecast, by Region 2019 & 2032
- Table 2: Global EAS Anti-theft Antenna Revenue million Forecast, by Application 2019 & 2032
- Table 3: Global EAS Anti-theft Antenna Revenue million Forecast, by Types 2019 & 2032
- Table 4: Global EAS Anti-theft Antenna Revenue million Forecast, by Region 2019 & 2032
- Table 5: Global EAS Anti-theft Antenna Revenue million Forecast, by Application 2019 & 2032
- Table 6: Global EAS Anti-theft Antenna Revenue million Forecast, by Types 2019 & 2032
- Table 7: Global EAS Anti-theft Antenna Revenue million Forecast, by Country 2019 & 2032
- Table 8: United States EAS Anti-theft Antenna Revenue (million) Forecast, by Application 2019 & 2032
- Table 9: Canada EAS Anti-theft Antenna Revenue (million) Forecast, by Application 2019 & 2032
- Table 10: Mexico EAS Anti-theft Antenna Revenue (million) Forecast, by Application 2019 & 2032
- Table 11: Global EAS Anti-theft Antenna Revenue million Forecast, by Application 2019 & 2032
- Table 12: Global EAS Anti-theft Antenna Revenue million Forecast, by Types 2019 & 2032
- Table 13: Global EAS Anti-theft Antenna Revenue million Forecast, by Country 2019 & 2032
- Table 14: Brazil EAS Anti-theft Antenna Revenue (million) Forecast, by Application 2019 & 2032
- Table 15: Argentina EAS Anti-theft Antenna Revenue (million) Forecast, by Application 2019 & 2032
- Table 16: Rest of South America EAS Anti-theft Antenna Revenue (million) Forecast, by Application 2019 & 2032
- Table 17: Global EAS Anti-theft Antenna Revenue million Forecast, by Application 2019 & 2032
- Table 18: Global EAS Anti-theft Antenna Revenue million Forecast, by Types 2019 & 2032
- Table 19: Global EAS Anti-theft Antenna Revenue million Forecast, by Country 2019 & 2032
- Table 20: United Kingdom EAS Anti-theft Antenna Revenue (million) Forecast, by Application 2019 & 2032
- Table 21: Germany EAS Anti-theft Antenna Revenue (million) Forecast, by Application 2019 & 2032
- Table 22: France EAS Anti-theft Antenna Revenue (million) Forecast, by Application 2019 & 2032
- Table 23: Italy EAS Anti-theft Antenna Revenue (million) Forecast, by Application 2019 & 2032
- Table 24: Spain EAS Anti-theft Antenna Revenue (million) Forecast, by Application 2019 & 2032
- Table 25: Russia EAS Anti-theft Antenna Revenue (million) Forecast, by Application 2019 & 2032
- Table 26: Benelux EAS Anti-theft Antenna Revenue (million) Forecast, by Application 2019 & 2032
- Table 27: Nordics EAS Anti-theft Antenna Revenue (million) Forecast, by Application 2019 & 2032
- Table 28: Rest of Europe EAS Anti-theft Antenna Revenue (million) Forecast, by Application 2019 & 2032
- Table 29: Global EAS Anti-theft Antenna Revenue million Forecast, by Application 2019 & 2032
- Table 30: Global EAS Anti-theft Antenna Revenue million Forecast, by Types 2019 & 2032
- Table 31: Global EAS Anti-theft Antenna Revenue million Forecast, by Country 2019 & 2032
- Table 32: Turkey EAS Anti-theft Antenna Revenue (million) Forecast, by Application 2019 & 2032
- Table 33: Israel EAS Anti-theft Antenna Revenue (million) Forecast, by Application 2019 & 2032
- Table 34: GCC EAS Anti-theft Antenna Revenue (million) Forecast, by Application 2019 & 2032
- Table 35: North Africa EAS Anti-theft Antenna Revenue (million) Forecast, by Application 2019 & 2032
- Table 36: South Africa EAS Anti-theft Antenna Revenue (million) Forecast, by Application 2019 & 2032
- Table 37: Rest of Middle East & Africa EAS Anti-theft Antenna Revenue (million) Forecast, by Application 2019 & 2032
- Table 38: Global EAS Anti-theft Antenna Revenue million Forecast, by Application 2019 & 2032
- Table 39: Global EAS Anti-theft Antenna Revenue million Forecast, by Types 2019 & 2032
- Table 40: Global EAS Anti-theft Antenna Revenue million Forecast, by Country 2019 & 2032
- Table 41: China EAS Anti-theft Antenna Revenue (million) Forecast, by Application 2019 & 2032
- Table 42: India EAS Anti-theft Antenna Revenue (million) Forecast, by Application 2019 & 2032
- Table 43: Japan EAS Anti-theft Antenna Revenue (million) Forecast, by Application 2019 & 2032
- Table 44: South Korea EAS Anti-theft Antenna Revenue (million) Forecast, by Application 2019 & 2032
- Table 45: ASEAN EAS Anti-theft Antenna Revenue (million) Forecast, by Application 2019 & 2032
- Table 46: Oceania EAS Anti-theft Antenna Revenue (million) Forecast, by Application 2019 & 2032
- Table 47: Rest of Asia Pacific EAS Anti-theft Antenna Revenue (million) Forecast, by Application 2019 & 2032
Frequently Asked Questions
1. What is the projected Compound Annual Growth Rate (CAGR) of the EAS Anti-theft Antenna?
The projected CAGR is approximately XX%.
2. Which companies are prominent players in the EAS Anti-theft Antenna?
Key companies in the market include Checkpoint Systems, Nedap, Sensormatic, Baofeite, Eant Digital Technology, Lifangmi, Promatic, ONTIME, Century.
3. What are the main segments of the EAS Anti-theft Antenna?
The market segments include Application, Types.
4. Can you provide details about the market size?
The market size is estimated to be USD XXX million as of 2022.
5. What are some drivers contributing to market growth?
N/A
6. What are the notable trends driving market growth?
N/A
7. Are there any restraints impacting market growth?
N/A
8. Can you provide examples of recent developments in the market?
N/A
9. What pricing options are available for accessing the report?
Pricing options include single-user, multi-user, and enterprise licenses priced at USD 2900.00, USD 4350.00, and USD 5800.00 respectively.
10. Is the market size provided in terms of value or volume?
The market size is provided in terms of value, measured in million.
11. Are there any specific market keywords associated with the report?
Yes, the market keyword associated with the report is "EAS Anti-theft Antenna," which aids in identifying and referencing the specific market segment covered.
12. How do I determine which pricing option suits my needs best?
The pricing options vary based on user requirements and access needs. Individual users may opt for single-user licenses, while businesses requiring broader access may choose multi-user or enterprise licenses for cost-effective access to the report.
13. Are there any additional resources or data provided in the EAS Anti-theft Antenna report?
While the report offers comprehensive insights, it's advisable to review the specific contents or supplementary materials provided to ascertain if additional resources or data are available.
14. How can I stay updated on further developments or reports in the EAS Anti-theft Antenna?
To stay informed about further developments, trends, and reports in the EAS Anti-theft Antenna, consider subscribing to industry newsletters, following relevant companies and organizations, or regularly checking reputable industry news sources and publications.
Methodology
Step 1 - Identification of Relevant Samples Size from Population Database


Step 2 - Approaches for Defining Global Market Size (Value, Volume* & Price*)

Note*: In applicable scenarios
Step 3 - Data Sources
Primary Research
- Web Analytics
- Survey Reports
- Research Institute
- Latest Research Reports
- Opinion Leaders
Secondary Research
- Annual Reports
- White Paper
- Latest Press Release
- Industry Association
- Paid Database
- Investor Presentations

Step 4 - Data Triangulation
Involves using different sources of information in order to increase the validity of a study
These sources are likely to be stakeholders in a program - participants, other researchers, program staff, other community members, and so on.
Then we put all data in single framework & apply various statistical tools to find out the dynamic on the market.
During the analysis stage, feedback from the stakeholder groups would be compared to determine areas of agreement as well as areas of divergence


