
Key Insights
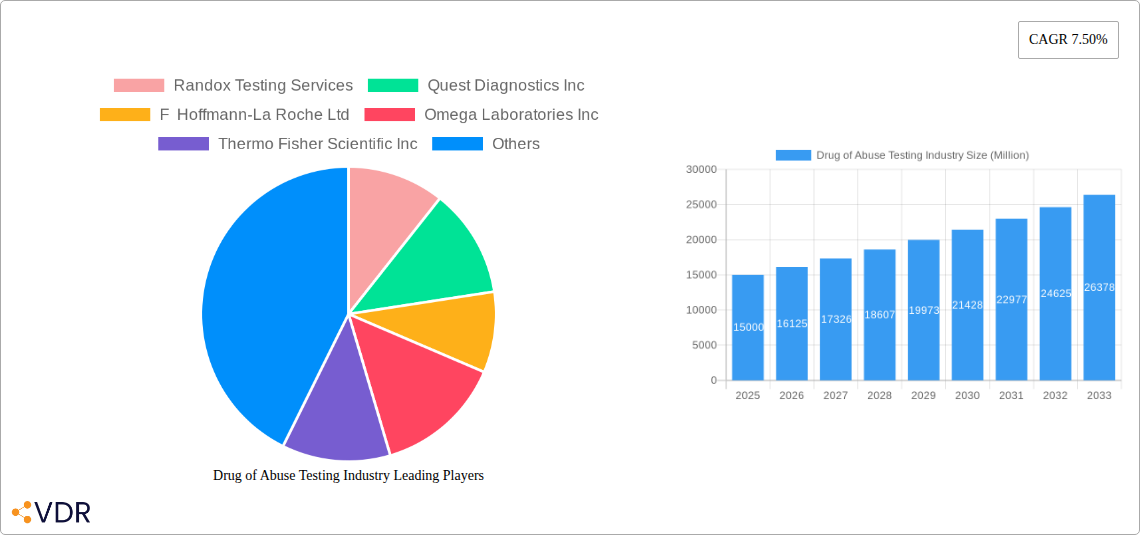
The global drug of abuse testing market is experiencing robust growth, projected to reach a substantial market size by 2033, driven by a 7.50% CAGR. This expansion is fueled by several key factors. The rising prevalence of substance abuse globally necessitates increased testing for various purposes, including workplace drug screenings, clinical diagnostics, and forensic investigations. Technological advancements in testing methodologies, such as rapid testing devices and the adoption of advanced analytical techniques like mass spectrometry, contribute significantly to market growth. Furthermore, the increasing awareness of the social and economic burden of drug abuse is driving governmental initiatives and healthcare investments in improved drug testing infrastructure and capabilities. The market is segmented by end-user (hospitals, diagnostic labs, forensic labs, etc.), product type (analyzers, breath analyzers, oral fluid testing devices, consumables), and sample type (saliva, urine, blood, etc.), allowing for specialized testing solutions tailored to specific needs. This segmentation fosters market diversification and caters to evolving testing preferences. However, factors such as stringent regulatory requirements, the potential for false positives, and the cost associated with sophisticated testing can pose certain restraints to market growth. Despite these challenges, the overall market outlook remains positive, with substantial growth opportunities across various segments and geographical regions.
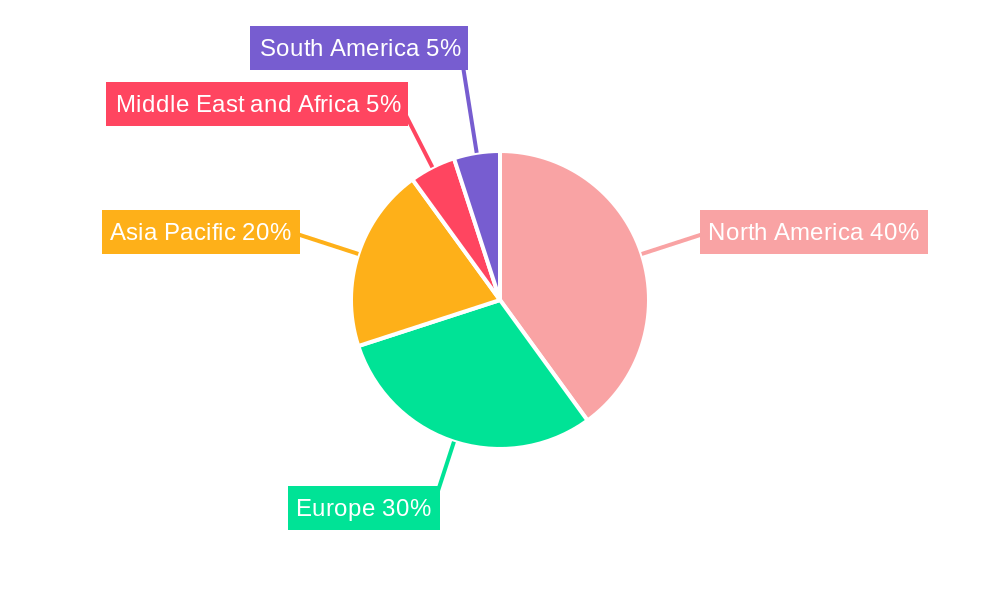
The market's regional distribution reflects varying levels of healthcare infrastructure and prevalence of substance abuse. North America, particularly the United States, is expected to hold a significant market share due to its well-established healthcare system and robust drug testing infrastructure. Europe and Asia Pacific are also projected to witness substantial growth driven by increasing awareness and expanding healthcare sectors. The presence of major players like Randox Testing Services, Quest Diagnostics, Roche, and Abbott Laboratories signifies the market's competitiveness and the ongoing drive for innovation. These companies are engaged in developing advanced testing technologies, expanding their product portfolios, and acquiring smaller companies to enhance their market presence and capabilities. The continuous evolution of drug abuse patterns necessitates a responsive and adaptive market, with ongoing research and development focusing on the detection of emerging drugs and improving the accuracy and efficiency of testing methods.
Drug of Abuse Testing Industry: A Comprehensive Market Report (2019-2033)
This comprehensive report provides a detailed analysis of the Drug of Abuse Testing industry, offering invaluable insights for industry professionals, investors, and researchers. The report covers market dynamics, growth trends, regional analysis, product landscapes, and key player profiles, encompassing the period from 2019 to 2033, with a focus on 2025. The study dissects the parent market of in-vitro diagnostics and the child market of drug testing, providing a granular understanding of market segmentation across end users, product types, and sample types. The report also incorporates significant industry developments, highlighting key milestones and their impact on market dynamics. The total market size in 2025 is estimated at xx Million.
Drug of Abuse Testing Industry Market Dynamics & Structure
The Drug of Abuse Testing market is characterized by a moderately concentrated structure, with several large players holding significant market share. Randox Testing Services, Quest Diagnostics Inc., F. Hoffmann-La Roche Ltd., and Thermo Fisher Scientific Inc. are among the prominent companies shaping the competitive landscape. Technological innovation, particularly in rapid testing devices and advanced analytical techniques, is a significant driver of growth. Regulatory frameworks, varying across regions, significantly impact market access and product development. The industry faces competition from substitute methods, though the demand for accurate and reliable testing remains high. Mergers and acquisitions (M&A) activities have played a role in shaping market consolidation, with an estimated xx Million in M&A deal value in the historical period.
- Market Concentration: Moderately concentrated, with top 5 players holding approximately xx% market share (2024).
- Technological Innovation: Focus on rapid, point-of-care testing, advanced analytical techniques (e.g., LC-MS/MS), and digitalization of testing processes.
- Regulatory Framework: Stringent regulations governing testing procedures and data privacy vary across countries, creating challenges for market entry and expansion.
- Competitive Substitutes: Limited direct substitutes, but alternative screening methods and changes in testing preferences pose indirect competition.
- End-User Demographics: Growth driven by increasing prevalence of substance abuse, stricter workplace regulations, and rising demand for forensic testing.
- M&A Trends: Consolidation through acquisitions of smaller testing laboratories and technology companies; xx major M&A deals observed between 2019-2024.
Drug of Abuse Testing Industry Growth Trends & Insights
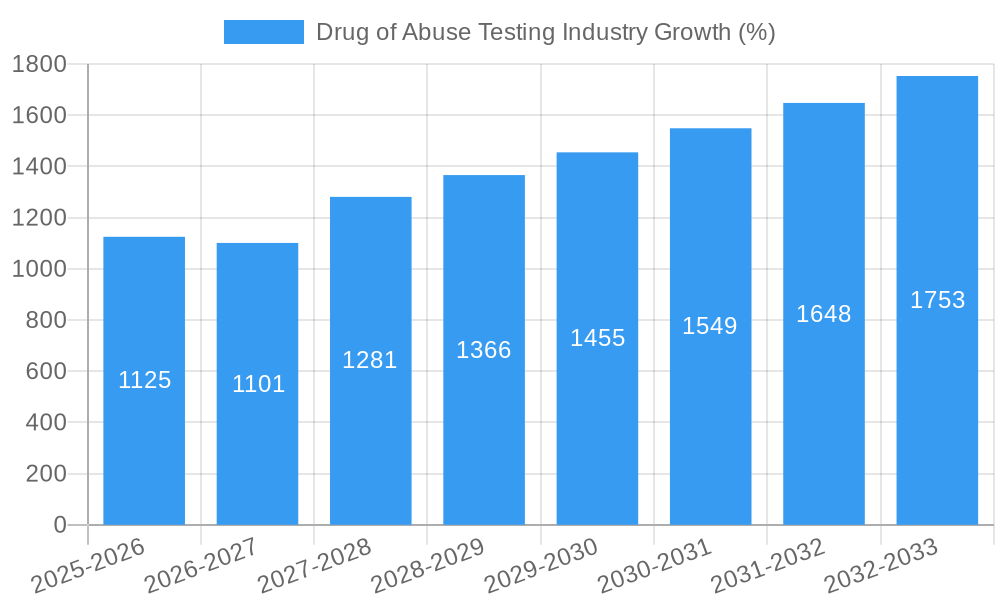
The Drug of Abuse Testing market experienced robust growth between 2019 and 2024, driven by factors such as rising substance abuse rates, increased demand for workplace drug screening, and the adoption of more sophisticated testing technologies. The market size exhibited a CAGR of xx% during this period, reaching xx Million in 2024. The forecast period (2025-2033) projects sustained growth, albeit at a slightly moderated pace, driven by the increasing adoption of rapid testing technologies, expansion into emerging markets, and growing awareness of public health concerns related to drug abuse. Market penetration rates vary widely depending on the region and end-user segment, with higher adoption rates observed in developed countries with stringent regulations. Technological disruptions, such as the introduction of new analyzers and improved point-of-care testing devices, are further stimulating market growth.
Dominant Regions, Countries, or Segments in Drug of Abuse Testing Industry
North America and Europe currently dominate the Drug of Abuse Testing market, driven by high prevalence of substance abuse, stringent regulations, and well-established healthcare infrastructure. Within these regions, the United States and Germany hold significant market share. The Hospitals and Diagnostic Laboratories segments are the largest end-users, followed by Forensic Laboratories. Urine testing remains the most prevalent sample type due to its established protocols and cost-effectiveness. However, saliva testing is gaining traction due to its non-invasive nature and potential for rapid testing.
- Key Drivers: Stringent regulations (North America, Europe), high prevalence of substance abuse, robust healthcare infrastructure, increased workplace drug testing programs.
- Dominant Segments: Hospitals (xx% market share), Diagnostic Laboratories (xx% market share), Urine sample testing (xx% market share), Analyzers (xx% market share).
- Growth Potential: Emerging markets (Asia Pacific, Latin America) offer significant growth opportunities due to increasing awareness of substance abuse and improvements in healthcare systems.
Drug of Abuse Testing Industry Product Landscape
The Drug of Abuse Testing product landscape is characterized by a diverse range of analyzers, rapid testing devices (including breath and oral fluid tests), and consumables. Recent innovations have focused on improving the speed, accuracy, and ease of use of testing procedures. Point-of-care testing devices are gaining popularity due to their ability to provide rapid results in various settings. Manufacturers are emphasizing the development of more sensitive and specific assays to detect a wider range of drugs and metabolites. Unique selling propositions include improved sensitivity, faster turnaround times, ease of use, and integrated data management systems.
Key Drivers, Barriers & Challenges in Drug of Abuse Testing Industry
Key Drivers:
- Rising prevalence of substance abuse globally
- Stringent regulations on workplace drug testing
- Growing demand for forensic toxicology services
- Technological advancements in testing methodologies
Challenges:
- Stringent regulatory approvals and certifications can slow down product launches.
- Supply chain disruptions can impact the availability of testing consumables and reagents.
- Competition from established players and new entrants can put downward pressure on prices.
- Ensuring data privacy and security is crucial, particularly with the increasing use of digital technologies.
Emerging Opportunities in Drug of Abuse Testing Industry
- Expansion into emerging markets with growing awareness of substance abuse issues.
- Development of point-of-care testing devices for home use or decentralized settings.
- Integration of artificial intelligence and machine learning for improved diagnostic accuracy and efficiency.
- Growing demand for specialized tests to detect new psychoactive substances (NPS).
Growth Accelerators in the Drug of Abuse Testing Industry Industry
Continued technological advancements, particularly in rapid and sensitive testing methodologies, will be key drivers of market growth. Strategic partnerships between testing companies and healthcare providers will facilitate wider market access and adoption. Expansion into new geographical markets with high prevalence of substance abuse will further fuel growth.
Key Players Shaping the Drug of Abuse Testing Industry Market
- Randox Testing Services
- Quest Diagnostics Inc
- F Hoffmann-La Roche Ltd
- Omega Laboratories Inc
- Thermo Fisher Scientific Inc
- Abbott Laboratories
- Psychemedics Corporation
- Cordant Health Solutions
- Siemens Healthineers AG
- Clinical Reference Laboratory Inc
- United States Drug Testing Laboratories Inc (USDTL)
- Dragerwerk AG & Co KGaA
- Danaher Corporation (Beckman Coulter)
- Precision Diagnostics
- LabCorp
Notable Milestones in Drug of Abuse Testing Industry Sector
- August 2022: Delaware Division of Public Health includes fentanyl strips in Narcan kits.
- June 2022: Punjab Government, India launches drug screening drive in jails.
In-Depth Drug of Abuse Testing Industry Market Outlook
The Drug of Abuse Testing market is poised for sustained growth over the forecast period, driven by technological advancements, regulatory changes, and increasing awareness of substance abuse. Strategic investments in research and development, along with strategic partnerships and market expansions, will be crucial for companies to capitalize on the significant growth opportunities presented by this dynamic market. The market is projected to reach xx Million by 2033.
Drug of Abuse Testing Industry Segmentation
-
1. Product Type
-
1.1. Analyzers
- 1.1.1. Immunoassay Analyzers
- 1.1.2. Chromatographic Devices
- 1.1.3. Breath Analyzers
-
1.2. Rapid Testing Devices
- 1.2.1. Urine Testing Devices
- 1.2.2. Oral Fluid Testing Devices
- 1.3. Consumables
-
1.1. Analyzers
-
2. Sample Type
- 2.1. Saliva
- 2.2. Urine
- 2.3. Blood
- 2.4. Other Sample Types
-
3. End User
- 3.1. Hospitals
- 3.2. Diagnostic Laboratories
- 3.3. Forensic Laboratories
- 3.4. Other End Users
Drug of Abuse Testing Industry Segmentation By Geography
-
1. North America
- 1.1. United States
- 1.2. Canada
- 1.3. Mexico
-
2. Europe
- 2.1. Germany
- 2.2. United Kingdom
- 2.3. France
- 2.4. Italy
- 2.5. Spain
- 2.6. Rest of Europe
-
3. Asia Pacific
- 3.1. China
- 3.2. Japan
- 3.3. India
- 3.4. Australia
- 3.5. South Korea
- 3.6. Rest of Asia Pacific
-
4. Middle East and Africa
- 4.1. GCC
- 4.2. South Africa
- 4.3. Rest of Middle East and Africa
-
5. South America
- 5.1. Brazil
- 5.2. Argentina
- 5.3. Rest of South America
Drug of Abuse Testing Industry REPORT HIGHLIGHTS
| Aspects | Details |
|---|---|
| Study Period | 2019-2033 |
| Base Year | 2024 |
| Estimated Year | 2025 |
| Forecast Period | 2025-2033 |
| Historical Period | 2019-2024 |
| Growth Rate | CAGR of 7.50% from 2019-2033 |
| Segmentation |
|
Table of Contents
- 1. Introduction
- 1.1. Research Scope
- 1.2. Market Segmentation
- 1.3. Research Methodology
- 1.4. Definitions and Assumptions
- 2. Executive Summary
- 2.1. Introduction
- 3. Market Dynamics
- 3.1. Introduction
- 3.2. Market Drivers
- 3.2.1. Increasing Demand for Drug Abuse Treatment; Stringent Law Mandating Alcohol and Drug Testing; Rising Drug-related Mortality and Increasing Government Initiatives
- 3.3. Market Restrains
- 3.3.1. Perception of Drug Abuse Testing as a Violation of Rights; Lack of Awareness Regarding the Availability of Advanced Drug Testing Devices
- 3.4. Market Trends
- 3.4.1. The Urine Segment is Expected to Dominate in the Market Over the Forecast Period
- 4. Market Factor Analysis
- 4.1. Porters Five Forces
- 4.2. Supply/Value Chain
- 4.3. PESTEL analysis
- 4.4. Market Entropy
- 4.5. Patent/Trademark Analysis
- 5. Global Drug of Abuse Testing Industry Analysis, Insights and Forecast, 2019-2031
- 5.1. Market Analysis, Insights and Forecast - by Product Type
- 5.1.1. Analyzers
- 5.1.1.1. Immunoassay Analyzers
- 5.1.1.2. Chromatographic Devices
- 5.1.1.3. Breath Analyzers
- 5.1.2. Rapid Testing Devices
- 5.1.2.1. Urine Testing Devices
- 5.1.2.2. Oral Fluid Testing Devices
- 5.1.3. Consumables
- 5.1.1. Analyzers
- 5.2. Market Analysis, Insights and Forecast - by Sample Type
- 5.2.1. Saliva
- 5.2.2. Urine
- 5.2.3. Blood
- 5.2.4. Other Sample Types
- 5.3. Market Analysis, Insights and Forecast - by End User
- 5.3.1. Hospitals
- 5.3.2. Diagnostic Laboratories
- 5.3.3. Forensic Laboratories
- 5.3.4. Other End Users
- 5.4. Market Analysis, Insights and Forecast - by Region
- 5.4.1. North America
- 5.4.2. Europe
- 5.4.3. Asia Pacific
- 5.4.4. Middle East and Africa
- 5.4.5. South America
- 5.1. Market Analysis, Insights and Forecast - by Product Type
- 6. North America Drug of Abuse Testing Industry Analysis, Insights and Forecast, 2019-2031
- 6.1. Market Analysis, Insights and Forecast - by Product Type
- 6.1.1. Analyzers
- 6.1.1.1. Immunoassay Analyzers
- 6.1.1.2. Chromatographic Devices
- 6.1.1.3. Breath Analyzers
- 6.1.2. Rapid Testing Devices
- 6.1.2.1. Urine Testing Devices
- 6.1.2.2. Oral Fluid Testing Devices
- 6.1.3. Consumables
- 6.1.1. Analyzers
- 6.2. Market Analysis, Insights and Forecast - by Sample Type
- 6.2.1. Saliva
- 6.2.2. Urine
- 6.2.3. Blood
- 6.2.4. Other Sample Types
- 6.3. Market Analysis, Insights and Forecast - by End User
- 6.3.1. Hospitals
- 6.3.2. Diagnostic Laboratories
- 6.3.3. Forensic Laboratories
- 6.3.4. Other End Users
- 6.1. Market Analysis, Insights and Forecast - by Product Type
- 7. Europe Drug of Abuse Testing Industry Analysis, Insights and Forecast, 2019-2031
- 7.1. Market Analysis, Insights and Forecast - by Product Type
- 7.1.1. Analyzers
- 7.1.1.1. Immunoassay Analyzers
- 7.1.1.2. Chromatographic Devices
- 7.1.1.3. Breath Analyzers
- 7.1.2. Rapid Testing Devices
- 7.1.2.1. Urine Testing Devices
- 7.1.2.2. Oral Fluid Testing Devices
- 7.1.3. Consumables
- 7.1.1. Analyzers
- 7.2. Market Analysis, Insights and Forecast - by Sample Type
- 7.2.1. Saliva
- 7.2.2. Urine
- 7.2.3. Blood
- 7.2.4. Other Sample Types
- 7.3. Market Analysis, Insights and Forecast - by End User
- 7.3.1. Hospitals
- 7.3.2. Diagnostic Laboratories
- 7.3.3. Forensic Laboratories
- 7.3.4. Other End Users
- 7.1. Market Analysis, Insights and Forecast - by Product Type
- 8. Asia Pacific Drug of Abuse Testing Industry Analysis, Insights and Forecast, 2019-2031
- 8.1. Market Analysis, Insights and Forecast - by Product Type
- 8.1.1. Analyzers
- 8.1.1.1. Immunoassay Analyzers
- 8.1.1.2. Chromatographic Devices
- 8.1.1.3. Breath Analyzers
- 8.1.2. Rapid Testing Devices
- 8.1.2.1. Urine Testing Devices
- 8.1.2.2. Oral Fluid Testing Devices
- 8.1.3. Consumables
- 8.1.1. Analyzers
- 8.2. Market Analysis, Insights and Forecast - by Sample Type
- 8.2.1. Saliva
- 8.2.2. Urine
- 8.2.3. Blood
- 8.2.4. Other Sample Types
- 8.3. Market Analysis, Insights and Forecast - by End User
- 8.3.1. Hospitals
- 8.3.2. Diagnostic Laboratories
- 8.3.3. Forensic Laboratories
- 8.3.4. Other End Users
- 8.1. Market Analysis, Insights and Forecast - by Product Type
- 9. Middle East and Africa Drug of Abuse Testing Industry Analysis, Insights and Forecast, 2019-2031
- 9.1. Market Analysis, Insights and Forecast - by Product Type
- 9.1.1. Analyzers
- 9.1.1.1. Immunoassay Analyzers
- 9.1.1.2. Chromatographic Devices
- 9.1.1.3. Breath Analyzers
- 9.1.2. Rapid Testing Devices
- 9.1.2.1. Urine Testing Devices
- 9.1.2.2. Oral Fluid Testing Devices
- 9.1.3. Consumables
- 9.1.1. Analyzers
- 9.2. Market Analysis, Insights and Forecast - by Sample Type
- 9.2.1. Saliva
- 9.2.2. Urine
- 9.2.3. Blood
- 9.2.4. Other Sample Types
- 9.3. Market Analysis, Insights and Forecast - by End User
- 9.3.1. Hospitals
- 9.3.2. Diagnostic Laboratories
- 9.3.3. Forensic Laboratories
- 9.3.4. Other End Users
- 9.1. Market Analysis, Insights and Forecast - by Product Type
- 10. South America Drug of Abuse Testing Industry Analysis, Insights and Forecast, 2019-2031
- 10.1. Market Analysis, Insights and Forecast - by Product Type
- 10.1.1. Analyzers
- 10.1.1.1. Immunoassay Analyzers
- 10.1.1.2. Chromatographic Devices
- 10.1.1.3. Breath Analyzers
- 10.1.2. Rapid Testing Devices
- 10.1.2.1. Urine Testing Devices
- 10.1.2.2. Oral Fluid Testing Devices
- 10.1.3. Consumables
- 10.1.1. Analyzers
- 10.2. Market Analysis, Insights and Forecast - by Sample Type
- 10.2.1. Saliva
- 10.2.2. Urine
- 10.2.3. Blood
- 10.2.4. Other Sample Types
- 10.3. Market Analysis, Insights and Forecast - by End User
- 10.3.1. Hospitals
- 10.3.2. Diagnostic Laboratories
- 10.3.3. Forensic Laboratories
- 10.3.4. Other End Users
- 10.1. Market Analysis, Insights and Forecast - by Product Type
- 11. North America Drug of Abuse Testing Industry Analysis, Insights and Forecast, 2019-2031
- 11.1. Market Analysis, Insights and Forecast - By Country/Sub-region
- 11.1.1 United States
- 11.1.2 Canada
- 11.1.3 Mexico
- 12. Europe Drug of Abuse Testing Industry Analysis, Insights and Forecast, 2019-2031
- 12.1. Market Analysis, Insights and Forecast - By Country/Sub-region
- 12.1.1 Germany
- 12.1.2 United Kingdom
- 12.1.3 France
- 12.1.4 Italy
- 12.1.5 Spain
- 12.1.6 Rest of Europe
- 13. Asia Pacific Drug of Abuse Testing Industry Analysis, Insights and Forecast, 2019-2031
- 13.1. Market Analysis, Insights and Forecast - By Country/Sub-region
- 13.1.1 China
- 13.1.2 Japan
- 13.1.3 India
- 13.1.4 Australia
- 13.1.5 South Korea
- 13.1.6 Rest of Asia Pacific
- 14. Middle East and Africa Drug of Abuse Testing Industry Analysis, Insights and Forecast, 2019-2031
- 14.1. Market Analysis, Insights and Forecast - By Country/Sub-region
- 14.1.1 GCC
- 14.1.2 South Africa
- 14.1.3 Rest of Middle East and Africa
- 15. South America Drug of Abuse Testing Industry Analysis, Insights and Forecast, 2019-2031
- 15.1. Market Analysis, Insights and Forecast - By Country/Sub-region
- 15.1.1 Brazil
- 15.1.2 Argentina
- 15.1.3 Rest of South America
- 16. Competitive Analysis
- 16.1. Global Market Share Analysis 2024
- 16.2. Company Profiles
- 16.2.1 Randox Testing Services
- 16.2.1.1. Overview
- 16.2.1.2. Products
- 16.2.1.3. SWOT Analysis
- 16.2.1.4. Recent Developments
- 16.2.1.5. Financials (Based on Availability)
- 16.2.2 Quest Diagnostics Inc
- 16.2.2.1. Overview
- 16.2.2.2. Products
- 16.2.2.3. SWOT Analysis
- 16.2.2.4. Recent Developments
- 16.2.2.5. Financials (Based on Availability)
- 16.2.3 F Hoffmann-La Roche Ltd
- 16.2.3.1. Overview
- 16.2.3.2. Products
- 16.2.3.3. SWOT Analysis
- 16.2.3.4. Recent Developments
- 16.2.3.5. Financials (Based on Availability)
- 16.2.4 Omega Laboratories Inc
- 16.2.4.1. Overview
- 16.2.4.2. Products
- 16.2.4.3. SWOT Analysis
- 16.2.4.4. Recent Developments
- 16.2.4.5. Financials (Based on Availability)
- 16.2.5 Thermo Fisher Scientific Inc
- 16.2.5.1. Overview
- 16.2.5.2. Products
- 16.2.5.3. SWOT Analysis
- 16.2.5.4. Recent Developments
- 16.2.5.5. Financials (Based on Availability)
- 16.2.6 Abbott Laboratories
- 16.2.6.1. Overview
- 16.2.6.2. Products
- 16.2.6.3. SWOT Analysis
- 16.2.6.4. Recent Developments
- 16.2.6.5. Financials (Based on Availability)
- 16.2.7 Psychemedics Corporation
- 16.2.7.1. Overview
- 16.2.7.2. Products
- 16.2.7.3. SWOT Analysis
- 16.2.7.4. Recent Developments
- 16.2.7.5. Financials (Based on Availability)
- 16.2.8 Cordant Health Solutions
- 16.2.8.1. Overview
- 16.2.8.2. Products
- 16.2.8.3. SWOT Analysis
- 16.2.8.4. Recent Developments
- 16.2.8.5. Financials (Based on Availability)
- 16.2.9 Siemens Healthineers AG
- 16.2.9.1. Overview
- 16.2.9.2. Products
- 16.2.9.3. SWOT Analysis
- 16.2.9.4. Recent Developments
- 16.2.9.5. Financials (Based on Availability)
- 16.2.10 Clinical Reference Laboratory Inc
- 16.2.10.1. Overview
- 16.2.10.2. Products
- 16.2.10.3. SWOT Analysis
- 16.2.10.4. Recent Developments
- 16.2.10.5. Financials (Based on Availability)
- 16.2.11 United States Drug Testing Laboratories Inc (USDTL)
- 16.2.11.1. Overview
- 16.2.11.2. Products
- 16.2.11.3. SWOT Analysis
- 16.2.11.4. Recent Developments
- 16.2.11.5. Financials (Based on Availability)
- 16.2.12 Dragerwerk AG & Co KGaA
- 16.2.12.1. Overview
- 16.2.12.2. Products
- 16.2.12.3. SWOT Analysis
- 16.2.12.4. Recent Developments
- 16.2.12.5. Financials (Based on Availability)
- 16.2.13 Danaher Corporation (Beckman Coulter)
- 16.2.13.1. Overview
- 16.2.13.2. Products
- 16.2.13.3. SWOT Analysis
- 16.2.13.4. Recent Developments
- 16.2.13.5. Financials (Based on Availability)
- 16.2.14 Precision Diagnostics
- 16.2.14.1. Overview
- 16.2.14.2. Products
- 16.2.14.3. SWOT Analysis
- 16.2.14.4. Recent Developments
- 16.2.14.5. Financials (Based on Availability)
- 16.2.15 LabCorp
- 16.2.15.1. Overview
- 16.2.15.2. Products
- 16.2.15.3. SWOT Analysis
- 16.2.15.4. Recent Developments
- 16.2.15.5. Financials (Based on Availability)
- 16.2.1 Randox Testing Services
List of Figures
- Figure 1: Global Drug of Abuse Testing Industry Revenue Breakdown (Million, %) by Region 2024 & 2032
- Figure 2: Global Drug of Abuse Testing Industry Volume Breakdown (K Unit, %) by Region 2024 & 2032
- Figure 3: North America Drug of Abuse Testing Industry Revenue (Million), by Country 2024 & 2032
- Figure 4: North America Drug of Abuse Testing Industry Volume (K Unit), by Country 2024 & 2032
- Figure 5: North America Drug of Abuse Testing Industry Revenue Share (%), by Country 2024 & 2032
- Figure 6: North America Drug of Abuse Testing Industry Volume Share (%), by Country 2024 & 2032
- Figure 7: Europe Drug of Abuse Testing Industry Revenue (Million), by Country 2024 & 2032
- Figure 8: Europe Drug of Abuse Testing Industry Volume (K Unit), by Country 2024 & 2032
- Figure 9: Europe Drug of Abuse Testing Industry Revenue Share (%), by Country 2024 & 2032
- Figure 10: Europe Drug of Abuse Testing Industry Volume Share (%), by Country 2024 & 2032
- Figure 11: Asia Pacific Drug of Abuse Testing Industry Revenue (Million), by Country 2024 & 2032
- Figure 12: Asia Pacific Drug of Abuse Testing Industry Volume (K Unit), by Country 2024 & 2032
- Figure 13: Asia Pacific Drug of Abuse Testing Industry Revenue Share (%), by Country 2024 & 2032
- Figure 14: Asia Pacific Drug of Abuse Testing Industry Volume Share (%), by Country 2024 & 2032
- Figure 15: Middle East and Africa Drug of Abuse Testing Industry Revenue (Million), by Country 2024 & 2032
- Figure 16: Middle East and Africa Drug of Abuse Testing Industry Volume (K Unit), by Country 2024 & 2032
- Figure 17: Middle East and Africa Drug of Abuse Testing Industry Revenue Share (%), by Country 2024 & 2032
- Figure 18: Middle East and Africa Drug of Abuse Testing Industry Volume Share (%), by Country 2024 & 2032
- Figure 19: South America Drug of Abuse Testing Industry Revenue (Million), by Country 2024 & 2032
- Figure 20: South America Drug of Abuse Testing Industry Volume (K Unit), by Country 2024 & 2032
- Figure 21: South America Drug of Abuse Testing Industry Revenue Share (%), by Country 2024 & 2032
- Figure 22: South America Drug of Abuse Testing Industry Volume Share (%), by Country 2024 & 2032
- Figure 23: North America Drug of Abuse Testing Industry Revenue (Million), by Product Type 2024 & 2032
- Figure 24: North America Drug of Abuse Testing Industry Volume (K Unit), by Product Type 2024 & 2032
- Figure 25: North America Drug of Abuse Testing Industry Revenue Share (%), by Product Type 2024 & 2032
- Figure 26: North America Drug of Abuse Testing Industry Volume Share (%), by Product Type 2024 & 2032
- Figure 27: North America Drug of Abuse Testing Industry Revenue (Million), by Sample Type 2024 & 2032
- Figure 28: North America Drug of Abuse Testing Industry Volume (K Unit), by Sample Type 2024 & 2032
- Figure 29: North America Drug of Abuse Testing Industry Revenue Share (%), by Sample Type 2024 & 2032
- Figure 30: North America Drug of Abuse Testing Industry Volume Share (%), by Sample Type 2024 & 2032
- Figure 31: North America Drug of Abuse Testing Industry Revenue (Million), by End User 2024 & 2032
- Figure 32: North America Drug of Abuse Testing Industry Volume (K Unit), by End User 2024 & 2032
- Figure 33: North America Drug of Abuse Testing Industry Revenue Share (%), by End User 2024 & 2032
- Figure 34: North America Drug of Abuse Testing Industry Volume Share (%), by End User 2024 & 2032
- Figure 35: North America Drug of Abuse Testing Industry Revenue (Million), by Country 2024 & 2032
- Figure 36: North America Drug of Abuse Testing Industry Volume (K Unit), by Country 2024 & 2032
- Figure 37: North America Drug of Abuse Testing Industry Revenue Share (%), by Country 2024 & 2032
- Figure 38: North America Drug of Abuse Testing Industry Volume Share (%), by Country 2024 & 2032
- Figure 39: Europe Drug of Abuse Testing Industry Revenue (Million), by Product Type 2024 & 2032
- Figure 40: Europe Drug of Abuse Testing Industry Volume (K Unit), by Product Type 2024 & 2032
- Figure 41: Europe Drug of Abuse Testing Industry Revenue Share (%), by Product Type 2024 & 2032
- Figure 42: Europe Drug of Abuse Testing Industry Volume Share (%), by Product Type 2024 & 2032
- Figure 43: Europe Drug of Abuse Testing Industry Revenue (Million), by Sample Type 2024 & 2032
- Figure 44: Europe Drug of Abuse Testing Industry Volume (K Unit), by Sample Type 2024 & 2032
- Figure 45: Europe Drug of Abuse Testing Industry Revenue Share (%), by Sample Type 2024 & 2032
- Figure 46: Europe Drug of Abuse Testing Industry Volume Share (%), by Sample Type 2024 & 2032
- Figure 47: Europe Drug of Abuse Testing Industry Revenue (Million), by End User 2024 & 2032
- Figure 48: Europe Drug of Abuse Testing Industry Volume (K Unit), by End User 2024 & 2032
- Figure 49: Europe Drug of Abuse Testing Industry Revenue Share (%), by End User 2024 & 2032
- Figure 50: Europe Drug of Abuse Testing Industry Volume Share (%), by End User 2024 & 2032
- Figure 51: Europe Drug of Abuse Testing Industry Revenue (Million), by Country 2024 & 2032
- Figure 52: Europe Drug of Abuse Testing Industry Volume (K Unit), by Country 2024 & 2032
- Figure 53: Europe Drug of Abuse Testing Industry Revenue Share (%), by Country 2024 & 2032
- Figure 54: Europe Drug of Abuse Testing Industry Volume Share (%), by Country 2024 & 2032
- Figure 55: Asia Pacific Drug of Abuse Testing Industry Revenue (Million), by Product Type 2024 & 2032
- Figure 56: Asia Pacific Drug of Abuse Testing Industry Volume (K Unit), by Product Type 2024 & 2032
- Figure 57: Asia Pacific Drug of Abuse Testing Industry Revenue Share (%), by Product Type 2024 & 2032
- Figure 58: Asia Pacific Drug of Abuse Testing Industry Volume Share (%), by Product Type 2024 & 2032
- Figure 59: Asia Pacific Drug of Abuse Testing Industry Revenue (Million), by Sample Type 2024 & 2032
- Figure 60: Asia Pacific Drug of Abuse Testing Industry Volume (K Unit), by Sample Type 2024 & 2032
- Figure 61: Asia Pacific Drug of Abuse Testing Industry Revenue Share (%), by Sample Type 2024 & 2032
- Figure 62: Asia Pacific Drug of Abuse Testing Industry Volume Share (%), by Sample Type 2024 & 2032
- Figure 63: Asia Pacific Drug of Abuse Testing Industry Revenue (Million), by End User 2024 & 2032
- Figure 64: Asia Pacific Drug of Abuse Testing Industry Volume (K Unit), by End User 2024 & 2032
- Figure 65: Asia Pacific Drug of Abuse Testing Industry Revenue Share (%), by End User 2024 & 2032
- Figure 66: Asia Pacific Drug of Abuse Testing Industry Volume Share (%), by End User 2024 & 2032
- Figure 67: Asia Pacific Drug of Abuse Testing Industry Revenue (Million), by Country 2024 & 2032
- Figure 68: Asia Pacific Drug of Abuse Testing Industry Volume (K Unit), by Country 2024 & 2032
- Figure 69: Asia Pacific Drug of Abuse Testing Industry Revenue Share (%), by Country 2024 & 2032
- Figure 70: Asia Pacific Drug of Abuse Testing Industry Volume Share (%), by Country 2024 & 2032
- Figure 71: Middle East and Africa Drug of Abuse Testing Industry Revenue (Million), by Product Type 2024 & 2032
- Figure 72: Middle East and Africa Drug of Abuse Testing Industry Volume (K Unit), by Product Type 2024 & 2032
- Figure 73: Middle East and Africa Drug of Abuse Testing Industry Revenue Share (%), by Product Type 2024 & 2032
- Figure 74: Middle East and Africa Drug of Abuse Testing Industry Volume Share (%), by Product Type 2024 & 2032
- Figure 75: Middle East and Africa Drug of Abuse Testing Industry Revenue (Million), by Sample Type 2024 & 2032
- Figure 76: Middle East and Africa Drug of Abuse Testing Industry Volume (K Unit), by Sample Type 2024 & 2032
- Figure 77: Middle East and Africa Drug of Abuse Testing Industry Revenue Share (%), by Sample Type 2024 & 2032
- Figure 78: Middle East and Africa Drug of Abuse Testing Industry Volume Share (%), by Sample Type 2024 & 2032
- Figure 79: Middle East and Africa Drug of Abuse Testing Industry Revenue (Million), by End User 2024 & 2032
- Figure 80: Middle East and Africa Drug of Abuse Testing Industry Volume (K Unit), by End User 2024 & 2032
- Figure 81: Middle East and Africa Drug of Abuse Testing Industry Revenue Share (%), by End User 2024 & 2032
- Figure 82: Middle East and Africa Drug of Abuse Testing Industry Volume Share (%), by End User 2024 & 2032
- Figure 83: Middle East and Africa Drug of Abuse Testing Industry Revenue (Million), by Country 2024 & 2032
- Figure 84: Middle East and Africa Drug of Abuse Testing Industry Volume (K Unit), by Country 2024 & 2032
- Figure 85: Middle East and Africa Drug of Abuse Testing Industry Revenue Share (%), by Country 2024 & 2032
- Figure 86: Middle East and Africa Drug of Abuse Testing Industry Volume Share (%), by Country 2024 & 2032
- Figure 87: South America Drug of Abuse Testing Industry Revenue (Million), by Product Type 2024 & 2032
- Figure 88: South America Drug of Abuse Testing Industry Volume (K Unit), by Product Type 2024 & 2032
- Figure 89: South America Drug of Abuse Testing Industry Revenue Share (%), by Product Type 2024 & 2032
- Figure 90: South America Drug of Abuse Testing Industry Volume Share (%), by Product Type 2024 & 2032
- Figure 91: South America Drug of Abuse Testing Industry Revenue (Million), by Sample Type 2024 & 2032
- Figure 92: South America Drug of Abuse Testing Industry Volume (K Unit), by Sample Type 2024 & 2032
- Figure 93: South America Drug of Abuse Testing Industry Revenue Share (%), by Sample Type 2024 & 2032
- Figure 94: South America Drug of Abuse Testing Industry Volume Share (%), by Sample Type 2024 & 2032
- Figure 95: South America Drug of Abuse Testing Industry Revenue (Million), by End User 2024 & 2032
- Figure 96: South America Drug of Abuse Testing Industry Volume (K Unit), by End User 2024 & 2032
- Figure 97: South America Drug of Abuse Testing Industry Revenue Share (%), by End User 2024 & 2032
- Figure 98: South America Drug of Abuse Testing Industry Volume Share (%), by End User 2024 & 2032
- Figure 99: South America Drug of Abuse Testing Industry Revenue (Million), by Country 2024 & 2032
- Figure 100: South America Drug of Abuse Testing Industry Volume (K Unit), by Country 2024 & 2032
- Figure 101: South America Drug of Abuse Testing Industry Revenue Share (%), by Country 2024 & 2032
- Figure 102: South America Drug of Abuse Testing Industry Volume Share (%), by Country 2024 & 2032
List of Tables
- Table 1: Global Drug of Abuse Testing Industry Revenue Million Forecast, by Region 2019 & 2032
- Table 2: Global Drug of Abuse Testing Industry Volume K Unit Forecast, by Region 2019 & 2032
- Table 3: Global Drug of Abuse Testing Industry Revenue Million Forecast, by Product Type 2019 & 2032
- Table 4: Global Drug of Abuse Testing Industry Volume K Unit Forecast, by Product Type 2019 & 2032
- Table 5: Global Drug of Abuse Testing Industry Revenue Million Forecast, by Sample Type 2019 & 2032
- Table 6: Global Drug of Abuse Testing Industry Volume K Unit Forecast, by Sample Type 2019 & 2032
- Table 7: Global Drug of Abuse Testing Industry Revenue Million Forecast, by End User 2019 & 2032
- Table 8: Global Drug of Abuse Testing Industry Volume K Unit Forecast, by End User 2019 & 2032
- Table 9: Global Drug of Abuse Testing Industry Revenue Million Forecast, by Region 2019 & 2032
- Table 10: Global Drug of Abuse Testing Industry Volume K Unit Forecast, by Region 2019 & 2032
- Table 11: Global Drug of Abuse Testing Industry Revenue Million Forecast, by Country 2019 & 2032
- Table 12: Global Drug of Abuse Testing Industry Volume K Unit Forecast, by Country 2019 & 2032
- Table 13: United States Drug of Abuse Testing Industry Revenue (Million) Forecast, by Application 2019 & 2032
- Table 14: United States Drug of Abuse Testing Industry Volume (K Unit) Forecast, by Application 2019 & 2032
- Table 15: Canada Drug of Abuse Testing Industry Revenue (Million) Forecast, by Application 2019 & 2032
- Table 16: Canada Drug of Abuse Testing Industry Volume (K Unit) Forecast, by Application 2019 & 2032
- Table 17: Mexico Drug of Abuse Testing Industry Revenue (Million) Forecast, by Application 2019 & 2032
- Table 18: Mexico Drug of Abuse Testing Industry Volume (K Unit) Forecast, by Application 2019 & 2032
- Table 19: Global Drug of Abuse Testing Industry Revenue Million Forecast, by Country 2019 & 2032
- Table 20: Global Drug of Abuse Testing Industry Volume K Unit Forecast, by Country 2019 & 2032
- Table 21: Germany Drug of Abuse Testing Industry Revenue (Million) Forecast, by Application 2019 & 2032
- Table 22: Germany Drug of Abuse Testing Industry Volume (K Unit) Forecast, by Application 2019 & 2032
- Table 23: United Kingdom Drug of Abuse Testing Industry Revenue (Million) Forecast, by Application 2019 & 2032
- Table 24: United Kingdom Drug of Abuse Testing Industry Volume (K Unit) Forecast, by Application 2019 & 2032
- Table 25: France Drug of Abuse Testing Industry Revenue (Million) Forecast, by Application 2019 & 2032
- Table 26: France Drug of Abuse Testing Industry Volume (K Unit) Forecast, by Application 2019 & 2032
- Table 27: Italy Drug of Abuse Testing Industry Revenue (Million) Forecast, by Application 2019 & 2032
- Table 28: Italy Drug of Abuse Testing Industry Volume (K Unit) Forecast, by Application 2019 & 2032
- Table 29: Spain Drug of Abuse Testing Industry Revenue (Million) Forecast, by Application 2019 & 2032
- Table 30: Spain Drug of Abuse Testing Industry Volume (K Unit) Forecast, by Application 2019 & 2032
- Table 31: Rest of Europe Drug of Abuse Testing Industry Revenue (Million) Forecast, by Application 2019 & 2032
- Table 32: Rest of Europe Drug of Abuse Testing Industry Volume (K Unit) Forecast, by Application 2019 & 2032
- Table 33: Global Drug of Abuse Testing Industry Revenue Million Forecast, by Country 2019 & 2032
- Table 34: Global Drug of Abuse Testing Industry Volume K Unit Forecast, by Country 2019 & 2032
- Table 35: China Drug of Abuse Testing Industry Revenue (Million) Forecast, by Application 2019 & 2032
- Table 36: China Drug of Abuse Testing Industry Volume (K Unit) Forecast, by Application 2019 & 2032
- Table 37: Japan Drug of Abuse Testing Industry Revenue (Million) Forecast, by Application 2019 & 2032
- Table 38: Japan Drug of Abuse Testing Industry Volume (K Unit) Forecast, by Application 2019 & 2032
- Table 39: India Drug of Abuse Testing Industry Revenue (Million) Forecast, by Application 2019 & 2032
- Table 40: India Drug of Abuse Testing Industry Volume (K Unit) Forecast, by Application 2019 & 2032
- Table 41: Australia Drug of Abuse Testing Industry Revenue (Million) Forecast, by Application 2019 & 2032
- Table 42: Australia Drug of Abuse Testing Industry Volume (K Unit) Forecast, by Application 2019 & 2032
- Table 43: South Korea Drug of Abuse Testing Industry Revenue (Million) Forecast, by Application 2019 & 2032
- Table 44: South Korea Drug of Abuse Testing Industry Volume (K Unit) Forecast, by Application 2019 & 2032
- Table 45: Rest of Asia Pacific Drug of Abuse Testing Industry Revenue (Million) Forecast, by Application 2019 & 2032
- Table 46: Rest of Asia Pacific Drug of Abuse Testing Industry Volume (K Unit) Forecast, by Application 2019 & 2032
- Table 47: Global Drug of Abuse Testing Industry Revenue Million Forecast, by Country 2019 & 2032
- Table 48: Global Drug of Abuse Testing Industry Volume K Unit Forecast, by Country 2019 & 2032
- Table 49: GCC Drug of Abuse Testing Industry Revenue (Million) Forecast, by Application 2019 & 2032
- Table 50: GCC Drug of Abuse Testing Industry Volume (K Unit) Forecast, by Application 2019 & 2032
- Table 51: South Africa Drug of Abuse Testing Industry Revenue (Million) Forecast, by Application 2019 & 2032
- Table 52: South Africa Drug of Abuse Testing Industry Volume (K Unit) Forecast, by Application 2019 & 2032
- Table 53: Rest of Middle East and Africa Drug of Abuse Testing Industry Revenue (Million) Forecast, by Application 2019 & 2032
- Table 54: Rest of Middle East and Africa Drug of Abuse Testing Industry Volume (K Unit) Forecast, by Application 2019 & 2032
- Table 55: Global Drug of Abuse Testing Industry Revenue Million Forecast, by Country 2019 & 2032
- Table 56: Global Drug of Abuse Testing Industry Volume K Unit Forecast, by Country 2019 & 2032
- Table 57: Brazil Drug of Abuse Testing Industry Revenue (Million) Forecast, by Application 2019 & 2032
- Table 58: Brazil Drug of Abuse Testing Industry Volume (K Unit) Forecast, by Application 2019 & 2032
- Table 59: Argentina Drug of Abuse Testing Industry Revenue (Million) Forecast, by Application 2019 & 2032
- Table 60: Argentina Drug of Abuse Testing Industry Volume (K Unit) Forecast, by Application 2019 & 2032
- Table 61: Rest of South America Drug of Abuse Testing Industry Revenue (Million) Forecast, by Application 2019 & 2032
- Table 62: Rest of South America Drug of Abuse Testing Industry Volume (K Unit) Forecast, by Application 2019 & 2032
- Table 63: Global Drug of Abuse Testing Industry Revenue Million Forecast, by Product Type 2019 & 2032
- Table 64: Global Drug of Abuse Testing Industry Volume K Unit Forecast, by Product Type 2019 & 2032
- Table 65: Global Drug of Abuse Testing Industry Revenue Million Forecast, by Sample Type 2019 & 2032
- Table 66: Global Drug of Abuse Testing Industry Volume K Unit Forecast, by Sample Type 2019 & 2032
- Table 67: Global Drug of Abuse Testing Industry Revenue Million Forecast, by End User 2019 & 2032
- Table 68: Global Drug of Abuse Testing Industry Volume K Unit Forecast, by End User 2019 & 2032
- Table 69: Global Drug of Abuse Testing Industry Revenue Million Forecast, by Country 2019 & 2032
- Table 70: Global Drug of Abuse Testing Industry Volume K Unit Forecast, by Country 2019 & 2032
- Table 71: United States Drug of Abuse Testing Industry Revenue (Million) Forecast, by Application 2019 & 2032
- Table 72: United States Drug of Abuse Testing Industry Volume (K Unit) Forecast, by Application 2019 & 2032
- Table 73: Canada Drug of Abuse Testing Industry Revenue (Million) Forecast, by Application 2019 & 2032
- Table 74: Canada Drug of Abuse Testing Industry Volume (K Unit) Forecast, by Application 2019 & 2032
- Table 75: Mexico Drug of Abuse Testing Industry Revenue (Million) Forecast, by Application 2019 & 2032
- Table 76: Mexico Drug of Abuse Testing Industry Volume (K Unit) Forecast, by Application 2019 & 2032
- Table 77: Global Drug of Abuse Testing Industry Revenue Million Forecast, by Product Type 2019 & 2032
- Table 78: Global Drug of Abuse Testing Industry Volume K Unit Forecast, by Product Type 2019 & 2032
- Table 79: Global Drug of Abuse Testing Industry Revenue Million Forecast, by Sample Type 2019 & 2032
- Table 80: Global Drug of Abuse Testing Industry Volume K Unit Forecast, by Sample Type 2019 & 2032
- Table 81: Global Drug of Abuse Testing Industry Revenue Million Forecast, by End User 2019 & 2032
- Table 82: Global Drug of Abuse Testing Industry Volume K Unit Forecast, by End User 2019 & 2032
- Table 83: Global Drug of Abuse Testing Industry Revenue Million Forecast, by Country 2019 & 2032
- Table 84: Global Drug of Abuse Testing Industry Volume K Unit Forecast, by Country 2019 & 2032
- Table 85: Germany Drug of Abuse Testing Industry Revenue (Million) Forecast, by Application 2019 & 2032
- Table 86: Germany Drug of Abuse Testing Industry Volume (K Unit) Forecast, by Application 2019 & 2032
- Table 87: United Kingdom Drug of Abuse Testing Industry Revenue (Million) Forecast, by Application 2019 & 2032
- Table 88: United Kingdom Drug of Abuse Testing Industry Volume (K Unit) Forecast, by Application 2019 & 2032
- Table 89: France Drug of Abuse Testing Industry Revenue (Million) Forecast, by Application 2019 & 2032
- Table 90: France Drug of Abuse Testing Industry Volume (K Unit) Forecast, by Application 2019 & 2032
- Table 91: Italy Drug of Abuse Testing Industry Revenue (Million) Forecast, by Application 2019 & 2032
- Table 92: Italy Drug of Abuse Testing Industry Volume (K Unit) Forecast, by Application 2019 & 2032
- Table 93: Spain Drug of Abuse Testing Industry Revenue (Million) Forecast, by Application 2019 & 2032
- Table 94: Spain Drug of Abuse Testing Industry Volume (K Unit) Forecast, by Application 2019 & 2032
- Table 95: Rest of Europe Drug of Abuse Testing Industry Revenue (Million) Forecast, by Application 2019 & 2032
- Table 96: Rest of Europe Drug of Abuse Testing Industry Volume (K Unit) Forecast, by Application 2019 & 2032
- Table 97: Global Drug of Abuse Testing Industry Revenue Million Forecast, by Product Type 2019 & 2032
- Table 98: Global Drug of Abuse Testing Industry Volume K Unit Forecast, by Product Type 2019 & 2032
- Table 99: Global Drug of Abuse Testing Industry Revenue Million Forecast, by Sample Type 2019 & 2032
- Table 100: Global Drug of Abuse Testing Industry Volume K Unit Forecast, by Sample Type 2019 & 2032
- Table 101: Global Drug of Abuse Testing Industry Revenue Million Forecast, by End User 2019 & 2032
- Table 102: Global Drug of Abuse Testing Industry Volume K Unit Forecast, by End User 2019 & 2032
- Table 103: Global Drug of Abuse Testing Industry Revenue Million Forecast, by Country 2019 & 2032
- Table 104: Global Drug of Abuse Testing Industry Volume K Unit Forecast, by Country 2019 & 2032
- Table 105: China Drug of Abuse Testing Industry Revenue (Million) Forecast, by Application 2019 & 2032
- Table 106: China Drug of Abuse Testing Industry Volume (K Unit) Forecast, by Application 2019 & 2032
- Table 107: Japan Drug of Abuse Testing Industry Revenue (Million) Forecast, by Application 2019 & 2032
- Table 108: Japan Drug of Abuse Testing Industry Volume (K Unit) Forecast, by Application 2019 & 2032
- Table 109: India Drug of Abuse Testing Industry Revenue (Million) Forecast, by Application 2019 & 2032
- Table 110: India Drug of Abuse Testing Industry Volume (K Unit) Forecast, by Application 2019 & 2032
- Table 111: Australia Drug of Abuse Testing Industry Revenue (Million) Forecast, by Application 2019 & 2032
- Table 112: Australia Drug of Abuse Testing Industry Volume (K Unit) Forecast, by Application 2019 & 2032
- Table 113: South Korea Drug of Abuse Testing Industry Revenue (Million) Forecast, by Application 2019 & 2032
- Table 114: South Korea Drug of Abuse Testing Industry Volume (K Unit) Forecast, by Application 2019 & 2032
- Table 115: Rest of Asia Pacific Drug of Abuse Testing Industry Revenue (Million) Forecast, by Application 2019 & 2032
- Table 116: Rest of Asia Pacific Drug of Abuse Testing Industry Volume (K Unit) Forecast, by Application 2019 & 2032
- Table 117: Global Drug of Abuse Testing Industry Revenue Million Forecast, by Product Type 2019 & 2032
- Table 118: Global Drug of Abuse Testing Industry Volume K Unit Forecast, by Product Type 2019 & 2032
- Table 119: Global Drug of Abuse Testing Industry Revenue Million Forecast, by Sample Type 2019 & 2032
- Table 120: Global Drug of Abuse Testing Industry Volume K Unit Forecast, by Sample Type 2019 & 2032
- Table 121: Global Drug of Abuse Testing Industry Revenue Million Forecast, by End User 2019 & 2032
- Table 122: Global Drug of Abuse Testing Industry Volume K Unit Forecast, by End User 2019 & 2032
- Table 123: Global Drug of Abuse Testing Industry Revenue Million Forecast, by Country 2019 & 2032
- Table 124: Global Drug of Abuse Testing Industry Volume K Unit Forecast, by Country 2019 & 2032
- Table 125: GCC Drug of Abuse Testing Industry Revenue (Million) Forecast, by Application 2019 & 2032
- Table 126: GCC Drug of Abuse Testing Industry Volume (K Unit) Forecast, by Application 2019 & 2032
- Table 127: South Africa Drug of Abuse Testing Industry Revenue (Million) Forecast, by Application 2019 & 2032
- Table 128: South Africa Drug of Abuse Testing Industry Volume (K Unit) Forecast, by Application 2019 & 2032
- Table 129: Rest of Middle East and Africa Drug of Abuse Testing Industry Revenue (Million) Forecast, by Application 2019 & 2032
- Table 130: Rest of Middle East and Africa Drug of Abuse Testing Industry Volume (K Unit) Forecast, by Application 2019 & 2032
- Table 131: Global Drug of Abuse Testing Industry Revenue Million Forecast, by Product Type 2019 & 2032
- Table 132: Global Drug of Abuse Testing Industry Volume K Unit Forecast, by Product Type 2019 & 2032
- Table 133: Global Drug of Abuse Testing Industry Revenue Million Forecast, by Sample Type 2019 & 2032
- Table 134: Global Drug of Abuse Testing Industry Volume K Unit Forecast, by Sample Type 2019 & 2032
- Table 135: Global Drug of Abuse Testing Industry Revenue Million Forecast, by End User 2019 & 2032
- Table 136: Global Drug of Abuse Testing Industry Volume K Unit Forecast, by End User 2019 & 2032
- Table 137: Global Drug of Abuse Testing Industry Revenue Million Forecast, by Country 2019 & 2032
- Table 138: Global Drug of Abuse Testing Industry Volume K Unit Forecast, by Country 2019 & 2032
- Table 139: Brazil Drug of Abuse Testing Industry Revenue (Million) Forecast, by Application 2019 & 2032
- Table 140: Brazil Drug of Abuse Testing Industry Volume (K Unit) Forecast, by Application 2019 & 2032
- Table 141: Argentina Drug of Abuse Testing Industry Revenue (Million) Forecast, by Application 2019 & 2032
- Table 142: Argentina Drug of Abuse Testing Industry Volume (K Unit) Forecast, by Application 2019 & 2032
- Table 143: Rest of South America Drug of Abuse Testing Industry Revenue (Million) Forecast, by Application 2019 & 2032
- Table 144: Rest of South America Drug of Abuse Testing Industry Volume (K Unit) Forecast, by Application 2019 & 2032
Frequently Asked Questions
1. What is the projected Compound Annual Growth Rate (CAGR) of the Drug of Abuse Testing Industry?
The projected CAGR is approximately 7.50%.
2. Which companies are prominent players in the Drug of Abuse Testing Industry?
Key companies in the market include Randox Testing Services, Quest Diagnostics Inc, F Hoffmann-La Roche Ltd, Omega Laboratories Inc, Thermo Fisher Scientific Inc, Abbott Laboratories, Psychemedics Corporation, Cordant Health Solutions, Siemens Healthineers AG, Clinical Reference Laboratory Inc, United States Drug Testing Laboratories Inc (USDTL), Dragerwerk AG & Co KGaA, Danaher Corporation (Beckman Coulter), Precision Diagnostics, LabCorp.
3. What are the main segments of the Drug of Abuse Testing Industry?
The market segments include Product Type, Sample Type, End User.
4. Can you provide details about the market size?
The market size is estimated to be USD XX Million as of 2022.
5. What are some drivers contributing to market growth?
Increasing Demand for Drug Abuse Treatment; Stringent Law Mandating Alcohol and Drug Testing; Rising Drug-related Mortality and Increasing Government Initiatives.
6. What are the notable trends driving market growth?
The Urine Segment is Expected to Dominate in the Market Over the Forecast Period.
7. Are there any restraints impacting market growth?
Perception of Drug Abuse Testing as a Violation of Rights; Lack of Awareness Regarding the Availability of Advanced Drug Testing Devices.
8. Can you provide examples of recent developments in the market?
In August 2022, the Delaware Division of Public Health began including fentanyl strips in Narcan kits for distribution to the public. The effort was a part of a harm-reduction strategy aimed at preventing accidental overdoses due to fentanyl consumption.
9. What pricing options are available for accessing the report?
Pricing options include single-user, multi-user, and enterprise licenses priced at USD 4750, USD 5250, and USD 8750 respectively.
10. Is the market size provided in terms of value or volume?
The market size is provided in terms of value, measured in Million and volume, measured in K Unit.
11. Are there any specific market keywords associated with the report?
Yes, the market keyword associated with the report is "Drug of Abuse Testing Industry," which aids in identifying and referencing the specific market segment covered.
12. How do I determine which pricing option suits my needs best?
The pricing options vary based on user requirements and access needs. Individual users may opt for single-user licenses, while businesses requiring broader access may choose multi-user or enterprise licenses for cost-effective access to the report.
13. Are there any additional resources or data provided in the Drug of Abuse Testing Industry report?
While the report offers comprehensive insights, it's advisable to review the specific contents or supplementary materials provided to ascertain if additional resources or data are available.
14. How can I stay updated on further developments or reports in the Drug of Abuse Testing Industry?
To stay informed about further developments, trends, and reports in the Drug of Abuse Testing Industry, consider subscribing to industry newsletters, following relevant companies and organizations, or regularly checking reputable industry news sources and publications.
Methodology
Step 1 - Identification of Relevant Samples Size from Population Database


Step 2 - Approaches for Defining Global Market Size (Value, Volume* & Price*)

Note*: In applicable scenarios
Step 3 - Data Sources
Primary Research
- Web Analytics
- Survey Reports
- Research Institute
- Latest Research Reports
- Opinion Leaders
Secondary Research
- Annual Reports
- White Paper
- Latest Press Release
- Industry Association
- Paid Database
- Investor Presentations

Step 4 - Data Triangulation
Involves using different sources of information in order to increase the validity of a study
These sources are likely to be stakeholders in a program - participants, other researchers, program staff, other community members, and so on.
Then we put all data in single framework & apply various statistical tools to find out the dynamic on the market.
During the analysis stage, feedback from the stakeholder groups would be compared to determine areas of agreement as well as areas of divergence


