
Key Insights
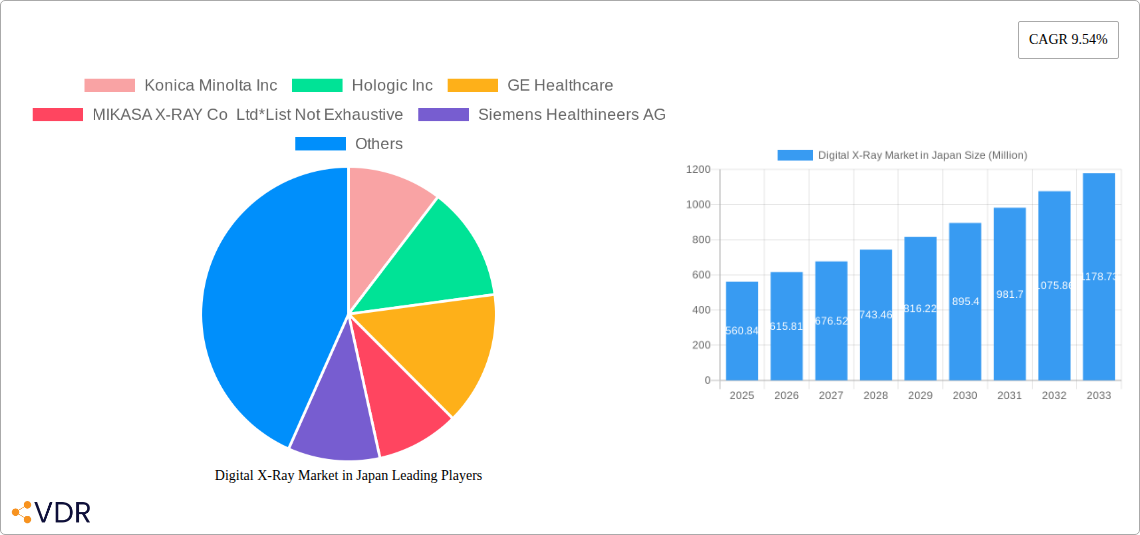
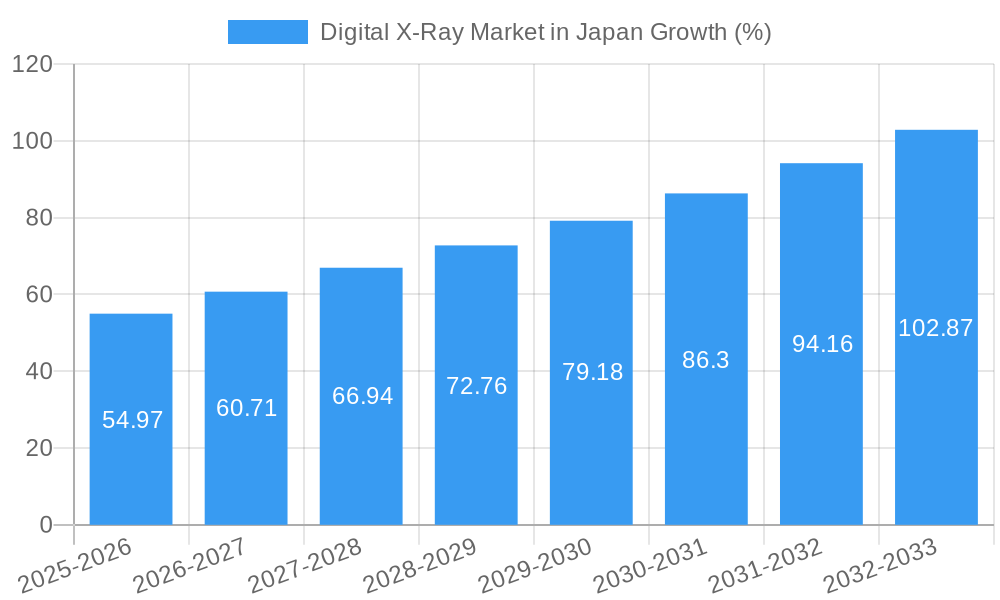
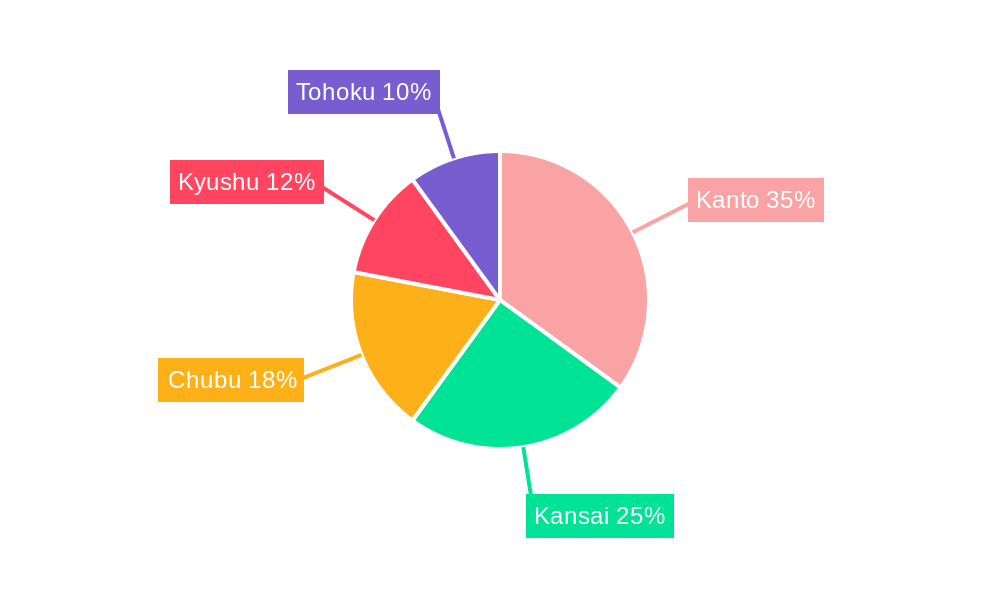
The Japanese digital X-ray market, valued at $560.84 million in 2025, is projected to experience robust growth, driven by factors such as an aging population increasing demand for diagnostic imaging, advancements in digital X-ray technology offering superior image quality and efficiency, and rising healthcare expenditure in the country. The market's Compound Annual Growth Rate (CAGR) of 9.54% from 2025 to 2033 indicates substantial expansion. Key market segments include orthopedic, cancer, and cardiovascular applications, with computed radiography and direct radiography technologies dominating. Hospitals and diagnostic centers constitute the primary end-users. Leading companies like Fujifilm, Canon Medical Systems, and Shimadzu, with their strong domestic presence and technological advancements, are key players in shaping the market landscape. The regional distribution within Japan reveals strong demand across major regions like Kanto, Kansai, and Chubu, reflecting the concentration of healthcare infrastructure and population density. Further growth will likely be fueled by government initiatives to improve healthcare access and technological innovations that enhance portability and reduce radiation exposure.
Growth within the Japanese digital X-ray market is expected to continue its upward trajectory, driven by continuous improvements in image processing algorithms leading to faster diagnosis, reduced patient discomfort, and cost-effectiveness. The increasing adoption of portable systems enables efficient point-of-care diagnostics, benefitting both urban and rural healthcare settings. The integration of artificial intelligence (AI) in image analysis is poised to further elevate diagnostic accuracy and streamline workflows. However, high initial investment costs for advanced systems and the need for skilled technicians could pose challenges. Nevertheless, the overall market outlook remains positive, with ongoing technological advancements and supportive government policies strengthening the trajectory of growth and adoption throughout the forecast period.
Digital X-Ray Market in Japan: A Comprehensive Report (2019-2033)
This in-depth report provides a comprehensive analysis of the Digital X-Ray market in Japan, covering market dynamics, growth trends, key players, and future outlook. The study period spans from 2019 to 2033, with 2025 serving as the base and estimated year. The report offers invaluable insights for industry professionals, investors, and stakeholders seeking to understand and capitalize on opportunities within this dynamic sector. Market values are presented in million units.
Digital X-Ray Market in Japan: Market Dynamics & Structure
The Japanese digital X-ray market is characterized by a moderately concentrated landscape with key players such as Konica Minolta Inc, Hologic Inc, GE Healthcare, MIKASA X-RAY Co Ltd, Siemens Healthineers AG, Canon (Canon Medical Systems Corporation), Carestream Health, Koninklijke Philips NV, Shimadzu Corporation, and Fujifilm Holdings Corporation holding significant market share. The market exhibits robust growth driven by technological advancements, increasing prevalence of chronic diseases, and government initiatives promoting healthcare infrastructure development. However, high initial investment costs and stringent regulatory approvals pose challenges. The market structure is evolving due to strategic mergers and acquisitions (M&A) activities, with xx M&A deals recorded between 2019 and 2024.
- Market Concentration: Moderately concentrated, with top 10 players holding approximately xx% market share in 2024.
- Technological Innovation: Continuous development of Direct Radiography (DR) and Computed Radiography (CR) systems, driving improved image quality and reduced radiation exposure.
- Regulatory Framework: Stringent regulatory approvals and compliance requirements influencing market entry and product development.
- Competitive Substitutes: Limited direct substitutes, with the primary competition stemming from advancements in other medical imaging modalities like ultrasound and MRI.
- End-User Demographics: Aging population and rising incidence of chronic diseases significantly influence market demand, primarily concentrated in hospitals and diagnostic centers.
- M&A Trends: Consolidation expected to continue, driven by the need for enhanced technological capabilities and expanded market reach.
Digital X-Ray Market in Japan: Growth Trends & Insights
The Japanese digital X-ray market witnessed significant growth during the historical period (2019-2024), expanding from xx million units in 2019 to xx million units in 2024, exhibiting a CAGR of xx%. This growth is primarily attributed to the increasing adoption of advanced digital X-ray technologies in hospitals and diagnostic centers across the country. The market is expected to continue its upward trajectory during the forecast period (2025-2033), driven by factors such as technological advancements, rising healthcare expenditure, and government initiatives. The market is projected to reach xx million units by 2033, with a forecasted CAGR of xx%. Market penetration is currently at approximately xx% in 2025 and is expected to reach xx% by 2033. Technological disruptions, particularly the introduction of AI-powered image analysis tools, are accelerating market growth.
Dominant Regions, Countries, or Segments in Digital X-Ray Market in Japan
The Japanese digital X-ray market shows robust growth across various segments. However, the Hospitals segment within the End User category dominates, accounting for xx% of the market share in 2025. Within Applications, Orthopedic and Cancer applications drive substantial demand, fueled by the aging population and increasing prevalence of related diseases. In terms of Technology, Direct Radiography (DR) holds a larger market share compared to Computed Radiography (CR) due to superior image quality and efficiency. Finally, Fixed Systems within the Portability segment constitute the majority of the market due to the high demand from hospitals.
- Key Drivers:
- Increasing prevalence of chronic diseases like cancer and orthopedic conditions.
- Rising healthcare expenditure and insurance coverage.
- Government initiatives supporting healthcare infrastructure development.
- Technological advancements leading to improved image quality and efficiency.
- Dominance Factors:
- High concentration of hospitals and diagnostic centers in urban areas.
- Favorable government policies and reimbursement schemes.
- Strong presence of established and emerging players.
Digital X-Ray Market in Japan: Product Landscape
The digital X-ray market in Japan offers a diverse range of products, encompassing fixed and portable systems with varying levels of sophistication. Recent innovations focus on improving image quality through advanced detectors and algorithms, enhancing workflow efficiency with automated processes, and minimizing radiation exposure. Unique selling propositions often include features like advanced image processing, AI-powered analysis capabilities, and ergonomic design. Technological advancements include the integration of photon-counting CT technology, enhancing diagnostic capabilities.
Key Drivers, Barriers & Challenges in Digital X-Ray Market in Japan
Key Drivers: The market is driven by rising prevalence of chronic diseases necessitating advanced diagnostic tools, increasing government investments in healthcare infrastructure, and ongoing technological improvements leading to better image quality and reduced radiation exposure.
Key Challenges: High initial investment costs associated with purchasing and implementing digital X-ray systems pose a significant barrier. Stringent regulatory requirements for medical device approvals and compliance add complexity and delay market entry. Competitive pressures from established players and new entrants create challenges for market penetration. Supply chain disruptions can impact product availability and pricing.
Emerging Opportunities in Digital X-Ray Market in Japan
Emerging opportunities reside in the growing adoption of AI-powered image analysis tools for improved diagnostic accuracy and efficiency. There's untapped potential in expanding into smaller clinics and rural healthcare settings with portable and cost-effective systems. The development of specialized applications tailored to specific diseases (e.g., AI-assisted detection of early-stage lung cancer) also presents a lucrative opportunity.
Growth Accelerators in the Digital X-Ray Market in Japan Industry
Long-term growth will be accelerated by strategic partnerships between manufacturers and healthcare providers to enhance product adoption and improve service delivery. Technological advancements like AI-powered image analysis and improved detector technology will drive efficiency and quality. Expansion into untapped markets like smaller clinics and rural healthcare centers will also fuel growth.
Key Players Shaping the Digital X-Ray Market in Japan Market
- Konica Minolta Inc
- Hologic Inc
- GE Healthcare
- MIKASA X-RAY Co Ltd
- Siemens Healthineers AG
- Canon (Canon Medical Systems Corporation)
- Carestream Health
- Koninklijke Philips NV
- Shimadzu Corporation
- Fujifilm Holdings Corporation
Notable Milestones in Digital X-Ray Market in Japan Sector
- June 2022: Konica Minolta, Inc. launched DDRAtlas Ver. 1.0, a dynamic digital radiography atlas, demonstrating commitment to innovation in diagnostic imaging.
- April 2023: Canon Inc., Canon Medical Systems Corporation, and the National Cancer Center Japan initiated clinical research using a next-generation X-ray CT system with photon-counting CT (PCCT), signaling advancements in cancer diagnostics.
In-Depth Digital X-Ray Market in Japan Market Outlook
The future of the Japanese digital X-ray market is promising, driven by continuous technological advancements, expanding healthcare infrastructure, and a growing demand for improved diagnostic capabilities. Strategic partnerships, innovations in AI-powered image analysis, and the development of specialized applications will further fuel market growth. The market presents significant opportunities for companies focused on innovation, efficiency, and patient-centric solutions.
Digital X-Ray Market in Japan Segmentation
-
1. Application
- 1.1. Orthopedic
- 1.2. Cancer
- 1.3. Dental
- 1.4. Cardiovascular
- 1.5. Other Applications
-
2. Technology
- 2.1. Computed Radiography
- 2.2. Direct Radiography
-
3. Portability
- 3.1. Fixed Systems
- 3.2. Portable Systems
-
4. End User
- 4.1. Hospitals
- 4.2. Diagnostic Centers
- 4.3. Other End Users
Digital X-Ray Market in Japan Segmentation By Geography
-
1. North America
- 1.1. United States
- 1.2. Canada
- 1.3. Mexico
-
2. South America
- 2.1. Brazil
- 2.2. Argentina
- 2.3. Rest of South America
-
3. Europe
- 3.1. United Kingdom
- 3.2. Germany
- 3.3. France
- 3.4. Italy
- 3.5. Spain
- 3.6. Russia
- 3.7. Benelux
- 3.8. Nordics
- 3.9. Rest of Europe
-
4. Middle East & Africa
- 4.1. Turkey
- 4.2. Israel
- 4.3. GCC
- 4.4. North Africa
- 4.5. South Africa
- 4.6. Rest of Middle East & Africa
-
5. Asia Pacific
- 5.1. China
- 5.2. India
- 5.3. Japan
- 5.4. South Korea
- 5.5. ASEAN
- 5.6. Oceania
- 5.7. Rest of Asia Pacific
Digital X-Ray Market in Japan REPORT HIGHLIGHTS
| Aspects | Details |
|---|---|
| Study Period | 2019-2033 |
| Base Year | 2024 |
| Estimated Year | 2025 |
| Forecast Period | 2025-2033 |
| Historical Period | 2019-2024 |
| Growth Rate | CAGR of 9.54% from 2019-2033 |
| Segmentation |
|
Table of Contents
- 1. Introduction
- 1.1. Research Scope
- 1.2. Market Segmentation
- 1.3. Research Methodology
- 1.4. Definitions and Assumptions
- 2. Executive Summary
- 2.1. Introduction
- 3. Market Dynamics
- 3.1. Introduction
- 3.2. Market Drivers
- 3.2.1. Increasing Prevalence of Chronic Diseases; Increasing Technological Advancements
- 3.3. Market Restrains
- 3.3.1. High Cost of Equipment
- 3.4. Market Trends
- 3.4.1. Cancer Segment is Expected to Hold a Significant Market Share Over the Forecast Period
- 4. Market Factor Analysis
- 4.1. Porters Five Forces
- 4.2. Supply/Value Chain
- 4.3. PESTEL analysis
- 4.4. Market Entropy
- 4.5. Patent/Trademark Analysis
- 5. Global Digital X-Ray Market in Japan Analysis, Insights and Forecast, 2019-2031
- 5.1. Market Analysis, Insights and Forecast - by Application
- 5.1.1. Orthopedic
- 5.1.2. Cancer
- 5.1.3. Dental
- 5.1.4. Cardiovascular
- 5.1.5. Other Applications
- 5.2. Market Analysis, Insights and Forecast - by Technology
- 5.2.1. Computed Radiography
- 5.2.2. Direct Radiography
- 5.3. Market Analysis, Insights and Forecast - by Portability
- 5.3.1. Fixed Systems
- 5.3.2. Portable Systems
- 5.4. Market Analysis, Insights and Forecast - by End User
- 5.4.1. Hospitals
- 5.4.2. Diagnostic Centers
- 5.4.3. Other End Users
- 5.5. Market Analysis, Insights and Forecast - by Region
- 5.5.1. North America
- 5.5.2. South America
- 5.5.3. Europe
- 5.5.4. Middle East & Africa
- 5.5.5. Asia Pacific
- 5.1. Market Analysis, Insights and Forecast - by Application
- 6. North America Digital X-Ray Market in Japan Analysis, Insights and Forecast, 2019-2031
- 6.1. Market Analysis, Insights and Forecast - by Application
- 6.1.1. Orthopedic
- 6.1.2. Cancer
- 6.1.3. Dental
- 6.1.4. Cardiovascular
- 6.1.5. Other Applications
- 6.2. Market Analysis, Insights and Forecast - by Technology
- 6.2.1. Computed Radiography
- 6.2.2. Direct Radiography
- 6.3. Market Analysis, Insights and Forecast - by Portability
- 6.3.1. Fixed Systems
- 6.3.2. Portable Systems
- 6.4. Market Analysis, Insights and Forecast - by End User
- 6.4.1. Hospitals
- 6.4.2. Diagnostic Centers
- 6.4.3. Other End Users
- 6.1. Market Analysis, Insights and Forecast - by Application
- 7. South America Digital X-Ray Market in Japan Analysis, Insights and Forecast, 2019-2031
- 7.1. Market Analysis, Insights and Forecast - by Application
- 7.1.1. Orthopedic
- 7.1.2. Cancer
- 7.1.3. Dental
- 7.1.4. Cardiovascular
- 7.1.5. Other Applications
- 7.2. Market Analysis, Insights and Forecast - by Technology
- 7.2.1. Computed Radiography
- 7.2.2. Direct Radiography
- 7.3. Market Analysis, Insights and Forecast - by Portability
- 7.3.1. Fixed Systems
- 7.3.2. Portable Systems
- 7.4. Market Analysis, Insights and Forecast - by End User
- 7.4.1. Hospitals
- 7.4.2. Diagnostic Centers
- 7.4.3. Other End Users
- 7.1. Market Analysis, Insights and Forecast - by Application
- 8. Europe Digital X-Ray Market in Japan Analysis, Insights and Forecast, 2019-2031
- 8.1. Market Analysis, Insights and Forecast - by Application
- 8.1.1. Orthopedic
- 8.1.2. Cancer
- 8.1.3. Dental
- 8.1.4. Cardiovascular
- 8.1.5. Other Applications
- 8.2. Market Analysis, Insights and Forecast - by Technology
- 8.2.1. Computed Radiography
- 8.2.2. Direct Radiography
- 8.3. Market Analysis, Insights and Forecast - by Portability
- 8.3.1. Fixed Systems
- 8.3.2. Portable Systems
- 8.4. Market Analysis, Insights and Forecast - by End User
- 8.4.1. Hospitals
- 8.4.2. Diagnostic Centers
- 8.4.3. Other End Users
- 8.1. Market Analysis, Insights and Forecast - by Application
- 9. Middle East & Africa Digital X-Ray Market in Japan Analysis, Insights and Forecast, 2019-2031
- 9.1. Market Analysis, Insights and Forecast - by Application
- 9.1.1. Orthopedic
- 9.1.2. Cancer
- 9.1.3. Dental
- 9.1.4. Cardiovascular
- 9.1.5. Other Applications
- 9.2. Market Analysis, Insights and Forecast - by Technology
- 9.2.1. Computed Radiography
- 9.2.2. Direct Radiography
- 9.3. Market Analysis, Insights and Forecast - by Portability
- 9.3.1. Fixed Systems
- 9.3.2. Portable Systems
- 9.4. Market Analysis, Insights and Forecast - by End User
- 9.4.1. Hospitals
- 9.4.2. Diagnostic Centers
- 9.4.3. Other End Users
- 9.1. Market Analysis, Insights and Forecast - by Application
- 10. Asia Pacific Digital X-Ray Market in Japan Analysis, Insights and Forecast, 2019-2031
- 10.1. Market Analysis, Insights and Forecast - by Application
- 10.1.1. Orthopedic
- 10.1.2. Cancer
- 10.1.3. Dental
- 10.1.4. Cardiovascular
- 10.1.5. Other Applications
- 10.2. Market Analysis, Insights and Forecast - by Technology
- 10.2.1. Computed Radiography
- 10.2.2. Direct Radiography
- 10.3. Market Analysis, Insights and Forecast - by Portability
- 10.3.1. Fixed Systems
- 10.3.2. Portable Systems
- 10.4. Market Analysis, Insights and Forecast - by End User
- 10.4.1. Hospitals
- 10.4.2. Diagnostic Centers
- 10.4.3. Other End Users
- 10.1. Market Analysis, Insights and Forecast - by Application
- 11. Kanto Digital X-Ray Market in Japan Analysis, Insights and Forecast, 2019-2031
- 12. Kansai Digital X-Ray Market in Japan Analysis, Insights and Forecast, 2019-2031
- 13. Chubu Digital X-Ray Market in Japan Analysis, Insights and Forecast, 2019-2031
- 14. Kyushu Digital X-Ray Market in Japan Analysis, Insights and Forecast, 2019-2031
- 15. Tohoku Digital X-Ray Market in Japan Analysis, Insights and Forecast, 2019-2031
- 16. Competitive Analysis
- 16.1. Global Market Share Analysis 2024
- 16.2. Company Profiles
- 16.2.1 Konica Minolta Inc
- 16.2.1.1. Overview
- 16.2.1.2. Products
- 16.2.1.3. SWOT Analysis
- 16.2.1.4. Recent Developments
- 16.2.1.5. Financials (Based on Availability)
- 16.2.2 Hologic Inc
- 16.2.2.1. Overview
- 16.2.2.2. Products
- 16.2.2.3. SWOT Analysis
- 16.2.2.4. Recent Developments
- 16.2.2.5. Financials (Based on Availability)
- 16.2.3 GE Healthcare
- 16.2.3.1. Overview
- 16.2.3.2. Products
- 16.2.3.3. SWOT Analysis
- 16.2.3.4. Recent Developments
- 16.2.3.5. Financials (Based on Availability)
- 16.2.4 MIKASA X-RAY Co Ltd*List Not Exhaustive
- 16.2.4.1. Overview
- 16.2.4.2. Products
- 16.2.4.3. SWOT Analysis
- 16.2.4.4. Recent Developments
- 16.2.4.5. Financials (Based on Availability)
- 16.2.5 Siemens Healthineers AG
- 16.2.5.1. Overview
- 16.2.5.2. Products
- 16.2.5.3. SWOT Analysis
- 16.2.5.4. Recent Developments
- 16.2.5.5. Financials (Based on Availability)
- 16.2.6 Canon (Canon Medical Systems Corporation)
- 16.2.6.1. Overview
- 16.2.6.2. Products
- 16.2.6.3. SWOT Analysis
- 16.2.6.4. Recent Developments
- 16.2.6.5. Financials (Based on Availability)
- 16.2.7 Carestream Health
- 16.2.7.1. Overview
- 16.2.7.2. Products
- 16.2.7.3. SWOT Analysis
- 16.2.7.4. Recent Developments
- 16.2.7.5. Financials (Based on Availability)
- 16.2.8 Koninklinje Philips NV
- 16.2.8.1. Overview
- 16.2.8.2. Products
- 16.2.8.3. SWOT Analysis
- 16.2.8.4. Recent Developments
- 16.2.8.5. Financials (Based on Availability)
- 16.2.9 Shimadzu Corporation
- 16.2.9.1. Overview
- 16.2.9.2. Products
- 16.2.9.3. SWOT Analysis
- 16.2.9.4. Recent Developments
- 16.2.9.5. Financials (Based on Availability)
- 16.2.10 Fujifilm Holdings Corporation
- 16.2.10.1. Overview
- 16.2.10.2. Products
- 16.2.10.3. SWOT Analysis
- 16.2.10.4. Recent Developments
- 16.2.10.5. Financials (Based on Availability)
- 16.2.1 Konica Minolta Inc
List of Figures
- Figure 1: Global Digital X-Ray Market in Japan Revenue Breakdown (Million, %) by Region 2024 & 2032
- Figure 2: Japan Digital X-Ray Market in Japan Revenue (Million), by Country 2024 & 2032
- Figure 3: Japan Digital X-Ray Market in Japan Revenue Share (%), by Country 2024 & 2032
- Figure 4: North America Digital X-Ray Market in Japan Revenue (Million), by Application 2024 & 2032
- Figure 5: North America Digital X-Ray Market in Japan Revenue Share (%), by Application 2024 & 2032
- Figure 6: North America Digital X-Ray Market in Japan Revenue (Million), by Technology 2024 & 2032
- Figure 7: North America Digital X-Ray Market in Japan Revenue Share (%), by Technology 2024 & 2032
- Figure 8: North America Digital X-Ray Market in Japan Revenue (Million), by Portability 2024 & 2032
- Figure 9: North America Digital X-Ray Market in Japan Revenue Share (%), by Portability 2024 & 2032
- Figure 10: North America Digital X-Ray Market in Japan Revenue (Million), by End User 2024 & 2032
- Figure 11: North America Digital X-Ray Market in Japan Revenue Share (%), by End User 2024 & 2032
- Figure 12: North America Digital X-Ray Market in Japan Revenue (Million), by Country 2024 & 2032
- Figure 13: North America Digital X-Ray Market in Japan Revenue Share (%), by Country 2024 & 2032
- Figure 14: South America Digital X-Ray Market in Japan Revenue (Million), by Application 2024 & 2032
- Figure 15: South America Digital X-Ray Market in Japan Revenue Share (%), by Application 2024 & 2032
- Figure 16: South America Digital X-Ray Market in Japan Revenue (Million), by Technology 2024 & 2032
- Figure 17: South America Digital X-Ray Market in Japan Revenue Share (%), by Technology 2024 & 2032
- Figure 18: South America Digital X-Ray Market in Japan Revenue (Million), by Portability 2024 & 2032
- Figure 19: South America Digital X-Ray Market in Japan Revenue Share (%), by Portability 2024 & 2032
- Figure 20: South America Digital X-Ray Market in Japan Revenue (Million), by End User 2024 & 2032
- Figure 21: South America Digital X-Ray Market in Japan Revenue Share (%), by End User 2024 & 2032
- Figure 22: South America Digital X-Ray Market in Japan Revenue (Million), by Country 2024 & 2032
- Figure 23: South America Digital X-Ray Market in Japan Revenue Share (%), by Country 2024 & 2032
- Figure 24: Europe Digital X-Ray Market in Japan Revenue (Million), by Application 2024 & 2032
- Figure 25: Europe Digital X-Ray Market in Japan Revenue Share (%), by Application 2024 & 2032
- Figure 26: Europe Digital X-Ray Market in Japan Revenue (Million), by Technology 2024 & 2032
- Figure 27: Europe Digital X-Ray Market in Japan Revenue Share (%), by Technology 2024 & 2032
- Figure 28: Europe Digital X-Ray Market in Japan Revenue (Million), by Portability 2024 & 2032
- Figure 29: Europe Digital X-Ray Market in Japan Revenue Share (%), by Portability 2024 & 2032
- Figure 30: Europe Digital X-Ray Market in Japan Revenue (Million), by End User 2024 & 2032
- Figure 31: Europe Digital X-Ray Market in Japan Revenue Share (%), by End User 2024 & 2032
- Figure 32: Europe Digital X-Ray Market in Japan Revenue (Million), by Country 2024 & 2032
- Figure 33: Europe Digital X-Ray Market in Japan Revenue Share (%), by Country 2024 & 2032
- Figure 34: Middle East & Africa Digital X-Ray Market in Japan Revenue (Million), by Application 2024 & 2032
- Figure 35: Middle East & Africa Digital X-Ray Market in Japan Revenue Share (%), by Application 2024 & 2032
- Figure 36: Middle East & Africa Digital X-Ray Market in Japan Revenue (Million), by Technology 2024 & 2032
- Figure 37: Middle East & Africa Digital X-Ray Market in Japan Revenue Share (%), by Technology 2024 & 2032
- Figure 38: Middle East & Africa Digital X-Ray Market in Japan Revenue (Million), by Portability 2024 & 2032
- Figure 39: Middle East & Africa Digital X-Ray Market in Japan Revenue Share (%), by Portability 2024 & 2032
- Figure 40: Middle East & Africa Digital X-Ray Market in Japan Revenue (Million), by End User 2024 & 2032
- Figure 41: Middle East & Africa Digital X-Ray Market in Japan Revenue Share (%), by End User 2024 & 2032
- Figure 42: Middle East & Africa Digital X-Ray Market in Japan Revenue (Million), by Country 2024 & 2032
- Figure 43: Middle East & Africa Digital X-Ray Market in Japan Revenue Share (%), by Country 2024 & 2032
- Figure 44: Asia Pacific Digital X-Ray Market in Japan Revenue (Million), by Application 2024 & 2032
- Figure 45: Asia Pacific Digital X-Ray Market in Japan Revenue Share (%), by Application 2024 & 2032
- Figure 46: Asia Pacific Digital X-Ray Market in Japan Revenue (Million), by Technology 2024 & 2032
- Figure 47: Asia Pacific Digital X-Ray Market in Japan Revenue Share (%), by Technology 2024 & 2032
- Figure 48: Asia Pacific Digital X-Ray Market in Japan Revenue (Million), by Portability 2024 & 2032
- Figure 49: Asia Pacific Digital X-Ray Market in Japan Revenue Share (%), by Portability 2024 & 2032
- Figure 50: Asia Pacific Digital X-Ray Market in Japan Revenue (Million), by End User 2024 & 2032
- Figure 51: Asia Pacific Digital X-Ray Market in Japan Revenue Share (%), by End User 2024 & 2032
- Figure 52: Asia Pacific Digital X-Ray Market in Japan Revenue (Million), by Country 2024 & 2032
- Figure 53: Asia Pacific Digital X-Ray Market in Japan Revenue Share (%), by Country 2024 & 2032
List of Tables
- Table 1: Global Digital X-Ray Market in Japan Revenue Million Forecast, by Region 2019 & 2032
- Table 2: Global Digital X-Ray Market in Japan Revenue Million Forecast, by Application 2019 & 2032
- Table 3: Global Digital X-Ray Market in Japan Revenue Million Forecast, by Technology 2019 & 2032
- Table 4: Global Digital X-Ray Market in Japan Revenue Million Forecast, by Portability 2019 & 2032
- Table 5: Global Digital X-Ray Market in Japan Revenue Million Forecast, by End User 2019 & 2032
- Table 6: Global Digital X-Ray Market in Japan Revenue Million Forecast, by Region 2019 & 2032
- Table 7: Global Digital X-Ray Market in Japan Revenue Million Forecast, by Country 2019 & 2032
- Table 8: Kanto Digital X-Ray Market in Japan Revenue (Million) Forecast, by Application 2019 & 2032
- Table 9: Kansai Digital X-Ray Market in Japan Revenue (Million) Forecast, by Application 2019 & 2032
- Table 10: Chubu Digital X-Ray Market in Japan Revenue (Million) Forecast, by Application 2019 & 2032
- Table 11: Kyushu Digital X-Ray Market in Japan Revenue (Million) Forecast, by Application 2019 & 2032
- Table 12: Tohoku Digital X-Ray Market in Japan Revenue (Million) Forecast, by Application 2019 & 2032
- Table 13: Global Digital X-Ray Market in Japan Revenue Million Forecast, by Application 2019 & 2032
- Table 14: Global Digital X-Ray Market in Japan Revenue Million Forecast, by Technology 2019 & 2032
- Table 15: Global Digital X-Ray Market in Japan Revenue Million Forecast, by Portability 2019 & 2032
- Table 16: Global Digital X-Ray Market in Japan Revenue Million Forecast, by End User 2019 & 2032
- Table 17: Global Digital X-Ray Market in Japan Revenue Million Forecast, by Country 2019 & 2032
- Table 18: United States Digital X-Ray Market in Japan Revenue (Million) Forecast, by Application 2019 & 2032
- Table 19: Canada Digital X-Ray Market in Japan Revenue (Million) Forecast, by Application 2019 & 2032
- Table 20: Mexico Digital X-Ray Market in Japan Revenue (Million) Forecast, by Application 2019 & 2032
- Table 21: Global Digital X-Ray Market in Japan Revenue Million Forecast, by Application 2019 & 2032
- Table 22: Global Digital X-Ray Market in Japan Revenue Million Forecast, by Technology 2019 & 2032
- Table 23: Global Digital X-Ray Market in Japan Revenue Million Forecast, by Portability 2019 & 2032
- Table 24: Global Digital X-Ray Market in Japan Revenue Million Forecast, by End User 2019 & 2032
- Table 25: Global Digital X-Ray Market in Japan Revenue Million Forecast, by Country 2019 & 2032
- Table 26: Brazil Digital X-Ray Market in Japan Revenue (Million) Forecast, by Application 2019 & 2032
- Table 27: Argentina Digital X-Ray Market in Japan Revenue (Million) Forecast, by Application 2019 & 2032
- Table 28: Rest of South America Digital X-Ray Market in Japan Revenue (Million) Forecast, by Application 2019 & 2032
- Table 29: Global Digital X-Ray Market in Japan Revenue Million Forecast, by Application 2019 & 2032
- Table 30: Global Digital X-Ray Market in Japan Revenue Million Forecast, by Technology 2019 & 2032
- Table 31: Global Digital X-Ray Market in Japan Revenue Million Forecast, by Portability 2019 & 2032
- Table 32: Global Digital X-Ray Market in Japan Revenue Million Forecast, by End User 2019 & 2032
- Table 33: Global Digital X-Ray Market in Japan Revenue Million Forecast, by Country 2019 & 2032
- Table 34: United Kingdom Digital X-Ray Market in Japan Revenue (Million) Forecast, by Application 2019 & 2032
- Table 35: Germany Digital X-Ray Market in Japan Revenue (Million) Forecast, by Application 2019 & 2032
- Table 36: France Digital X-Ray Market in Japan Revenue (Million) Forecast, by Application 2019 & 2032
- Table 37: Italy Digital X-Ray Market in Japan Revenue (Million) Forecast, by Application 2019 & 2032
- Table 38: Spain Digital X-Ray Market in Japan Revenue (Million) Forecast, by Application 2019 & 2032
- Table 39: Russia Digital X-Ray Market in Japan Revenue (Million) Forecast, by Application 2019 & 2032
- Table 40: Benelux Digital X-Ray Market in Japan Revenue (Million) Forecast, by Application 2019 & 2032
- Table 41: Nordics Digital X-Ray Market in Japan Revenue (Million) Forecast, by Application 2019 & 2032
- Table 42: Rest of Europe Digital X-Ray Market in Japan Revenue (Million) Forecast, by Application 2019 & 2032
- Table 43: Global Digital X-Ray Market in Japan Revenue Million Forecast, by Application 2019 & 2032
- Table 44: Global Digital X-Ray Market in Japan Revenue Million Forecast, by Technology 2019 & 2032
- Table 45: Global Digital X-Ray Market in Japan Revenue Million Forecast, by Portability 2019 & 2032
- Table 46: Global Digital X-Ray Market in Japan Revenue Million Forecast, by End User 2019 & 2032
- Table 47: Global Digital X-Ray Market in Japan Revenue Million Forecast, by Country 2019 & 2032
- Table 48: Turkey Digital X-Ray Market in Japan Revenue (Million) Forecast, by Application 2019 & 2032
- Table 49: Israel Digital X-Ray Market in Japan Revenue (Million) Forecast, by Application 2019 & 2032
- Table 50: GCC Digital X-Ray Market in Japan Revenue (Million) Forecast, by Application 2019 & 2032
- Table 51: North Africa Digital X-Ray Market in Japan Revenue (Million) Forecast, by Application 2019 & 2032
- Table 52: South Africa Digital X-Ray Market in Japan Revenue (Million) Forecast, by Application 2019 & 2032
- Table 53: Rest of Middle East & Africa Digital X-Ray Market in Japan Revenue (Million) Forecast, by Application 2019 & 2032
- Table 54: Global Digital X-Ray Market in Japan Revenue Million Forecast, by Application 2019 & 2032
- Table 55: Global Digital X-Ray Market in Japan Revenue Million Forecast, by Technology 2019 & 2032
- Table 56: Global Digital X-Ray Market in Japan Revenue Million Forecast, by Portability 2019 & 2032
- Table 57: Global Digital X-Ray Market in Japan Revenue Million Forecast, by End User 2019 & 2032
- Table 58: Global Digital X-Ray Market in Japan Revenue Million Forecast, by Country 2019 & 2032
- Table 59: China Digital X-Ray Market in Japan Revenue (Million) Forecast, by Application 2019 & 2032
- Table 60: India Digital X-Ray Market in Japan Revenue (Million) Forecast, by Application 2019 & 2032
- Table 61: Japan Digital X-Ray Market in Japan Revenue (Million) Forecast, by Application 2019 & 2032
- Table 62: South Korea Digital X-Ray Market in Japan Revenue (Million) Forecast, by Application 2019 & 2032
- Table 63: ASEAN Digital X-Ray Market in Japan Revenue (Million) Forecast, by Application 2019 & 2032
- Table 64: Oceania Digital X-Ray Market in Japan Revenue (Million) Forecast, by Application 2019 & 2032
- Table 65: Rest of Asia Pacific Digital X-Ray Market in Japan Revenue (Million) Forecast, by Application 2019 & 2032
Frequently Asked Questions
1. What is the projected Compound Annual Growth Rate (CAGR) of the Digital X-Ray Market in Japan?
The projected CAGR is approximately 9.54%.
2. Which companies are prominent players in the Digital X-Ray Market in Japan?
Key companies in the market include Konica Minolta Inc, Hologic Inc, GE Healthcare, MIKASA X-RAY Co Ltd*List Not Exhaustive, Siemens Healthineers AG, Canon (Canon Medical Systems Corporation), Carestream Health, Koninklinje Philips NV, Shimadzu Corporation, Fujifilm Holdings Corporation.
3. What are the main segments of the Digital X-Ray Market in Japan?
The market segments include Application, Technology, Portability, End User.
4. Can you provide details about the market size?
The market size is estimated to be USD 560.84 Million as of 2022.
5. What are some drivers contributing to market growth?
Increasing Prevalence of Chronic Diseases; Increasing Technological Advancements.
6. What are the notable trends driving market growth?
Cancer Segment is Expected to Hold a Significant Market Share Over the Forecast Period.
7. Are there any restraints impacting market growth?
High Cost of Equipment.
8. Can you provide examples of recent developments in the market?
April 2023: Canon Inc., Canon Medical Systems Corporation (Canon Medical), and the National Cancer Center Japan (NCC) have begun clinical research employing a next-generation X-ray CT system with photon-counting computed tomography (photon-counting CT, PCCT).
9. What pricing options are available for accessing the report?
Pricing options include single-user, multi-user, and enterprise licenses priced at USD 3800, USD 4500, and USD 5800 respectively.
10. Is the market size provided in terms of value or volume?
The market size is provided in terms of value, measured in Million.
11. Are there any specific market keywords associated with the report?
Yes, the market keyword associated with the report is "Digital X-Ray Market in Japan," which aids in identifying and referencing the specific market segment covered.
12. How do I determine which pricing option suits my needs best?
The pricing options vary based on user requirements and access needs. Individual users may opt for single-user licenses, while businesses requiring broader access may choose multi-user or enterprise licenses for cost-effective access to the report.
13. Are there any additional resources or data provided in the Digital X-Ray Market in Japan report?
While the report offers comprehensive insights, it's advisable to review the specific contents or supplementary materials provided to ascertain if additional resources or data are available.
14. How can I stay updated on further developments or reports in the Digital X-Ray Market in Japan?
To stay informed about further developments, trends, and reports in the Digital X-Ray Market in Japan, consider subscribing to industry newsletters, following relevant companies and organizations, or regularly checking reputable industry news sources and publications.
Methodology
Step 1 - Identification of Relevant Samples Size from Population Database


Step 2 - Approaches for Defining Global Market Size (Value, Volume* & Price*)

Note*: In applicable scenarios
Step 3 - Data Sources
Primary Research
- Web Analytics
- Survey Reports
- Research Institute
- Latest Research Reports
- Opinion Leaders
Secondary Research
- Annual Reports
- White Paper
- Latest Press Release
- Industry Association
- Paid Database
- Investor Presentations

Step 4 - Data Triangulation
Involves using different sources of information in order to increase the validity of a study
These sources are likely to be stakeholders in a program - participants, other researchers, program staff, other community members, and so on.
Then we put all data in single framework & apply various statistical tools to find out the dynamic on the market.
During the analysis stage, feedback from the stakeholder groups would be compared to determine areas of agreement as well as areas of divergence


