
Key Insights
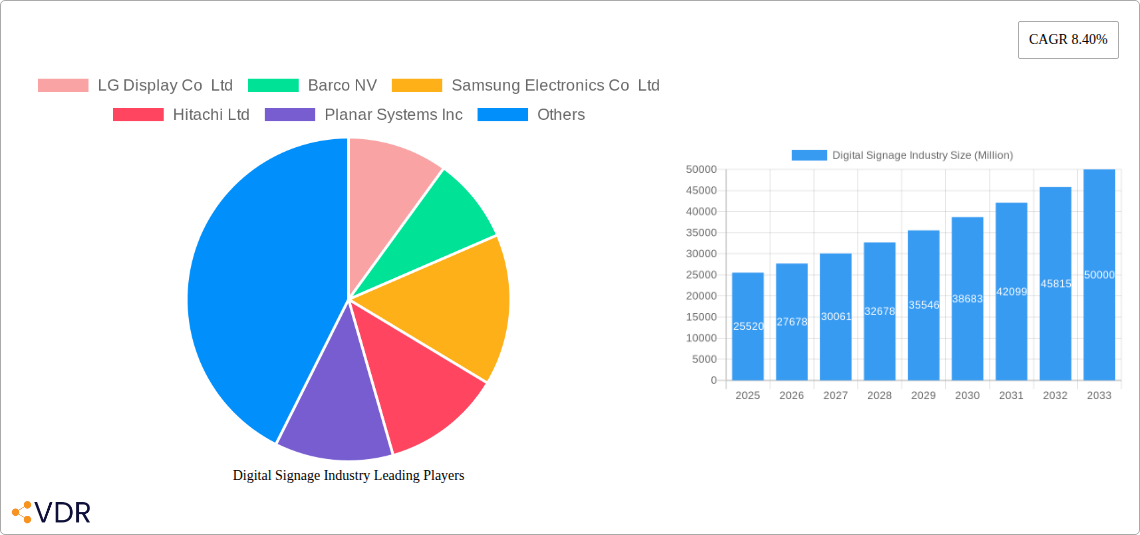
The digital signage market, valued at $25.52 billion in 2025, is experiencing robust growth, projected to expand at a compound annual growth rate (CAGR) of 8.40% from 2025 to 2033. This expansion is fueled by several key drivers. The increasing adoption of digital signage across various sectors, including retail, transportation, and hospitality, is a significant contributor. Businesses are leveraging digital signage for enhanced customer engagement, improved brand visibility, and streamlined communication. Technological advancements, such as the development of higher-resolution displays, improved software capabilities, and the integration of interactive features, are further boosting market growth. The shift towards more sophisticated content management systems (CMS) that allow for easier updates and targeted advertising campaigns also plays a crucial role. Furthermore, the rising popularity of interactive kiosks and transparent LCD screens is contributing to market segmentation diversification and expansion. Despite these positive trends, challenges remain. High initial investment costs for implementing digital signage solutions and the ongoing maintenance expenses could hinder adoption, particularly for smaller businesses. Competition amongst established players and emerging companies also influences market dynamics.
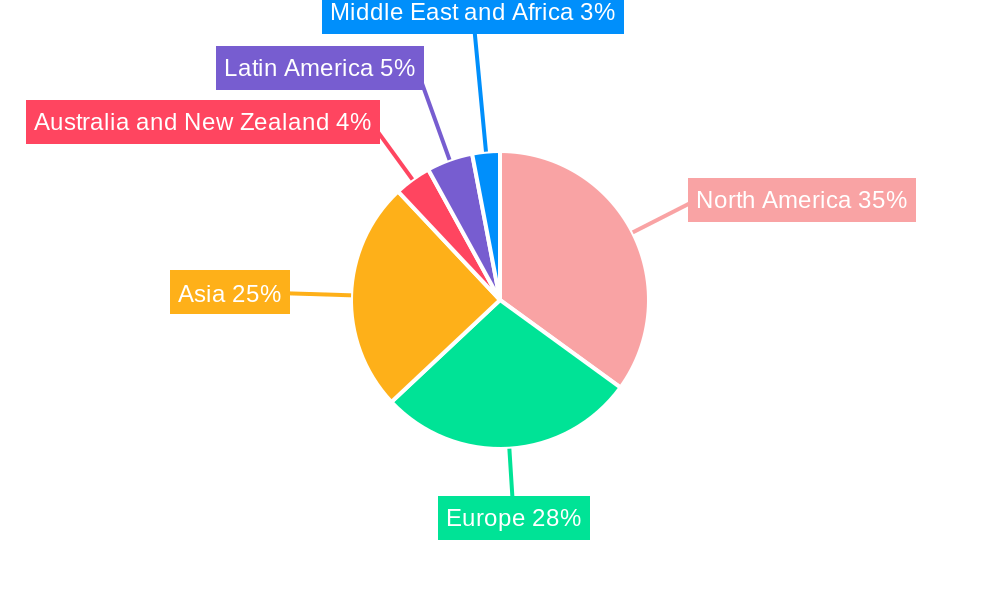
The market segmentation reveals a diverse landscape. Hardware constitutes a major segment, followed by software and services. Screen size is another key differentiator, with the 32'-52' segment likely holding the largest market share due to its versatility across various applications. Location-based segmentation shows significant demand for both in-store and outdoor applications, reflecting the broad applicability of digital signage. Retail, transportation, and hospitality remain dominant application segments, driven by the need for effective customer communication and information dissemination. Geographically, North America and Asia are anticipated to dominate the market, although Europe and other regions are expected to witness substantial growth owing to increasing digitalization and infrastructure development. This dynamic market landscape presents significant opportunities for established players and new entrants alike, emphasizing the importance of innovation and strategic partnerships to gain a competitive edge.
Digital Signage Industry Market Report: 2019-2033
This comprehensive report provides a detailed analysis of the Digital Signage industry, encompassing market dynamics, growth trends, regional dominance, product landscape, key players, and future outlook. The study period spans from 2019 to 2033, with 2025 serving as the base and estimated year. The report forecasts market trends from 2025 to 2033, building upon historical data from 2019 to 2024. The report segments the market by component (hardware, software, services), size (below 32", 32"-52", above 52"), location (in-store, outdoor), application (retail, transportation, hospitality, corporate, education, government, other), and type (video wall, video screen, kiosk, transparent LCD screen, digital poster, other). Key players analyzed include LG Display Co Ltd, Barco NV, Samsung Electronics Co Ltd, Hitachi Ltd, Planar Systems Inc, Cisco Systems Inc, NEC Display Solutions Ltd, Goodview, Panasonic Corporation, Stratacache, and Sony Corporation. The market size is presented in million units.
Digital Signage Industry Market Dynamics & Structure
The digital signage market is characterized by moderate concentration, with a few major players holding significant market share, but also a large number of smaller, niche players. Technological innovation, particularly in areas like AI-powered content management and interactive displays, is a key driver. Regulatory frameworks, especially concerning data privacy and advertising regulations, influence market growth. Competitive substitutes include traditional print advertising and static displays. The end-user demographics are broad, spanning across various industries and business sizes. M&A activity has been relatively consistent, with strategic acquisitions aiming to expand product portfolios and geographical reach. The total market value is predicted to be xx Million units in 2025.
- Market Concentration: Moderately concentrated, with top 5 players holding approximately xx% market share in 2025.
- Technological Innovation: Key drivers include advancements in LED, LCD, and OLED technologies, increasing resolution and brightness, and the integration of AI and IoT.
- Regulatory Framework: Data privacy regulations and advertising standards impact content delivery and deployment strategies.
- Competitive Substitutes: Traditional print media, static signage, and other forms of advertising.
- End-User Demographics: Diverse, including retail, hospitality, transportation, corporate, education, and government sectors.
- M&A Trends: Steady level of M&A activity, with a focus on vertical integration and geographical expansion. xx M&A deals were recorded in 2024.
Digital Signage Industry Growth Trends & Insights
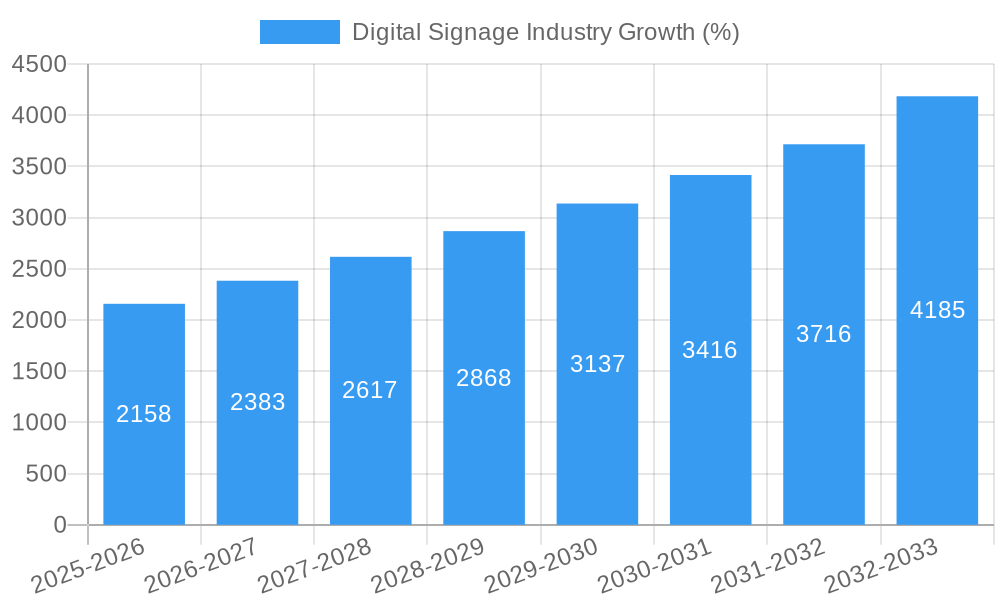
The global digital signage market experienced significant growth during the historical period (2019-2024), driven by increasing adoption across various sectors and technological advancements. The market is projected to continue this trajectory with a Compound Annual Growth Rate (CAGR) of xx% from 2025 to 2033. This growth is fueled by factors such as the rising demand for interactive and engaging customer experiences, the increasing adoption of digital signage in retail and hospitality sectors, and the expanding use of digital signage in corporate settings for internal communications and branding. The market penetration rate for digital signage is expected to reach xx% by 2033. Technological disruptions, like the integration of 5G and improved connectivity, are further propelling market growth. Consumer behavior shifts, emphasizing personalized and interactive experiences, have also created increased demand for advanced digital signage solutions. Overall, the market is expected to reach xx Million units by 2033.
Dominant Regions, Countries, or Segments in Digital Signage Industry
North America and Europe currently hold the largest market share in the digital signage industry, driven by high adoption rates in retail and corporate sectors, as well as developed infrastructure. However, the Asia-Pacific region is poised for significant growth due to rapid economic development, increasing urbanization, and rising disposable incomes. Within the segments, Hardware holds the largest share, followed by Software and Services. The 32"-52" size segment is the most dominant due to its versatility. In-store deployments account for the largest share of installations. The Retail and Corporate application segments display the highest growth potential.
- Key Drivers:
- North America & Europe: High adoption rates, advanced infrastructure.
- Asia-Pacific: Rapid economic growth, urbanization, rising disposable incomes.
- Hardware Segment: Essential component, continuous innovation.
- 32"-52" Size: Versatility for various applications.
- In-store Location: High foot traffic and direct customer engagement.
- Retail & Corporate Applications: Wide spread adoption across industries.
Digital Signage Industry Product Landscape
The digital signage market showcases a diverse range of products, from simple digital posters to sophisticated video walls and interactive kiosks. Key innovations include ultra-high definition displays, improved brightness and contrast ratios, and integration with AI-powered content management systems. These advancements enhance visual appeal, content relevance, and operational efficiency. Unique selling propositions focus on ease of use, seamless integration with existing systems, and the ability to deliver targeted advertising campaigns and enhance customer experiences. The development of transparent LCD screens and curved displays adds to the diverse product offerings.
Key Drivers, Barriers & Challenges in Digital Signage Industry
Key Drivers:
- Technological advancements: Higher resolution displays, improved brightness, and integration of AI and IoT.
- Rising demand for enhanced customer experience: Interactive displays and personalized content.
- Increased adoption across industries: Retail, hospitality, corporate, and transportation sectors.
Challenges & Restraints:
- High initial investment costs: Deterrent for small businesses.
- Complexity of installation and maintenance: Requires technical expertise.
- Competition from traditional advertising methods: Maintaining market share.
- Supply chain disruptions: Impact on production and delivery timelines. These disruptions led to a xx% decrease in production in 2022.
Emerging Opportunities in Digital Signage Industry
- Expansion into untapped markets: Developing economies in Africa and Latin America present significant potential.
- Innovative applications: Integration with AR/VR technologies and personalized advertising experiences.
- Evolving consumer preferences: Demand for interactive and engaging displays.
- Growth of the digital signage as a service (DSaaS) model: Facilitates easy deployment and management for businesses.
Growth Accelerators in the Digital Signage Industry
Technological breakthroughs, especially in display technologies and content management systems, are key growth accelerators. Strategic partnerships between hardware manufacturers, software providers, and content creators create synergies. Market expansion strategies focusing on emerging economies and new applications also contribute to growth. The increasing adoption of cloud-based solutions simplifies deployment and maintenance, further accelerating market expansion.
Key Players Shaping the Digital Signage Industry Market
- LG Display Co Ltd
- Barco NV
- Samsung Electronics Co Ltd
- Hitachi Ltd
- Planar Systems Inc
- Cisco Systems Inc
- NEC Display Solutions Ltd
- Goodview
- Panasonic Corporation
- Stratacache
- Sony Corporation
Notable Milestones in Digital Signage Industry Sector
- May 2024: Quest Technology Management and Samsung Electronics America launched a managed service for SMBs through Telarus.
- March 2024: Quest Technology Management and Samsung partnered to offer an exclusive digital signage solution via Telarus, creating a unified service.
In-Depth Digital Signage Industry Market Outlook
The digital signage market is poised for continued strong growth, driven by technological advancements, increasing adoption across various sectors, and the emergence of new applications. Strategic partnerships and expansion into untapped markets will further accelerate growth. The market’s future potential is significant, presenting lucrative opportunities for businesses to capitalize on the evolving needs of consumers and businesses for engaging and impactful visual communications. The market is expected to maintain a healthy CAGR, ensuring sustained expansion throughout the forecast period.
Digital Signage Industry Segmentation
-
1. Type
- 1.1. Video Wall
- 1.2. Video Screen
- 1.3. Kiosk
- 1.4. Transparent LCD Screen
- 1.5. Digital Poster
- 1.6. Other Types
-
2. Component
-
2.1. Hardware
- 2.1.1. LCD/LED Display
- 2.1.2. OLED Display
- 2.1.3. Media Players
- 2.1.4. Projector/Projection Screens
- 2.1.5. Other Hardware
- 2.2. Software
- 2.3. Services
-
2.1. Hardware
-
3. Size
- 3.1. Below 32'
- 3.2. 32' - 52'
- 3.3. Above 52'
-
4. Location
- 4.1. In-store
- 4.2. Outdoor
-
5. Application
- 5.1. Retail
- 5.2. Transportation
- 5.3. Hospitality
- 5.4. Corporate
- 5.5. Education
- 5.6. Government
- 5.7. Other Applications
Digital Signage Industry Segmentation By Geography
- 1. North America
- 2. Asia
- 3. Australia and New Zealand
- 4. Europe
- 5. Latin America
- 6. Middle East and Africa
Digital Signage Industry REPORT HIGHLIGHTS
| Aspects | Details |
|---|---|
| Study Period | 2019-2033 |
| Base Year | 2024 |
| Estimated Year | 2025 |
| Forecast Period | 2025-2033 |
| Historical Period | 2019-2024 |
| Growth Rate | CAGR of 8.40% from 2019-2033 |
| Segmentation |
|
Table of Contents
- 1. Introduction
- 1.1. Research Scope
- 1.2. Market Segmentation
- 1.3. Research Methodology
- 1.4. Definitions and Assumptions
- 2. Executive Summary
- 2.1. Introduction
- 3. Market Dynamics
- 3.1. Introduction
- 3.2. Market Drivers
- 3.2.1. Convergence of Digital Signage with Cross-platform Media Tool; Evolution of Turnkey Solutions; Diminishing Cost of Infrastructure Leading to Higher Penetration
- 3.3. Market Restrains
- 3.3.1. Poor Integration with Complex Business Requirements
- 3.4. Market Trends
- 3.4.1. OLED Display is Expected to Experience Healthy Growth
- 4. Market Factor Analysis
- 4.1. Porters Five Forces
- 4.2. Supply/Value Chain
- 4.3. PESTEL analysis
- 4.4. Market Entropy
- 4.5. Patent/Trademark Analysis
- 5. Global Digital Signage Industry Analysis, Insights and Forecast, 2019-2031
- 5.1. Market Analysis, Insights and Forecast - by Type
- 5.1.1. Video Wall
- 5.1.2. Video Screen
- 5.1.3. Kiosk
- 5.1.4. Transparent LCD Screen
- 5.1.5. Digital Poster
- 5.1.6. Other Types
- 5.2. Market Analysis, Insights and Forecast - by Component
- 5.2.1. Hardware
- 5.2.1.1. LCD/LED Display
- 5.2.1.2. OLED Display
- 5.2.1.3. Media Players
- 5.2.1.4. Projector/Projection Screens
- 5.2.1.5. Other Hardware
- 5.2.2. Software
- 5.2.3. Services
- 5.2.1. Hardware
- 5.3. Market Analysis, Insights and Forecast - by Size
- 5.3.1. Below 32'
- 5.3.2. 32' - 52'
- 5.3.3. Above 52'
- 5.4. Market Analysis, Insights and Forecast - by Location
- 5.4.1. In-store
- 5.4.2. Outdoor
- 5.5. Market Analysis, Insights and Forecast - by Application
- 5.5.1. Retail
- 5.5.2. Transportation
- 5.5.3. Hospitality
- 5.5.4. Corporate
- 5.5.5. Education
- 5.5.6. Government
- 5.5.7. Other Applications
- 5.6. Market Analysis, Insights and Forecast - by Region
- 5.6.1. North America
- 5.6.2. Asia
- 5.6.3. Australia and New Zealand
- 5.6.4. Europe
- 5.6.5. Latin America
- 5.6.6. Middle East and Africa
- 5.1. Market Analysis, Insights and Forecast - by Type
- 6. North America Digital Signage Industry Analysis, Insights and Forecast, 2019-2031
- 6.1. Market Analysis, Insights and Forecast - by Type
- 6.1.1. Video Wall
- 6.1.2. Video Screen
- 6.1.3. Kiosk
- 6.1.4. Transparent LCD Screen
- 6.1.5. Digital Poster
- 6.1.6. Other Types
- 6.2. Market Analysis, Insights and Forecast - by Component
- 6.2.1. Hardware
- 6.2.1.1. LCD/LED Display
- 6.2.1.2. OLED Display
- 6.2.1.3. Media Players
- 6.2.1.4. Projector/Projection Screens
- 6.2.1.5. Other Hardware
- 6.2.2. Software
- 6.2.3. Services
- 6.2.1. Hardware
- 6.3. Market Analysis, Insights and Forecast - by Size
- 6.3.1. Below 32'
- 6.3.2. 32' - 52'
- 6.3.3. Above 52'
- 6.4. Market Analysis, Insights and Forecast - by Location
- 6.4.1. In-store
- 6.4.2. Outdoor
- 6.5. Market Analysis, Insights and Forecast - by Application
- 6.5.1. Retail
- 6.5.2. Transportation
- 6.5.3. Hospitality
- 6.5.4. Corporate
- 6.5.5. Education
- 6.5.6. Government
- 6.5.7. Other Applications
- 6.1. Market Analysis, Insights and Forecast - by Type
- 7. Asia Digital Signage Industry Analysis, Insights and Forecast, 2019-2031
- 7.1. Market Analysis, Insights and Forecast - by Type
- 7.1.1. Video Wall
- 7.1.2. Video Screen
- 7.1.3. Kiosk
- 7.1.4. Transparent LCD Screen
- 7.1.5. Digital Poster
- 7.1.6. Other Types
- 7.2. Market Analysis, Insights and Forecast - by Component
- 7.2.1. Hardware
- 7.2.1.1. LCD/LED Display
- 7.2.1.2. OLED Display
- 7.2.1.3. Media Players
- 7.2.1.4. Projector/Projection Screens
- 7.2.1.5. Other Hardware
- 7.2.2. Software
- 7.2.3. Services
- 7.2.1. Hardware
- 7.3. Market Analysis, Insights and Forecast - by Size
- 7.3.1. Below 32'
- 7.3.2. 32' - 52'
- 7.3.3. Above 52'
- 7.4. Market Analysis, Insights and Forecast - by Location
- 7.4.1. In-store
- 7.4.2. Outdoor
- 7.5. Market Analysis, Insights and Forecast - by Application
- 7.5.1. Retail
- 7.5.2. Transportation
- 7.5.3. Hospitality
- 7.5.4. Corporate
- 7.5.5. Education
- 7.5.6. Government
- 7.5.7. Other Applications
- 7.1. Market Analysis, Insights and Forecast - by Type
- 8. Australia and New Zealand Digital Signage Industry Analysis, Insights and Forecast, 2019-2031
- 8.1. Market Analysis, Insights and Forecast - by Type
- 8.1.1. Video Wall
- 8.1.2. Video Screen
- 8.1.3. Kiosk
- 8.1.4. Transparent LCD Screen
- 8.1.5. Digital Poster
- 8.1.6. Other Types
- 8.2. Market Analysis, Insights and Forecast - by Component
- 8.2.1. Hardware
- 8.2.1.1. LCD/LED Display
- 8.2.1.2. OLED Display
- 8.2.1.3. Media Players
- 8.2.1.4. Projector/Projection Screens
- 8.2.1.5. Other Hardware
- 8.2.2. Software
- 8.2.3. Services
- 8.2.1. Hardware
- 8.3. Market Analysis, Insights and Forecast - by Size
- 8.3.1. Below 32'
- 8.3.2. 32' - 52'
- 8.3.3. Above 52'
- 8.4. Market Analysis, Insights and Forecast - by Location
- 8.4.1. In-store
- 8.4.2. Outdoor
- 8.5. Market Analysis, Insights and Forecast - by Application
- 8.5.1. Retail
- 8.5.2. Transportation
- 8.5.3. Hospitality
- 8.5.4. Corporate
- 8.5.5. Education
- 8.5.6. Government
- 8.5.7. Other Applications
- 8.1. Market Analysis, Insights and Forecast - by Type
- 9. Europe Digital Signage Industry Analysis, Insights and Forecast, 2019-2031
- 9.1. Market Analysis, Insights and Forecast - by Type
- 9.1.1. Video Wall
- 9.1.2. Video Screen
- 9.1.3. Kiosk
- 9.1.4. Transparent LCD Screen
- 9.1.5. Digital Poster
- 9.1.6. Other Types
- 9.2. Market Analysis, Insights and Forecast - by Component
- 9.2.1. Hardware
- 9.2.1.1. LCD/LED Display
- 9.2.1.2. OLED Display
- 9.2.1.3. Media Players
- 9.2.1.4. Projector/Projection Screens
- 9.2.1.5. Other Hardware
- 9.2.2. Software
- 9.2.3. Services
- 9.2.1. Hardware
- 9.3. Market Analysis, Insights and Forecast - by Size
- 9.3.1. Below 32'
- 9.3.2. 32' - 52'
- 9.3.3. Above 52'
- 9.4. Market Analysis, Insights and Forecast - by Location
- 9.4.1. In-store
- 9.4.2. Outdoor
- 9.5. Market Analysis, Insights and Forecast - by Application
- 9.5.1. Retail
- 9.5.2. Transportation
- 9.5.3. Hospitality
- 9.5.4. Corporate
- 9.5.5. Education
- 9.5.6. Government
- 9.5.7. Other Applications
- 9.1. Market Analysis, Insights and Forecast - by Type
- 10. Latin America Digital Signage Industry Analysis, Insights and Forecast, 2019-2031
- 10.1. Market Analysis, Insights and Forecast - by Type
- 10.1.1. Video Wall
- 10.1.2. Video Screen
- 10.1.3. Kiosk
- 10.1.4. Transparent LCD Screen
- 10.1.5. Digital Poster
- 10.1.6. Other Types
- 10.2. Market Analysis, Insights and Forecast - by Component
- 10.2.1. Hardware
- 10.2.1.1. LCD/LED Display
- 10.2.1.2. OLED Display
- 10.2.1.3. Media Players
- 10.2.1.4. Projector/Projection Screens
- 10.2.1.5. Other Hardware
- 10.2.2. Software
- 10.2.3. Services
- 10.2.1. Hardware
- 10.3. Market Analysis, Insights and Forecast - by Size
- 10.3.1. Below 32'
- 10.3.2. 32' - 52'
- 10.3.3. Above 52'
- 10.4. Market Analysis, Insights and Forecast - by Location
- 10.4.1. In-store
- 10.4.2. Outdoor
- 10.5. Market Analysis, Insights and Forecast - by Application
- 10.5.1. Retail
- 10.5.2. Transportation
- 10.5.3. Hospitality
- 10.5.4. Corporate
- 10.5.5. Education
- 10.5.6. Government
- 10.5.7. Other Applications
- 10.1. Market Analysis, Insights and Forecast - by Type
- 11. Middle East and Africa Digital Signage Industry Analysis, Insights and Forecast, 2019-2031
- 11.1. Market Analysis, Insights and Forecast - by Type
- 11.1.1. Video Wall
- 11.1.2. Video Screen
- 11.1.3. Kiosk
- 11.1.4. Transparent LCD Screen
- 11.1.5. Digital Poster
- 11.1.6. Other Types
- 11.2. Market Analysis, Insights and Forecast - by Component
- 11.2.1. Hardware
- 11.2.1.1. LCD/LED Display
- 11.2.1.2. OLED Display
- 11.2.1.3. Media Players
- 11.2.1.4. Projector/Projection Screens
- 11.2.1.5. Other Hardware
- 11.2.2. Software
- 11.2.3. Services
- 11.2.1. Hardware
- 11.3. Market Analysis, Insights and Forecast - by Size
- 11.3.1. Below 32'
- 11.3.2. 32' - 52'
- 11.3.3. Above 52'
- 11.4. Market Analysis, Insights and Forecast - by Location
- 11.4.1. In-store
- 11.4.2. Outdoor
- 11.5. Market Analysis, Insights and Forecast - by Application
- 11.5.1. Retail
- 11.5.2. Transportation
- 11.5.3. Hospitality
- 11.5.4. Corporate
- 11.5.5. Education
- 11.5.6. Government
- 11.5.7. Other Applications
- 11.1. Market Analysis, Insights and Forecast - by Type
- 12. North America Digital Signage Industry Analysis, Insights and Forecast, 2019-2031
- 12.1. Market Analysis, Insights and Forecast - By Country/Sub-region
- 12.1.1.
- 13. Asia Digital Signage Industry Analysis, Insights and Forecast, 2019-2031
- 13.1. Market Analysis, Insights and Forecast - By Country/Sub-region
- 13.1.1.
- 14. Australia and New Zealand Digital Signage Industry Analysis, Insights and Forecast, 2019-2031
- 14.1. Market Analysis, Insights and Forecast - By Country/Sub-region
- 14.1.1.
- 15. Europe Digital Signage Industry Analysis, Insights and Forecast, 2019-2031
- 15.1. Market Analysis, Insights and Forecast - By Country/Sub-region
- 15.1.1.
- 16. Latin America Digital Signage Industry Analysis, Insights and Forecast, 2019-2031
- 16.1. Market Analysis, Insights and Forecast - By Country/Sub-region
- 16.1.1.
- 17. Middle East and Africa Digital Signage Industry Analysis, Insights and Forecast, 2019-2031
- 17.1. Market Analysis, Insights and Forecast - By Country/Sub-region
- 17.1.1.
- 18. Competitive Analysis
- 18.1. Global Market Share Analysis 2024
- 18.2. Company Profiles
- 18.2.1 LG Display Co Ltd
- 18.2.1.1. Overview
- 18.2.1.2. Products
- 18.2.1.3. SWOT Analysis
- 18.2.1.4. Recent Developments
- 18.2.1.5. Financials (Based on Availability)
- 18.2.2 Barco NV
- 18.2.2.1. Overview
- 18.2.2.2. Products
- 18.2.2.3. SWOT Analysis
- 18.2.2.4. Recent Developments
- 18.2.2.5. Financials (Based on Availability)
- 18.2.3 Samsung Electronics Co Ltd
- 18.2.3.1. Overview
- 18.2.3.2. Products
- 18.2.3.3. SWOT Analysis
- 18.2.3.4. Recent Developments
- 18.2.3.5. Financials (Based on Availability)
- 18.2.4 Hitachi Ltd
- 18.2.4.1. Overview
- 18.2.4.2. Products
- 18.2.4.3. SWOT Analysis
- 18.2.4.4. Recent Developments
- 18.2.4.5. Financials (Based on Availability)
- 18.2.5 Planar Systems Inc
- 18.2.5.1. Overview
- 18.2.5.2. Products
- 18.2.5.3. SWOT Analysis
- 18.2.5.4. Recent Developments
- 18.2.5.5. Financials (Based on Availability)
- 18.2.6 Cisco Systems Inc
- 18.2.6.1. Overview
- 18.2.6.2. Products
- 18.2.6.3. SWOT Analysis
- 18.2.6.4. Recent Developments
- 18.2.6.5. Financials (Based on Availability)
- 18.2.7 NEC Display Solutions Ltd
- 18.2.7.1. Overview
- 18.2.7.2. Products
- 18.2.7.3. SWOT Analysis
- 18.2.7.4. Recent Developments
- 18.2.7.5. Financials (Based on Availability)
- 18.2.8 Goodview
- 18.2.8.1. Overview
- 18.2.8.2. Products
- 18.2.8.3. SWOT Analysis
- 18.2.8.4. Recent Developments
- 18.2.8.5. Financials (Based on Availability)
- 18.2.9 Panasonic Corporation
- 18.2.9.1. Overview
- 18.2.9.2. Products
- 18.2.9.3. SWOT Analysis
- 18.2.9.4. Recent Developments
- 18.2.9.5. Financials (Based on Availability)
- 18.2.10 Stratacache
- 18.2.10.1. Overview
- 18.2.10.2. Products
- 18.2.10.3. SWOT Analysis
- 18.2.10.4. Recent Developments
- 18.2.10.5. Financials (Based on Availability)
- 18.2.11 Sony Corporation
- 18.2.11.1. Overview
- 18.2.11.2. Products
- 18.2.11.3. SWOT Analysis
- 18.2.11.4. Recent Developments
- 18.2.11.5. Financials (Based on Availability)
- 18.2.1 LG Display Co Ltd
List of Figures
- Figure 1: Global Digital Signage Industry Revenue Breakdown (Million, %) by Region 2024 & 2032
- Figure 2: North America Digital Signage Industry Revenue (Million), by Country 2024 & 2032
- Figure 3: North America Digital Signage Industry Revenue Share (%), by Country 2024 & 2032
- Figure 4: Asia Digital Signage Industry Revenue (Million), by Country 2024 & 2032
- Figure 5: Asia Digital Signage Industry Revenue Share (%), by Country 2024 & 2032
- Figure 6: Australia and New Zealand Digital Signage Industry Revenue (Million), by Country 2024 & 2032
- Figure 7: Australia and New Zealand Digital Signage Industry Revenue Share (%), by Country 2024 & 2032
- Figure 8: Europe Digital Signage Industry Revenue (Million), by Country 2024 & 2032
- Figure 9: Europe Digital Signage Industry Revenue Share (%), by Country 2024 & 2032
- Figure 10: Latin America Digital Signage Industry Revenue (Million), by Country 2024 & 2032
- Figure 11: Latin America Digital Signage Industry Revenue Share (%), by Country 2024 & 2032
- Figure 12: Middle East and Africa Digital Signage Industry Revenue (Million), by Country 2024 & 2032
- Figure 13: Middle East and Africa Digital Signage Industry Revenue Share (%), by Country 2024 & 2032
- Figure 14: North America Digital Signage Industry Revenue (Million), by Type 2024 & 2032
- Figure 15: North America Digital Signage Industry Revenue Share (%), by Type 2024 & 2032
- Figure 16: North America Digital Signage Industry Revenue (Million), by Component 2024 & 2032
- Figure 17: North America Digital Signage Industry Revenue Share (%), by Component 2024 & 2032
- Figure 18: North America Digital Signage Industry Revenue (Million), by Size 2024 & 2032
- Figure 19: North America Digital Signage Industry Revenue Share (%), by Size 2024 & 2032
- Figure 20: North America Digital Signage Industry Revenue (Million), by Location 2024 & 2032
- Figure 21: North America Digital Signage Industry Revenue Share (%), by Location 2024 & 2032
- Figure 22: North America Digital Signage Industry Revenue (Million), by Application 2024 & 2032
- Figure 23: North America Digital Signage Industry Revenue Share (%), by Application 2024 & 2032
- Figure 24: North America Digital Signage Industry Revenue (Million), by Country 2024 & 2032
- Figure 25: North America Digital Signage Industry Revenue Share (%), by Country 2024 & 2032
- Figure 26: Asia Digital Signage Industry Revenue (Million), by Type 2024 & 2032
- Figure 27: Asia Digital Signage Industry Revenue Share (%), by Type 2024 & 2032
- Figure 28: Asia Digital Signage Industry Revenue (Million), by Component 2024 & 2032
- Figure 29: Asia Digital Signage Industry Revenue Share (%), by Component 2024 & 2032
- Figure 30: Asia Digital Signage Industry Revenue (Million), by Size 2024 & 2032
- Figure 31: Asia Digital Signage Industry Revenue Share (%), by Size 2024 & 2032
- Figure 32: Asia Digital Signage Industry Revenue (Million), by Location 2024 & 2032
- Figure 33: Asia Digital Signage Industry Revenue Share (%), by Location 2024 & 2032
- Figure 34: Asia Digital Signage Industry Revenue (Million), by Application 2024 & 2032
- Figure 35: Asia Digital Signage Industry Revenue Share (%), by Application 2024 & 2032
- Figure 36: Asia Digital Signage Industry Revenue (Million), by Country 2024 & 2032
- Figure 37: Asia Digital Signage Industry Revenue Share (%), by Country 2024 & 2032
- Figure 38: Australia and New Zealand Digital Signage Industry Revenue (Million), by Type 2024 & 2032
- Figure 39: Australia and New Zealand Digital Signage Industry Revenue Share (%), by Type 2024 & 2032
- Figure 40: Australia and New Zealand Digital Signage Industry Revenue (Million), by Component 2024 & 2032
- Figure 41: Australia and New Zealand Digital Signage Industry Revenue Share (%), by Component 2024 & 2032
- Figure 42: Australia and New Zealand Digital Signage Industry Revenue (Million), by Size 2024 & 2032
- Figure 43: Australia and New Zealand Digital Signage Industry Revenue Share (%), by Size 2024 & 2032
- Figure 44: Australia and New Zealand Digital Signage Industry Revenue (Million), by Location 2024 & 2032
- Figure 45: Australia and New Zealand Digital Signage Industry Revenue Share (%), by Location 2024 & 2032
- Figure 46: Australia and New Zealand Digital Signage Industry Revenue (Million), by Application 2024 & 2032
- Figure 47: Australia and New Zealand Digital Signage Industry Revenue Share (%), by Application 2024 & 2032
- Figure 48: Australia and New Zealand Digital Signage Industry Revenue (Million), by Country 2024 & 2032
- Figure 49: Australia and New Zealand Digital Signage Industry Revenue Share (%), by Country 2024 & 2032
- Figure 50: Europe Digital Signage Industry Revenue (Million), by Type 2024 & 2032
- Figure 51: Europe Digital Signage Industry Revenue Share (%), by Type 2024 & 2032
- Figure 52: Europe Digital Signage Industry Revenue (Million), by Component 2024 & 2032
- Figure 53: Europe Digital Signage Industry Revenue Share (%), by Component 2024 & 2032
- Figure 54: Europe Digital Signage Industry Revenue (Million), by Size 2024 & 2032
- Figure 55: Europe Digital Signage Industry Revenue Share (%), by Size 2024 & 2032
- Figure 56: Europe Digital Signage Industry Revenue (Million), by Location 2024 & 2032
- Figure 57: Europe Digital Signage Industry Revenue Share (%), by Location 2024 & 2032
- Figure 58: Europe Digital Signage Industry Revenue (Million), by Application 2024 & 2032
- Figure 59: Europe Digital Signage Industry Revenue Share (%), by Application 2024 & 2032
- Figure 60: Europe Digital Signage Industry Revenue (Million), by Country 2024 & 2032
- Figure 61: Europe Digital Signage Industry Revenue Share (%), by Country 2024 & 2032
- Figure 62: Latin America Digital Signage Industry Revenue (Million), by Type 2024 & 2032
- Figure 63: Latin America Digital Signage Industry Revenue Share (%), by Type 2024 & 2032
- Figure 64: Latin America Digital Signage Industry Revenue (Million), by Component 2024 & 2032
- Figure 65: Latin America Digital Signage Industry Revenue Share (%), by Component 2024 & 2032
- Figure 66: Latin America Digital Signage Industry Revenue (Million), by Size 2024 & 2032
- Figure 67: Latin America Digital Signage Industry Revenue Share (%), by Size 2024 & 2032
- Figure 68: Latin America Digital Signage Industry Revenue (Million), by Location 2024 & 2032
- Figure 69: Latin America Digital Signage Industry Revenue Share (%), by Location 2024 & 2032
- Figure 70: Latin America Digital Signage Industry Revenue (Million), by Application 2024 & 2032
- Figure 71: Latin America Digital Signage Industry Revenue Share (%), by Application 2024 & 2032
- Figure 72: Latin America Digital Signage Industry Revenue (Million), by Country 2024 & 2032
- Figure 73: Latin America Digital Signage Industry Revenue Share (%), by Country 2024 & 2032
- Figure 74: Middle East and Africa Digital Signage Industry Revenue (Million), by Type 2024 & 2032
- Figure 75: Middle East and Africa Digital Signage Industry Revenue Share (%), by Type 2024 & 2032
- Figure 76: Middle East and Africa Digital Signage Industry Revenue (Million), by Component 2024 & 2032
- Figure 77: Middle East and Africa Digital Signage Industry Revenue Share (%), by Component 2024 & 2032
- Figure 78: Middle East and Africa Digital Signage Industry Revenue (Million), by Size 2024 & 2032
- Figure 79: Middle East and Africa Digital Signage Industry Revenue Share (%), by Size 2024 & 2032
- Figure 80: Middle East and Africa Digital Signage Industry Revenue (Million), by Location 2024 & 2032
- Figure 81: Middle East and Africa Digital Signage Industry Revenue Share (%), by Location 2024 & 2032
- Figure 82: Middle East and Africa Digital Signage Industry Revenue (Million), by Application 2024 & 2032
- Figure 83: Middle East and Africa Digital Signage Industry Revenue Share (%), by Application 2024 & 2032
- Figure 84: Middle East and Africa Digital Signage Industry Revenue (Million), by Country 2024 & 2032
- Figure 85: Middle East and Africa Digital Signage Industry Revenue Share (%), by Country 2024 & 2032
List of Tables
- Table 1: Global Digital Signage Industry Revenue Million Forecast, by Region 2019 & 2032
- Table 2: Global Digital Signage Industry Revenue Million Forecast, by Type 2019 & 2032
- Table 3: Global Digital Signage Industry Revenue Million Forecast, by Component 2019 & 2032
- Table 4: Global Digital Signage Industry Revenue Million Forecast, by Size 2019 & 2032
- Table 5: Global Digital Signage Industry Revenue Million Forecast, by Location 2019 & 2032
- Table 6: Global Digital Signage Industry Revenue Million Forecast, by Application 2019 & 2032
- Table 7: Global Digital Signage Industry Revenue Million Forecast, by Region 2019 & 2032
- Table 8: Global Digital Signage Industry Revenue Million Forecast, by Country 2019 & 2032
- Table 9: Digital Signage Industry Revenue (Million) Forecast, by Application 2019 & 2032
- Table 10: Global Digital Signage Industry Revenue Million Forecast, by Country 2019 & 2032
- Table 11: Digital Signage Industry Revenue (Million) Forecast, by Application 2019 & 2032
- Table 12: Global Digital Signage Industry Revenue Million Forecast, by Country 2019 & 2032
- Table 13: Digital Signage Industry Revenue (Million) Forecast, by Application 2019 & 2032
- Table 14: Global Digital Signage Industry Revenue Million Forecast, by Country 2019 & 2032
- Table 15: Digital Signage Industry Revenue (Million) Forecast, by Application 2019 & 2032
- Table 16: Global Digital Signage Industry Revenue Million Forecast, by Country 2019 & 2032
- Table 17: Digital Signage Industry Revenue (Million) Forecast, by Application 2019 & 2032
- Table 18: Global Digital Signage Industry Revenue Million Forecast, by Country 2019 & 2032
- Table 19: Digital Signage Industry Revenue (Million) Forecast, by Application 2019 & 2032
- Table 20: Global Digital Signage Industry Revenue Million Forecast, by Type 2019 & 2032
- Table 21: Global Digital Signage Industry Revenue Million Forecast, by Component 2019 & 2032
- Table 22: Global Digital Signage Industry Revenue Million Forecast, by Size 2019 & 2032
- Table 23: Global Digital Signage Industry Revenue Million Forecast, by Location 2019 & 2032
- Table 24: Global Digital Signage Industry Revenue Million Forecast, by Application 2019 & 2032
- Table 25: Global Digital Signage Industry Revenue Million Forecast, by Country 2019 & 2032
- Table 26: Global Digital Signage Industry Revenue Million Forecast, by Type 2019 & 2032
- Table 27: Global Digital Signage Industry Revenue Million Forecast, by Component 2019 & 2032
- Table 28: Global Digital Signage Industry Revenue Million Forecast, by Size 2019 & 2032
- Table 29: Global Digital Signage Industry Revenue Million Forecast, by Location 2019 & 2032
- Table 30: Global Digital Signage Industry Revenue Million Forecast, by Application 2019 & 2032
- Table 31: Global Digital Signage Industry Revenue Million Forecast, by Country 2019 & 2032
- Table 32: Global Digital Signage Industry Revenue Million Forecast, by Type 2019 & 2032
- Table 33: Global Digital Signage Industry Revenue Million Forecast, by Component 2019 & 2032
- Table 34: Global Digital Signage Industry Revenue Million Forecast, by Size 2019 & 2032
- Table 35: Global Digital Signage Industry Revenue Million Forecast, by Location 2019 & 2032
- Table 36: Global Digital Signage Industry Revenue Million Forecast, by Application 2019 & 2032
- Table 37: Global Digital Signage Industry Revenue Million Forecast, by Country 2019 & 2032
- Table 38: Global Digital Signage Industry Revenue Million Forecast, by Type 2019 & 2032
- Table 39: Global Digital Signage Industry Revenue Million Forecast, by Component 2019 & 2032
- Table 40: Global Digital Signage Industry Revenue Million Forecast, by Size 2019 & 2032
- Table 41: Global Digital Signage Industry Revenue Million Forecast, by Location 2019 & 2032
- Table 42: Global Digital Signage Industry Revenue Million Forecast, by Application 2019 & 2032
- Table 43: Global Digital Signage Industry Revenue Million Forecast, by Country 2019 & 2032
- Table 44: Global Digital Signage Industry Revenue Million Forecast, by Type 2019 & 2032
- Table 45: Global Digital Signage Industry Revenue Million Forecast, by Component 2019 & 2032
- Table 46: Global Digital Signage Industry Revenue Million Forecast, by Size 2019 & 2032
- Table 47: Global Digital Signage Industry Revenue Million Forecast, by Location 2019 & 2032
- Table 48: Global Digital Signage Industry Revenue Million Forecast, by Application 2019 & 2032
- Table 49: Global Digital Signage Industry Revenue Million Forecast, by Country 2019 & 2032
- Table 50: Global Digital Signage Industry Revenue Million Forecast, by Type 2019 & 2032
- Table 51: Global Digital Signage Industry Revenue Million Forecast, by Component 2019 & 2032
- Table 52: Global Digital Signage Industry Revenue Million Forecast, by Size 2019 & 2032
- Table 53: Global Digital Signage Industry Revenue Million Forecast, by Location 2019 & 2032
- Table 54: Global Digital Signage Industry Revenue Million Forecast, by Application 2019 & 2032
- Table 55: Global Digital Signage Industry Revenue Million Forecast, by Country 2019 & 2032
Frequently Asked Questions
1. What is the projected Compound Annual Growth Rate (CAGR) of the Digital Signage Industry?
The projected CAGR is approximately 8.40%.
2. Which companies are prominent players in the Digital Signage Industry?
Key companies in the market include LG Display Co Ltd, Barco NV, Samsung Electronics Co Ltd, Hitachi Ltd, Planar Systems Inc, Cisco Systems Inc, NEC Display Solutions Ltd, Goodview, Panasonic Corporation, Stratacache, Sony Corporation.
3. What are the main segments of the Digital Signage Industry?
The market segments include Type, Component, Size, Location, Application.
4. Can you provide details about the market size?
The market size is estimated to be USD 25.52 Million as of 2022.
5. What are some drivers contributing to market growth?
Convergence of Digital Signage with Cross-platform Media Tool; Evolution of Turnkey Solutions; Diminishing Cost of Infrastructure Leading to Higher Penetration.
6. What are the notable trends driving market growth?
OLED Display is Expected to Experience Healthy Growth.
7. Are there any restraints impacting market growth?
Poor Integration with Complex Business Requirements.
8. Can you provide examples of recent developments in the market?
May 2024 - Quest Technology Management and Samsung Electronics America have collaborated to launch a pioneering managed service tailored for small and midsize businesses (SMBs). This service is available through Telarus technology advisors. The comprehensive package streamlines content and device management and features advanced displays, empowering SMB owners to revamp their business settings and enhance their brand's visibility.
9. What pricing options are available for accessing the report?
Pricing options include single-user, multi-user, and enterprise licenses priced at USD 4750, USD 5250, and USD 8750 respectively.
10. Is the market size provided in terms of value or volume?
The market size is provided in terms of value, measured in Million.
11. Are there any specific market keywords associated with the report?
Yes, the market keyword associated with the report is "Digital Signage Industry," which aids in identifying and referencing the specific market segment covered.
12. How do I determine which pricing option suits my needs best?
The pricing options vary based on user requirements and access needs. Individual users may opt for single-user licenses, while businesses requiring broader access may choose multi-user or enterprise licenses for cost-effective access to the report.
13. Are there any additional resources or data provided in the Digital Signage Industry report?
While the report offers comprehensive insights, it's advisable to review the specific contents or supplementary materials provided to ascertain if additional resources or data are available.
14. How can I stay updated on further developments or reports in the Digital Signage Industry?
To stay informed about further developments, trends, and reports in the Digital Signage Industry, consider subscribing to industry newsletters, following relevant companies and organizations, or regularly checking reputable industry news sources and publications.
Methodology
Step 1 - Identification of Relevant Samples Size from Population Database


Step 2 - Approaches for Defining Global Market Size (Value, Volume* & Price*)

Note*: In applicable scenarios
Step 3 - Data Sources
Primary Research
- Web Analytics
- Survey Reports
- Research Institute
- Latest Research Reports
- Opinion Leaders
Secondary Research
- Annual Reports
- White Paper
- Latest Press Release
- Industry Association
- Paid Database
- Investor Presentations

Step 4 - Data Triangulation
Involves using different sources of information in order to increase the validity of a study
These sources are likely to be stakeholders in a program - participants, other researchers, program staff, other community members, and so on.
Then we put all data in single framework & apply various statistical tools to find out the dynamic on the market.
During the analysis stage, feedback from the stakeholder groups would be compared to determine areas of agreement as well as areas of divergence


